AAVEUSDT trade ideas

⚡️AAVEUSDT CMC TRADING ⚡️ FALLING WEDGEA falling wedge pattern has been identified in the AAVEUSDT pair within the hourly timeframe, signaling the potential for an upward momentum. The breakout above the upper boundary of the wedge is a significant development. Our anticipation involves a rally or movement towards the next major supply zone that has been highlighted.

#TOBTC #LQR #AAVE in Daily Time Frame , these fibo level are so important
AAVE is on a wedge classic pattern which is importat to break down
Red line works as Resistance
Allways DYOR!

AAVE/USDT Trading IdeaWe're discussing the development idea in the accumulation phase for the AAVE/USDT crypto pair.
In June 2022, there was a notable decline in the asset, hitting a local bottom of the existing bearish trend at $45.80. However, it confidently surged from this level, reaching $115.27, showing over a 150% increase . Later on, the asset chart displayed the formation of a descending triangle, accompanied by significant trading volumes.
Currently, we observe AAVE's price breaking out of the described triangle and starting to trade within an ascending channel , confined by values from $115.27. This might indicate a potential continuation of the accumulation phase with a possible price squeeze toward the local maximum. Hence, the present trends and price chart structure suggest interesting dynamics in the asset's movement.
Considering these trends, it's conceivable that the asset is preparing to surpass the local maximum of $115.27, paving the way for further upward movement. The initial target for this upward trend could be the strong resistance level at $200. If this level is successfully breached and bullish pressure is sustained, the subsequent potential target could be around $260.

AAVE locally downMonthly - Still bullish for continued growth. There's a chance of a pullback to 70, which could be a good opportunity to buy more. It's already too late to buy now.
Weekly - strong selling pressure visible. It also seems that prices are being capped, with a very high probability of a pullback.
Although if there's a breakout above the resistance at 110, then the path could clear up towards 200.
3-Day - two short signals - clearly not in favor of continued growth. The bullish momentum is almost extinguished.
Daily - looks weak. The buyers' index has nearly faded, although there are some signs of seller weakness, higher timeframes carry more weight.
Levels below 65 are worth buying at.

AAVEUSDT.P aggressive trend tradeMonthly chart context
Trend trade 1R
+ short impulse
+ SOW bar test / T2 level
+ resistance level
Aggressive Trend trade 1R
- long balance
+ expanding CREEK level
+ 2Ut+
+ weak test
+ first bearish bar closed entry
Calculated affordable stop
1 to 2 take profit

Review and analysis of AAVE in daily time frameIn examining the daily time frame of AAVE, we find that this coin, in the first stage of its price behavior, broke the liquidity level of the remaining orders and paved its way for its upward lag, and in a completely logical move with an upward move that led to the failure of the structure and formation A decision point and transfer orders in the form of compression is ready to start its main ascending log and this movement starts by returning to the decision point.

AAVE: Bullish Flag BreakoutTrade setup : Price is in an Uptrend. It briefly consolidated in a Bullish Flag pattern and broke out of it, with upside potential to $115 near-term and $125 medium-term. Previously, following a bullish breakout from Channel Down pattern, price broke above 200-day moving average, which signaled a bullish trend reversal to an Uptrend.
Pattern : Bullish Flag pattern. Short term small rectangle trading range between diagonal parallel lines. It moves counter to the prevailing price trend observed in a longer time frame on a price chart. It forms typically following a sharp advance and often indicates a small change in direction (or areas of consolidation) before the previous trend resumes. Flag pattern is among the most reliable continuation patterns that traders use because it generates a setup for entering an existing trend that is ready to continue. Trade is initiated on a breakout, if it is in the same direction as the prevailing trend. Also, with bullish flag patterns, traders prefer a breakout with an increase in volume but it isn’t a must.
Trend : Uptrend across all time horizons (Short- Medium- and Long-Term).
Momentum is Bullish (MACD Line is above MACD Signal Line and RSI is above 55).
Support and Resistance : Nearest Support Zone is $95, then $80. The nearest Resistance Zone is $115, then $125.

AAVE/USDT 📉 Trade AlertConsidering an entry in the range of $105 - $100 for AAVE/USDT. Watch out for resistance at $111. Set a stop loss at $96.9 to manage potential losses.
Keep a close eye on the market movement around the $111 resistance and adjust or exit the trade if necessary.
#CryptoTrading 💹🔄

#AAVEUSDT 12H Chart
Price tapped perfectly into the discounted 12h demand zone and moved up from there as predicted. MACD is not clear, RSI and EMAs are neutral. Price needs to close above the resistance area at $107 in order to expect further bullish movements.
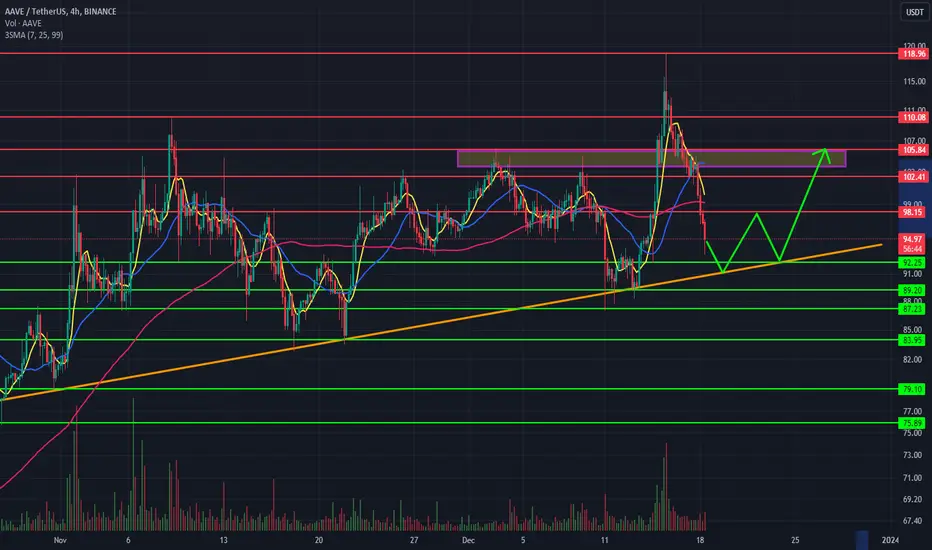
AAVEUSDTAnalysis of AAVE time form 4 hours
The current price is $94.72, according to the price ceiling of $120, which was hit on December 15, and a 20% drop to this area, it is expected that the yellow trend line will continue to fall and support it, and again up to the price range of $105 with 10% profit growth. Pay attention to the green support and red resistance lines.
Technical analyst: Amir Hassan Salek
#AAVEUSDT
✴️ Aave Double Bearish DivergenceLet's start with the divergence but there is also the volume signal.
No wait... First, this chart doesn't look like it needs a correction and this is a repeating theme, this and other pairs have room for additional growth before any correction is necessary but when Bitcoin goes down everything drops and this is likely what we are witnessing, the preparation for a sudden retrace.
Even though we are charting a drop and posting bearish we are 100% bullish long-term. These are only short-term moves and the market will recover really strong in 2024 and growth nicely, please be aware.
This is the MACD:
Peaked 9-Nov and the lower high 15-Dec is extreme.
This is the RSI:
Peaked 23-Oct and lower highs in December.
Aave produced a higher high 15-December vs 9-November, so this is a strong double bearish divergence.
The last two peaks, the candlesticks are bearish and yesterday AAVEUSDT closed below EMA10. It is still early but these signals are calling for a drop.
After the drop is over, we can expect additional growth.
This analysis is only invalidated on a rise and close above the last high.
Namaste.

AAVE USDTAAVE USDT retraced to 4th level fib levels waiting for the confirmation. 5th wave expected.

$aave longtook an aave long. published a bit late but yeah.
going to take a bit profit at around $109 and then let the rest ride longterm.

AAVE ANALYSIS🔮 #AAVE Analysis 🚀🚀
💸💸 As we said in our earlier post, #AAVE has performed well. We reached our first resistance very easily. 39.5% move done from the day we posted #AAVE analysis. If #AAVE breakout the first resistance and closes above the resistance then we will see more gain📈📈
📌Current Price -- $116.24
🔰Target Price -- $178.64
⁉️ What to do?
- We have marked crucial levels in the chart . We can trade according to the chart and make some profits. 🚀💸
🏷Remember, the crypto market is dynamic in nature and changes rapidly, so always use stop loss and take proper knowledge before investments.
#AAVE #Cryptocurrency #DYOR

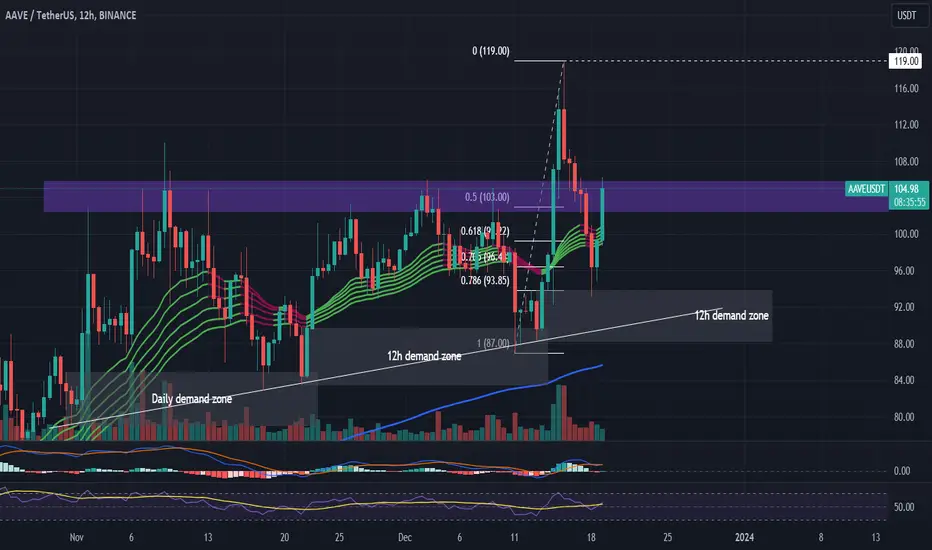
#AAVEUSDT 12H Chart
Price is currently bouncing off the support/resistance flip around the $105 area. MACD is showing bullish momentum, RSI is bought and EMAs are bullish. I expect price to move down to a more discounted area like the 12h breaker zone before continuing its overall bullish movements from there.

AAVE: Bullish Flag BreakoutTrade setup : Price is in an Uptrend. It briefly consolidated in a Bullish Flag pattern and broke out of it, with upside potential to $115 near-term and $125 medium-term. Previously, following a bullish breakout from Channel Down pattern, price broke above 200-day moving average, which signaled a bullish trend reversal to an Uptrend.
Pattern : Bullish Flag pattern. Short term small rectangle trading range between diagonal parallel lines. It moves counter to the prevailing price trend observed in a longer time frame on a price chart. It forms typically following a sharp advance and often indicates a small change in direction (or areas of consolidation) before the previous trend resumes. Flag pattern is among the most reliable continuation patterns that traders use because it generates a setup for entering an existing trend that is ready to continue. Trade is initiated on a breakout, if it is in the same direction as the prevailing trend. Also, with bullish flag patterns, traders prefer a breakout with an increase in volume but it isn’t a must.
Trend : Uptrend across all time horizons (Short- Medium- and Long-Term).
Momentum is Bullish (MACD Line is above MACD Signal Line and RSI is above 55).
Support and Resistance : Nearest Support Zone is $95, then $80. The nearest Resistance Zone is $115, then $125.

2R AAVE HODL SPOT WEEKLY BREAKTHROUGHBluechip with a Link kinda like configuration, breaking out of a huge range zone. No particular narrative to play, just one of the most important dApp in DeFi with good looking AT.
Swing spot trading

AAVEUSDT 1D LONG📈Hi all. AAVEUSDT has been forming a wedge for 1.5 years. I consider a long break/retest. Depending on your type of trading, it is possible to set up in spot and trade inside the wedge. Marked targets and levels on the chart.

AaveusdtSorry framed the chart pretty badly last post..
Obv starting to look like its going exponential also..

AaveusdtUpper range starting to look like the likely target..
My favourite technicals trader @smartcontracter likes the 3daily close and so do I tbh..
Looks like a range break is due here also tbh..
Long time spent in the lower range..


AAVE Had a Good Run | 👀🚀 What's Next for AAVE?💎 Paradisers, turn your attention to AAVEUSDT, which is currently showing a significant setup in the demand zone, reinforced by a recent Market Structure Shift (MSS). This arrangement indicates a substantial likelihood for a bullish trend.
💎 On analyzing AAVE's pattern, Aave has a consistent track record of breaking above its descending trendline, a clear sign of potential upward trends. It is presently approaching a major Bearish Order Block (OB) challenge, with enduring momentum above the EMA100, aiming for supply levels at $135.
💎 Nonetheless, in the ever-evolving crypto market, AAVE traders need to be prepared for diverse scenarios. If the anticipated bullish surge does not materialize, shifting to a rebound strategy from the support level at $78 will be imperative.
💎 A fall below this support level would call for a change in strategy, underscoring the need to reevaluate the bullish stance and adapt trading strategies in light of new market developments.
💎 Stay alert and strategically savvy, Paradisers. Your ParadiseTeam is dedicated to providing you with comprehensive analysis and guidance, helping you navigate these market conditions with informed and effective trading decisions.
