AAVE: Channel Down BreakoutAAVE (AAVE) technical analysis:
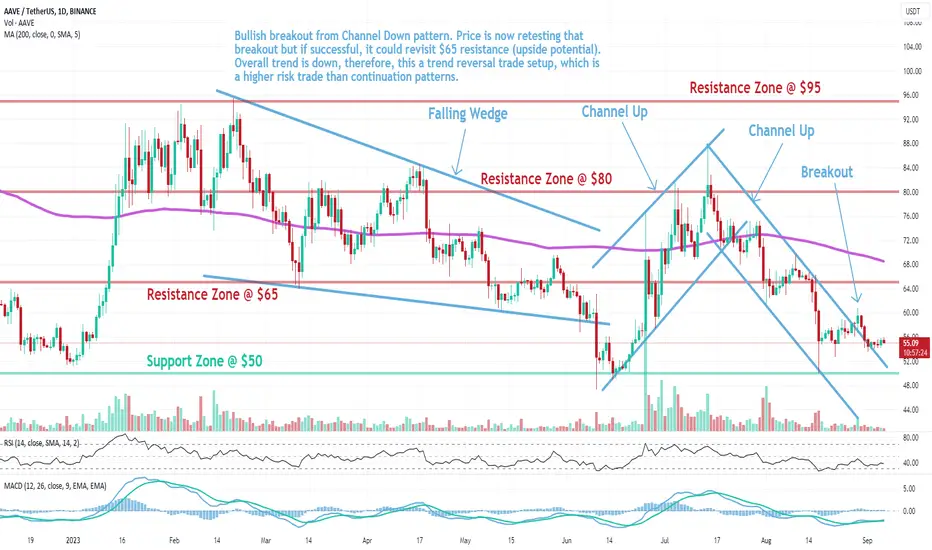
Trade setup : Bullish breakout from Channel Down pattern. Price is now retesting that breakout but if successful, it could revisit $65 resistance (upside potential). Overall trend is down, therefore, this a trend reversal trade setup, which is a higher risk trade than continuation patterns.
Pattern : Price was trading in a Channel Down pattern. With complete patterns (i.e. a breakout) – initiate a trade when the price breaks through the channel’s trendlines, either on the upper or lower side. When this happens, the price can move rapidly in the direction of that breakout.
Trend : Downtrend across all time horizons (Short- Medium- and Long-Term).
Momentum is Mixed as MACD Line is above MACD Signal Line (Bullish) but RSI < 45 (Bearish).
Support and Resistance : Nearest Support Zone is $50. The nearest Resistance Zone is $65 (previous support), then $80.
AAVEUSDT trade ideas
AAVE dump down to $26 - $18 rangeOne of the biggest defi coints is printing a bearish ascending triangle where wave (e) is currently underway.
Once completed, it should take price down to $26 - $18 range. Nice setup to short!

Brief Analysis——AAVEBTC fell yesterday and returned to the price before the pump. Affected by SEC, many tokens have experienced decline. The energy of Grayscale's victory was exhausted. Today's brief analysis will continue to review tokens that have been analyzed in the past. We chose NEAR and AAVE today.
As we expected, AAVE fell further after our last brief analysis. During the rebound in early August, the performance of the bulls was weak, and the price quickly came to the lows in June.
After the last round of decline, the bulls still have not strengthened, and the trading volume is almost half that of the previous two weeks. The nearly half-month rebound only covered the long red candle of Aug.17. The same as NEAR, when the entire market begins to rise, it is difficult for AAVE's bulls to strengthen (the slope of the green arrow is flat), but when the entire market begins to decline, the bears of NEAR was stronger than most tokens. On Wednesday, the bears' attack started again, and the price quickly approached 55, which is a support level.
Conclusion: The high probability decline has not ended. Although AAVE remains neutral on a large scale, you can clearly see the gap between bears and bulls from the chart. The bulls may strengthen after price approaches 55, but a reversal is unlikely. We set new resistance level at 60 and support level at 50.
Disclaimer: Nothing in the script constitutes investment advice. The script objectively expounded the market situation and should not be construed as an offer to sell or an invitation to buy any cryptocurrencies.
Any decisions made based on the information contained in the script are your sole responsibility. Any investments made or to be made shall be with your independent analyses based on your financial situation and objectives.

AAVEUSDT 12HBearish Flag and inverted Cup & Handle pattern on 12h chart. So we will test the support zone. Wait for a breakout.

AAVE: Channel Down BreakoutAAVE (AAVE) technical analysis:
Trade setup : Bullish breakout from Channel Down pattern. Price could revisit $65 resistance. Overall trend is down, therefore, this a trend reversal trade setup, which is a higher risk trade than continuation patterns.
Pattern : Price was trading in a Channel Down pattern. With complete patterns (i.e. a breakout) – initiate a trade when the price breaks through the channel’s trendlines, either on the upper or lower side. When this happens, the price can move rapidly in the direction of that breakout.
Trend : Downtrend across all time horizons (Short- Medium- and Long-Term).
Momentum is Mixed as MACD Line is above MACD Signal Line (Bullish) but RSI < 45 (Bearish).
Support and Resistance : Nearest Support Zone is $50. The nearest Resistance Zone is $65 (previous support), then $80.

AAVE/USDT is Likely Ready for Another Correction | AAVE Analysis💎Paradisers, let's focus on AAVE/USDT for a moment. It's currently navigating within a descending channel, and gearing up for a potential downward breakout soon.
💎If the breakout materializes as anticipated, it's likely to set off a rapid corrective phase.
💎 The dual confirmed order blocks on the shorter timeframe are worth noting. These are likely targets for the price, given the existing liquidity in those areas.
💎In past action, we observed a shift from demand to supply, leading to a notable decline in price and aiming for the prior Order Block (OB).
💎As always in the fast-paced crypto world, staying alert and adaptable is crucial. Keep your charts updated and stay tuned for more insights! 🌴

AAVE/USDT Another Push To EMAs? Hey traders👋
AAVE coin is back with another potential for a re-test to upper zones. We are still looking for price to go for that upper zone here from where on we will be looking to short this coin! Keeping both eyes opened here!
If you like ideas provided by our team you can show us your support by liking and commenting.
Yours Sincerely,
Swallow Team
Disclamer:
We are not financial advisors. The content that we share on this website are for educational purposes and are our own personal opinions.

AAVEUSDT needs to create a clear breakout to change the trendRetest of Weekly Level at $50: The current market situation involves AAVEUSDT retesting a critical weekly level around the $50 area. Weekly levels are notable historical price points that can have a significant impact on price movements.
Previous False Breakout and Head and Shoulders Pattern: The analysis indicates a prior occurrence of a false breakout and the formation of a head and shoulders pattern. The head and shoulders pattern comprises three peaks, with the middle peak (the "head") higher than the two flanking peaks (the "shoulders"). It often signifies a potential reversal from an uptrend to a downtrend.
Clear Breakout Zone: $60-$65: According to the analysis, for a potential long trade, the market needs to create a definitive breakout above the $60-$65 area. A breakout refers to a significant price movement above a key resistance level, indicating a potential shift to a bullish trend.
Plancton's Rules Application: In line with Plancton's Rules and aligned with the analysis, consideration is given to a new long position if the price successfully experiences the mentioned breakout. A long position involves acquiring the asset with the anticipation of its price increasing.
–––––
Follow the Shrimp 🦐
Keep in mind.
🟣 Purple structure -> Monthly structure.
🔴 Red structure -> Weekly structure.
🔵 Blue structure -> Daily structure.
🟡 Yellow structure -> 4h structure.
⚫️ Black structure -> <= 1h structure.
Follow the Shrimp 🦐

AAVE coin is on the long list with a level of 58.97Hello everyone!
AIHermes today identified the coin AAVE on the long list with a level of 58.97
Entry model - breakout! Leverage 10-20X
Stop short.
We see a long accumulation and a gorgeous squeeze!
1st target 60.79
Trade with us, trade better than us!
Today:
19 coins on the short list
18 coins on the long list


AAVEUSDT LONGAAVE USDT Currently at a level which can consider the came to the lowest price as per the Elliot wave count.
Anticipation is to have good five wave structure.

AAVE/USDT looking for potential bullish movementHey traders👋
AAVE coin seems ready for a little bullish run here. AAVE is going for some CME gaps which have been left unfilled so let's see what we will end up here with!
If you like ideas provided by our team you can show us your support by liking and commenting.
Yours Sincerely,
Swallow Team
Disclamer:
We are not financial advisors. The content that we share on this website are for educational purposes and are our own personal opinions.

AAVEusdtwaiting for pullback as of this moment. Long Position for AAVEusdt.
Disclaimer: The trading signals provided are for informational purposes only and should not be considered as financial advice. Trading in financial markets involves substantial risk and is not suitable for all investors. Past performance is not indicative of future results. The sender of these signals is not responsible for any losses incurred due to trading decisions based on the provided signals. Traders are advised to conduct their own research and seek advice from qualified financial professionals before making any trading decisions


AAVE/USDT ideal price movement! Hey traders 👋
AAVE coin is next on our watchlist here. After a nice breakdown there has to be a nice re-test to upper zones so let's wait out for it and catch the further drop that has to happen on AAVE coin here!
If you like ideas provided by our team you can show us your support by liking and commenting.
Yours Sincerely,
Swallow Team
Disclamer:
We are not financial advisors. The content that we share on this website are for educational purposes and are our own personal opinions.

AAVE/USDT possible re-test to happen!Hey traders 👋
Let's start this day with AAVE coin where we had a nice bearish movement which led the price to support zone. We see a nice formation on BB indicator where in combination with RSI it is almost in an oversold zones! We need to keep that eye on Support zone as if we see a breakdown then we will go for lower zones, if not then we good for a re-test!
Have a great start of the day
Swallow Team
P.S - If you like ideas provided by our team you can show us your support by liking and commenting.

AAVE .P perfomance in last 8 months in 2023This year has been a rough year for crypto. Downward pressure appears with all coins.
With the AAVE 2h frame, we see the price continuously entering the red area (possibly signaling a downtrend).
This is test result from the beginning of 2023 to the present including the current bearish period. Let's see how the S1-TM performs in a downtrend.
If you have an opinion or want to see results with Spot AAVEUSDT, please leave a comment.

AAVE USDT PERPHello Trader OKX:AAVEUSDT.P
the previous chart has a valid breakdown of the rising wedge pattern
wedge pattern.
but if you short the fear of experiencing a loss
so I decided to go long the area at 56.41.
This support is quite strong because there is a base in the dail time frame.
Please add a comment and Positive feedback and
constructive criticism are important to authors and the
community.
Disclamer: Not Financial Advice

AAVE/USDT possible next move? 👀 🚀 Aave Today Analysis Paradisers, cast your eyes on #AAVEUSDT! It's positioning itself for a potential shift, presenting us with a couple of intriguing scenarios. 👀
💎Recently, AAVEUSDT encountered a setback at OB-1, initiating an upward trajectory. However, with a slight loss in momentum, it's anticipated to revisit OB-1. Should it not maintain its stance at this level, expect an upward continuation from OB-2.
💎 Diving deeper into its movement, we've identified a transition from demand to supply. This led to a significant downward thrust. After securing liquidity below, the price is poised to resume its ascent, aiming to address the bearish OB.
💎 In the dynamic world of crypto, staying informed and adaptable is key. Stay tuned for more updates and enjoy your trading journey

AAVEIn a downtrend, we can enter a sell position by breaking the small uptrend line from the bottom and pullback to the downtrend line until the specified support areas.

AAVEUSDTAs the chart said you can see a broken triangle and most traders know that how much TP will be.

AAVEUSDTAs The chart said that a triangle is existing and I predict that it would break down but the TP(Heights) we expect not touch.
Redline is support to fly!

AAVE SMC 1H short ideaBINANCE:AAVEUSDT.P www.tradingview.com
Two trade setups are shown here.
Let's see which one may work best.
Wait for 5min confirmations.
Cheers guys!
