AAVE: Three Possible Trading OpportunitiesAAVE: Three Possible Trading Opportunities
During the past two weeks, AAVE is moving within a correction zone located between 68 - 75.4
The price is without any clear direction so far and it looks like it is accumulating volume for the next movement.
A move above or below the accumulation zone will validate the respective trading scenario.
Thank you and Good Luck!
AAVEUSDT trade ideas


AAVE/USDT Good For Bearish Movement?Hey traders 👋
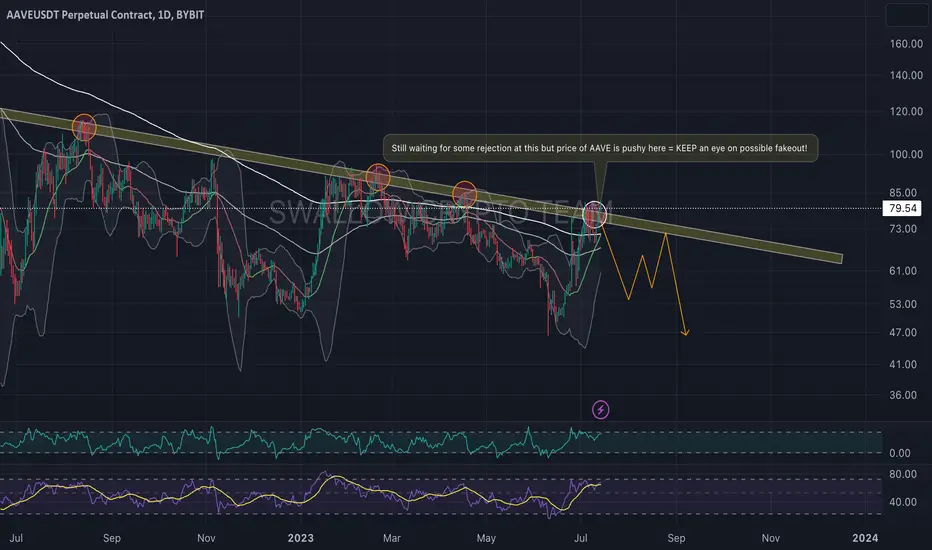
Another coin that caught our attention here is AAVE coin which we have been looking at for very long time! Price has been struggling to have a clean breakout from upper resistance which is good for us as we see see this coin to go for lower zones here! Keep and eye and let's catch that good trade here as well!
If you like ideas provided by our team you can show us your support by liking and commenting.
Yours Sincerely,
Swallow Team
Disclamer:
We are not financial advisors. The content that we share on this website are for educational purposes and are our own personal opinions.

AAVE clear on BULL trendreverted partent with DOJI one, also which cross of EMA 50 and 200 is a strong bull trend on AAVE, let bag them and get 25% profit

AAVEUSDT patternPrevious candlestick pattern looks it will dump to around $130-140 range and pump from there.

AAVE to 250?After bull run AAVE did long term consolidation and checked major support zone 3 times already. If only AAVE could break the downtrend line we might see 250 sooner than we think. 46 is the crucial support zone to hold.

🚨 Trade Update: AAVE/USDT (3-5x)🚨 Trade Update: AAVE/USDT (3-5x)
📈 Long Entry: 65 - 72.5
OTE (Optimal Trade Entry): 69
SL: 61
B/E Move: When it moves close to TP2
TPs:
Short Term: 73 - 74 - 76 - 80 - 85
Mid Term: 90 - 95 - 100 - 105 - 114
**Disclaimer: Past profits do not guarantee future results.
Is there a risk? Of course. The whole financial market is subject to risk; any fundamental reason or sudden change in the market sentiment can reverse the current market dynamic and cause a loss. Do not take excessive risks which you cannot afford to lose. There is no obligation to take this trade; please avoid the trade if you disagree with the trade analysis.
EDK FORUM TRADING®

AAVE something exciting Don't Miss Out..!!👀 AAVE Today analysis💎AAVE replicating the same wedge pattern, with a key observation being that it's trading in a strong demand area and below EMA 50.
💎Another aspect to consider is that if the price re-enters the box due to the market uncertainty that has been prevalent for the last few days, it might consolidate and, with increased selling pressure, invalidate the bullish momentum.
💎The POC of VRVP (Visible Range Volume Profile) is acting as resistance. If the price maintains its momentum above EMA 50, we could be in for a solid bullish move.
💎 In the ever-changing crypto universe, staying updated and adaptable is essential. Stay tuned for more updates and enjoy your trading journey!

AAVE USDT PHello Trader BINANCE:AAVEUSDT.P
AAVE if the 80.61 reject area has been confirmed to reject, release the buy limit area that I have made
Please add a comment and Positive feedback and
constructive criticism are important to authors and the
community.
Disclamer: Not Financial Advice

$AAVE | Potential 6.3%EURONEXT:AAVE | Potential 6.3%
| Targets On Chart
With #Bitcoin looking like it is setting up for a little more upwards pressure, it should take alts too - #AAVE has some nice bullish signs with a break in the RVD, local trend and 50 EMA as well as holding some nice support on the 200 Daily EMA

Brief Analysis ——AAVEAs a representative of liquidity, lending protocols are important to Defi. Based on the outstanding performance of COMP last week, we have a brief analysis of the tokens for three major lending platforms today. They are AAVE,COMP and MKR.
Since early June, AAVE has risen with fluctuation. In the case of no decay in bears, price reached a 43% gains. This is ahead of most tokens. The trading volume in the process were significantly higher than previous levels. The bears started to strengthen after a pin-bar on a green candle last Friday. Five consecutive red candles appeared and nearly recovered the gains last week.
Conclusion: Mostly fluctuation. The probability of falling is greater than that of rising. AAVE remains neutral on a large scale. But no matter whether the bulls strengthen or decay, the bears (red arrow) is always here. The duration and slope of the decline is the proof of the strength of the bears. So we reserve the possibility of falling. We set resistance level at 84 and support level at 60.
If you have any ideas, welcome to communicate with us:)
Disclaimer: Nothing in the script constitutes investment advice. The script objectively expounded the market situation and should not be construed as an offer to sell or an invitation to buy any cryptocurrencies.
Any decisions made based on the information contained in the script are your sole responsibility. Any investments made or to be made shall be with your independent analyses based on your financial situation and objectives.

aave buy now againBINANCE:AAVEUSDT this position has around 20% profit, and risk reward is 5 thats great , lets take it

AAVE about to make a moveLet's dive into the current chart setup of AAVE and analyze its potential breakout from a symmetrical triangle. Currently, AAVE is testing the lower leg of the triangle, and symmetrical triangles typically offer a 50/50 chance of breaking either up or down. However, let's zoom out to the daily time frame for a clearer perspective.
Upon examining the daily time frame, we observe that AAVE is within a descending triangle formation. This pattern often leans towards a downside breakout. Adding to this bias, the stochastic RSI and the MACD are both trending downwards.
Considering the broader context, I believe there's a higher probability for the triangle to break to the downside due to the daily time frame's descending triangle pattern.
It's crucial to keep an eye on this developing situation, as the measured move for an upside breakout is approximately 15%, while a downside move could reach around 12%. Remember, zooming out to the daily time frame gives us a more comprehensive outlook on AAVE's potential trajectory.
Happy trading, and stay tuned for further updates!


AAVEUSDT looks good for a long.AAVEUSDT Technical analysis update
Buy zone : Below $85.00
Stop loss : $74.50
Take Profit 1 : $95.00
Take Profit 2 : $115
Take Profit 3 : $135
Take Profit 4: $175
Thanks
Hexa

AAVE still on trackI'm still in my AAVE long, and I'm still looking for red resistance to touch. I wasn't expecting it to take this long... Well, I was 70/30 that it wouldn't take this long. Doesn't matter, because it has taken this long and I still have more days to wait I'm guessing. We shall see! This is not advice.

AAVE/USDT trying to breakout! Hey traders 👋
AAVE coin has been teasing that upper trend for some time now but yet still has some troubles to breakout from it! We are looking for a small fakeout here near that trend and for a nice turnover to happen!
If you like ideas provided by our team you can show us your support by liking and commenting.
Yours Sincerely,
Swallow Team
Disclamer:
We are not financial advisors. The content that we share on this website are for educational purposes and are our own personal opinions.
#AAVEUSDT #LQR #TOBTC #LaqiraProtocolSupport and resistance are specified in the chart. The levels are obtained from the confluence of static and fib levels. After confirming and matching with Bitcoin levels, you can open a position this analysis is not an offer to buy or sell.

Short AAVEthis coin has a good momentum , but it is facing with a heavy resistance area at 82$ . also it is in resistance at 4H chart . So I expect a drop from one of those places

aave shortBINANCE:AAVEUSDT has been reached his down going trend line , and it is supposed to be reject, lets take with risk risk reward 3

AAVEUSDT on daily support, long favorable towards 72.9We talked about this one going down to the daily support and potentially aim for the weekly support in coming days. That does not mean that a bounce shall not be expected from the daily support. The price has touched the daily support and I expect a bounce here towards 4h resistance 4HR1. This provides an opportunity for a long trade. The target of this trade should be close to 4h resistance zone 4HR1 which is around 72.9.

Falling Wedge FormationA typical falling wedge formation. The chances are worth a try. The point of loss cut is the bottom of the wedge.
