AAVE SHORT ALL trading ideas have entry point + stop loss + take profit + Risk level.
hello Traders, here is the full analysis for this pair, let me know in the comment section below if you have any questions, the entry will be taken only if all rules of the strategies will be satisfied. I suggest you keep this pair on your watchlist and see if the rules of your strategy are satisfied. Please also refer to the Important Risk Notice linked below.
Disclaimer
AAVEUSDT trade ideas

AAVEUSDT has big move to performAAVEUSDT has big move to perform after doing retracement at Fib 0.5 level, which is exactly falling at FVG.

AAVEUSDT → A false breakdown provokes a change of characterBINANCE:AAVEUSDT.P maintains a bullish market structure. The coin is consolidating, with bulls trying to hold their ground above the key support line.
Against the backdrop of a correction, the price is testing liquidity, with a false breakdown of support provoking a change in character to bullish within the local timeframe. Bulls are trying to maintain the bullish structure.
The price is breaking through the resistance of local consolidation, forming a change in character, but before growth, the market may close the gestalt in the form of an order block or liquidity located in the 249.5 zone.
Support levels: 249.11, 240.0
Resistance levels: 274.27, 280.47
Technically, the coin looks quite good and promising overall. If the bulls hold their ground in the 249-250 zone, then in the short to medium term, we could see good movement with the possibility of new highs...
Best regards, R. Linda!

Buy Trade Strategy for AAVE: Leading the Future of DeFi Title:
Buy Trade Strategy for AAVE: Leading the Future of DeFi Lending
Description:
This trading idea is based on AAVE, one of the most established and innovative protocols in the decentralized finance (DeFi) sector. As a decentralized liquidity protocol, AAVE allows users to lend, borrow, and earn interest on crypto assets without intermediaries. Its advanced features—such as flash loans, rate switching, and collateral swapping—have made it a favorite among both retail and institutional users. With consistent development, strong community support, and a transparent governance model, AAVE continues to lead the DeFi lending space, playing a fundamental role in shaping the future of on-chain finance.
Despite these strengths, the cryptocurrency market remains unpredictable. Regulatory changes, macroeconomic trends, and overall sentiment can significantly impact AAVE’s price and adoption. As with all crypto assets, trading AAVE involves inherent risks that must be managed carefully.
Disclaimer:
This trading idea is for educational purposes only and does not represent financial advice. Investing in cryptocurrencies like AAVE involves substantial risk, including the potential for total capital loss. Always conduct your own research, consider your financial situation, and consult with a financial advisor before making any investment decisions. Past performance is not a guarantee of future results.

AAVE Showing Strength — Key Breakout Level & Trade Setup🚀 AAVE Showing Strength — Key Breakout Level & Trade Setup (Short-Term Strategy)
Among major altcoins, AAVE stands out as one of the few maintaining its bullish structure.
A breakout above $258.54 can offer a solid entry opportunity in futures, supported by momentum and price structure.
---
🧠 Trade Setup Details:
🎯 Entry Trigger: Break and hold above $258.54
🛡️ Risky Stop-Loss: $253.95
🎯 First Target: $272.20 (favorable risk-to-reward ratio)
💰 Profit Strategy:
Either take profits at $272.20
Or hold the position and trail your stop to $248.94 to make the trade risk-free
---
📊 Extra Confirmation (1H Chart):
If RSI crosses above 70 on the 1-hour timeframe, it adds another layer of bullish confirmation and can be used as a momentum entry trigger.
---
✅ Summary:
AAVE is technically positioned for potential upside, and if price confirms strength above key levels, it presents a clean short-term long setup with well-defined risk parameters. One of the few altcoins still holding its bullish structure.

Short AAVE/USDAAVE/USDT – Sell Setup
1. Daily Bias: SELL
Downtrend confirmed
RSI breaking down
Price under resistance (282)
✅ Valid to look for sell
2. Trap / SFP
Price spiked above 253–255 then failed
Classic trap (SFP) setup
✅ Trap confirmed
3. Market Structure (M15)
Lower Highs & Lower Lows
Entry after pullback
✅ Structure supports sell
4. SL & TP
SL: Above trap high (254.99)
TP1: 237.52
TP2: 231.53
✅ SL & TP are logical
Entry Note:
Wait for confirmation (SFP, rejection, M5 signal).
❌ Do not use limit order blindly.
Summary:
Daily Bias: ✅
Trap: ✅
Structure: ✅
SL/TP: ✅
—
Let me know if you want this version saved or exported!

AAVE ANALYSIS🔮 #AAVE Analysis 💰💰
📊 #AAVE is making perfect and huge rounding bottom pattern in daily time frame, indicating a potential bullish move. If #AAVE retests little bit and breakout the pattern with high volume then we will get a bullish move📈
🔖 Current Price: $248
⏳ Target Price: $348
⁉️ What to do?
- We have marked crucial levels in the chart . We can trade according to the chart and make some profits. 🚀💸
#AAVE #Cryptocurrency #Pump #DYOR

AAVE possible spot swing playPossible rally in AAVE
- pretty good fundamentals in defi.
- divergence in weekly time frame
- price at the support area.
- price keep holding in this crucial support area in the middle of chaos tariff

Long AAVEAave's recent performance indicate strong bullish momentum with nearly 90% increase over the past month.
Consolidation is ongoing for a next leg-up.
Long setup is as in chart.
Disclaimer:
This analysis is based on my personnal views and is not a financial advice. Risk is under your control.

The chart of AAVE/USDT (weekly timeframe) shows a breakout from
🔍 Technical Overview
Pattern: Falling wedge (a bullish reversal formation).
Breakout: Clearly confirmed with strong bullish candles.
Support zone: Retested successfully around $160–$180 before continuation.
Current Price: ~$266.50
Weekly Gain: +14.81%
🎯 Upside Targets
Target 1: $373.63 — First major resistance zone.
Target 2: $505.35 — Long-term bullish target if momentum sustains.
📊 Interpretation
AAVE has completed a reversal structure and broken out with volume, suggesting strong bullish continuation.
Consolidation above $240–$250 will strengthen the move toward the next targets.
Failure to hold above $230 could signal a pullback retest before continuation.
✅ Summary
AAVE has shown a strong breakout from a long-term falling wedge, backed by volume and bullish structure. If market sentiment holds, the next targets are $373.63 and $505.35.

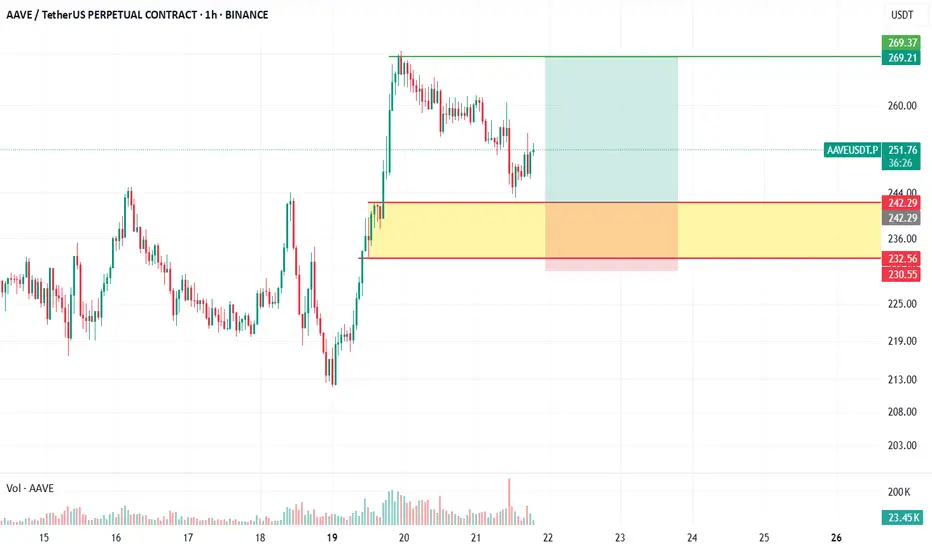
AAVEUSDT | A simple setupHi everyone, this is Dark Analysis .
Today I want to show you a simple Analysis on AAVE.
This pair is in a good bullish trend.so we have an entry on the order block shown on picture.
the momentum is good, and we have a 3-drive model here.
- SETUP
If the price reaches to this zone, I will open a buy position.
SL: 230.47
TP:269
RR:2.29
- ATTENTIONS
You can use any trigger for this trade.
Do not gamble ...
Feel free to comment your ideas.
Aave (AAVE): Expecting Overtake by Sellers at 200EMA Aave coin has recently broken from the 200EMA line, which has been holding the price down for quite some time now. We are looking for the price to retest that same EMA and fail the retest, upon which we will be trying to catch a downward movement to lower zones here.
Swallow Academy

AAVE (Aave): 100EMA Holding Price Down | Another Sell Incoming?Aave is seeing a good decline in price after each touch of the 100EMA, which we recently had again. We are going to look here for a decent movement to lower zones, which should give us at least 15% of market price movement; this, of course, only as long as we stay below the EMAs.
Swallow Academy

AAVEUSDT - UniverseMetta - Signal#AAVEUSDT - UniverseMetta - Signal
H4 - Formation of ABC structure in continuation of the upward trend. Stop behind the local minimum.
Entry: 256.92
TP: 269.60 - 286.82 - 297.27 - 313.94
Stop: 249.01

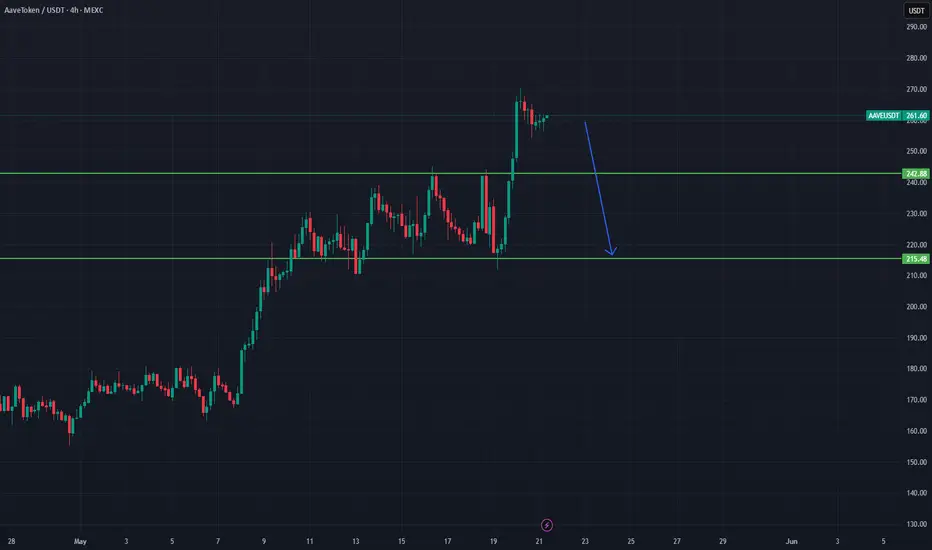
aave 4hA downward movement is expected in Aave, but after this correction movement, it may continue to rise from where it left off. Remember that the market is going through very positive days. If you are opening a downward transaction, you should definitely use a stop loss. If you are not opening a downward transaction, you can trade at cheaper prices after the correction movement. Lots of profits
quick monthly/day trade (rising wedge)shorting the correction on a rising wedge. heres the stats.
Rising wedge statistics
- In 82% of cases, the exit is bearish.
- In 55% of cases, a rising wedge is a reversal pattern.
- In 63% of cases, the pattern’s price objective is achieved when the support line is broken.
- In 53% of cases, the price makes a resistance pullback on the rising wedge’s support line.
- In 27% of cases, false breaks (false exits) appear.
Notes on rising wedges
- The contact points on the rising lines must be significant because otherwise it might be a flag.
- The steeper the rising wedge’s trend lines (rising strongly), the more severe the downward movement is at the breakout (exit from the chart pattern).
- False breaks (or false exits) give an indication of the direction of exit. If a false bearish break occurs, the exit will be upwards in only 3% of cases. Exploiting a false bearish break is therefore statistically low risk.
- Retracements are generally twice as fast as the rising wedge was in its formation.
- Pullbacks are detrimental to the pattern’s performance.
- The break out point (exit) generally occurs at 60% of the length of the rising wedge.
- Very wide rising wedges give better performance than narrow rising wedges.
For your information: A rising wedge is a reversal chart pattern. Its opposite is a falling wedge.
GL guys. Im using gmx to leverage this short.

AAVEAAVE Has broken resistance at 240-245 and created a new higher high at 270s, I am looking for the area to be tapped as seen on the graph.
Then look for a BOS and a confirmation which will be my entry


Aave —Full Correction Is Good (Low Prices)A "bear market" cannot develop after a full correction. It doesn't make sense...
AAVEUSDT peaked 16-December 2024 and it has been red. And some people are saying, "It is going to go down. The start of a bear market." It already went down. The bullish action here started in October 2024 and has been corrected by more than 100%.
The action before and lower prices were all part of a long-term consolidation phase.
It took forever. Aave bottomed in June 2022 and consolidated for so long. Then, last year, it produced a strong advance. This is not the end, this is the start.
This advance ends in a higher low as the chart shows today, from this higher low we will get a continuation and establishment of a bullish trend.
For a bull-trend all we need is higher highs and higher lows. It is inconceivable to think that AAVEUSDT will break below its June 2022 low. Impossible. It will be going up.
So we have the first high and now the higher low, when the next advance happens, you have your higher high and that's it, that's how a bull market works.
The next high will produce the same results. A correction and this correction will end higher compared to the current low. This higher low will produce one final advance and this advance will be marketwide, the 2025 bull market bull run, projected to happen in late 2025.
Now, you cannot buy when prices are high, only when prices are low.
Right now, AAVEUSDT is trading at the lowest prices possible. It is trading within the same consolidation range that was active since mid-2022. This is as low as it can go.
This is a great opportunity. No bear market, we are in a bull market year and we are only weeks away before the start of the 2025 bull market cycle, the best and biggest bullish phase since 2021. It will be awesome.
The chart reveals everything you need to know.
The bottom, but also the top.
Namaste.

AAVEUSDT | Red Box as a Key Resistance ZoneAAVEUSDT is approaching the highlighted red box, which looks set to act as a serious barrier for further upside. In my view, this zone represents an area where sellers have historically stepped in to halt rallies, so any approach here demands caution.
Why This Matters
• The red box aligns with past supply clusters on the footprint volume chart, showing where large sell orders absorbed buying pressure.
• Price has stalled at similar levels before, suggesting this area remains difficult to clear.
Trading Plan
Watch for Rejection
Look for price to rally into the red box and then show weakness on lower‑time‑frame charts—such as failed breakouts or lower highs—confirmed by increased sell‑side volume.
Confirm with CDV
A negative divergence or rising sell delta at this zone strengthens the case for a short or profit‑taking position.
Adapt Quickly
If, contrary to expectations, price breaks through with strong footprint volume and holds above on a retest, I’ll reconsider and shift my bias to the long side.
By treating the red box as a critical resistance and insisting on real volume and CDV confirmations, you maintain discipline and avoid chasing false breakouts. Trade only when the market validates your thesis.
📌I keep my charts clean and simple because I believe clarity leads to better decisions.
📌My approach is built on years of experience and a solid track record. I don’t claim to know it all but I’m confident in my ability to spot high-probability setups.
📌If you would like to learn how to use the heatmap, cumulative volume delta and volume footprint techniques that I use below to determine very accurate demand regions, you can send me a private message. I help anyone who wants it completely free of charge.
🔑I have a long list of my proven technique below:
🎯 ZENUSDT.P: Patience & Profitability | %230 Reaction from the Sniper Entry
🐶 DOGEUSDT.P: Next Move
🎨 RENDERUSDT.P: Opportunity of the Month
💎 ETHUSDT.P: Where to Retrace
🟢 BNBUSDT.P: Potential Surge
📊 BTC Dominance: Reaction Zone
🌊 WAVESUSDT.P: Demand Zone Potential
🟣 UNIUSDT.P: Long-Term Trade
🔵 XRPUSDT.P: Entry Zones
🔗 LINKUSDT.P: Follow The River
📈 BTCUSDT.P: Two Key Demand Zones
🟩 POLUSDT: Bullish Momentum
🌟 PENDLEUSDT.P: Where Opportunity Meets Precision
🔥 BTCUSDT.P: Liquidation of Highly Leveraged Longs
🌊 SOLUSDT.P: SOL's Dip - Your Opportunity
🐸 1000PEPEUSDT.P: Prime Bounce Zone Unlocked
🚀 ETHUSDT.P: Set to Explode - Don't Miss This Game Changer
🤖 IQUSDT: Smart Plan
⚡️ PONDUSDT: A Trade Not Taken Is Better Than a Losing One
💼 STMXUSDT: 2 Buying Areas
🐢 TURBOUSDT: Buy Zones and Buyer Presence
🌍 ICPUSDT.P: Massive Upside Potential | Check the Trade Update For Seeing Results
🟠 IDEXUSDT: Spot Buy Area | %26 Profit if You Trade with MSB
📌 USUALUSDT: Buyers Are Active + %70 Profit in Total
🌟 FORTHUSDT: Sniper Entry +%26 Reaction
🐳 QKCUSDT: Sniper Entry +%57 Reaction
📊 BTC.D: Retest of Key Area Highly Likely
📊 XNOUSDT %80 Reaction with a Simple Blue Box!
📊 BELUSDT Amazing %120 Reaction!
📊 Simple Red Box, Extraordinary Results
I stopped adding to the list because it's kinda tiring to add 5-10 charts in every move but you can check my profile and see that it goes on..

AAVE analysis : from Tokenomics to Technical analysisAAVE projet is on of the strongest projects in crypto space.
The whales present in this project count for 70% and the majority of them holds their wallets at least 2 years from now.
The analysis of the supply demonstrates that during the accumulation phase 3% of the total supply have been added to the market without any major impact on the price , that means that the whales have intention of accumulating this token.
The anchored volume profil also demonstrates that we are near the value zone.
From my technical analysis I expect a first target of $400. Then we will begin to see the first distribution movement of the whales.

aave long to $241.5Just now opened a long position on aave. Targeting $241.5
However I'll scale out 50% at $236.14 just in case the market doesn't have enough momentum to push higher
Time sensitive
Stop: $221.07 or lower

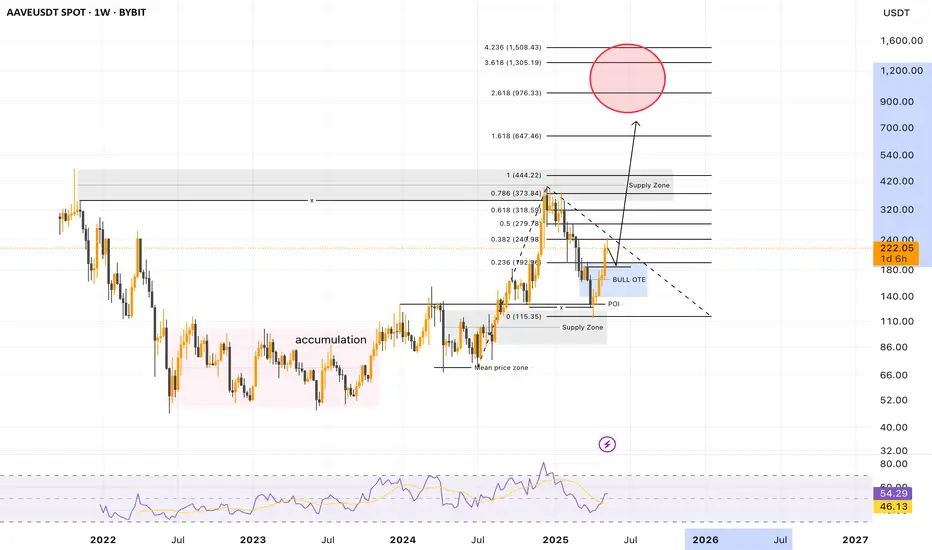
AAVE Technical Analysis (1W)
🧱 1. Market Structure
Between mid‑2022 and late-2023, AAVE moved within a prolonged accumulation phase, typical of a cycle bottom with extended compression.
This phase allowed the price to build a solid base before launching a first bullish leg, which topped out at the range high in early 2024.
At that point, the price compressed again near the equilibrium (mean price zone) of the previous range before initiating a clear distribution phase (April → December 2024).
At the top, AAVE met strong resistance within a major supply zone, without printing a new ATH a healthy sign for mid-term market structure.
Price then started a controlled correction, retracing 100% of the OTE zone from the distribution move (from equilibrium to supply).
The bounce occurred right on a key breaker block, which had already reacted to the equilibrium level prior to the first impulse.
From that local bottom, momentum has resumed, suggesting that the second phase of the distribution cycle may be underway.
🧲 2. Key Reload Zone
AAVE has recently revisited its BULL OTE zone, aligning perfectly with :
- A precise POI (Point of Interest)
- The breaker block
🟢 This kind of clean reaction from a high-confluence reaccumulation zone supports the idea of a structurally sound bounce and the beginning of a new bullish push.
🎯 3. Technical Targets & Scenario
If this bounce holds, here are the next technical targets :
🔁 Reclaim the supply zone between $340–$460
🚀 If this area breaks with volume, the market could aim for new highs around $700–$1,100
Such a move would confirm a second bullish leg of the macro cycle, with higher breakout potential.
🧠 4. Behavioral Insight
The weekly RSI shows signs of recovery after a long compression, momentum is awakening.
The Accumulation → Expansion → OTE Retest → Continuation structure is textbook for the early stages of a major bull cycle.
👉 Price action around the $340–$460 supply zone will set the tone for what comes next.
✅ Conclusion
AAVE is currently displaying a clean, cyclical structure, ideal for swing traders and mid-term investors :
🔁 Accumulation → Expansion → Retest → Reaccumulation → 🚀
🧨 AAVE may be on the verge of kicking off a new explosive bull cycle.