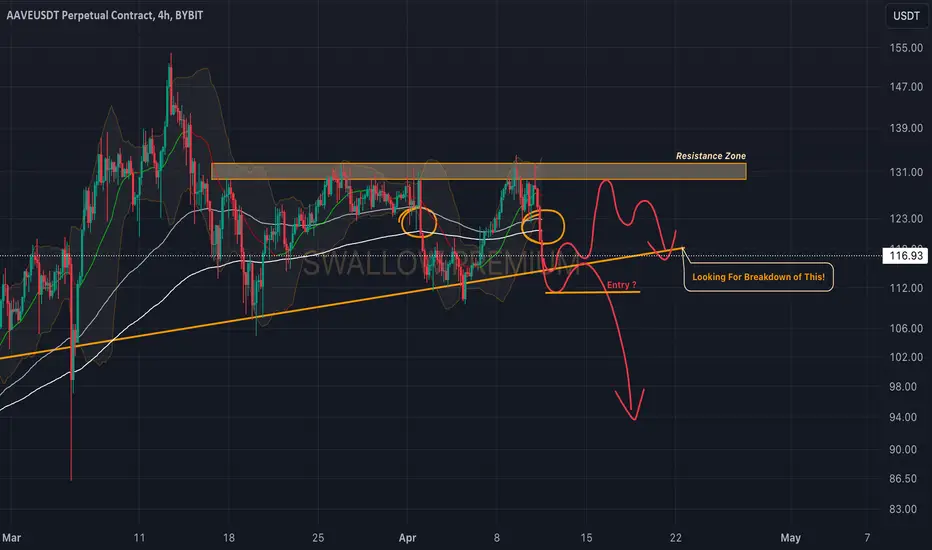
AAVE(AAVE): Sharp Break of EMAs (100&200)Aave caught our attention with a not-so-sharp break of EMAs, where last time we had a similar move but got rejected from the trend line there.
We are looking here for a potential touch of that same trend again, and if we break it this time, we might see some great downward movement here!
Swallow Team
AAVEUST trade ideas
AAEVE 3D | HTF PlanAAEVE 3D | HTF Plan
If the price closes above the blue box, IMO the first target will be the red circle area. Any pullback above the weekly S/R of $109.28 could be a buying opportunity.
Happy tradings

#AAVE/USDT#AAVE
The price is moving in an upward channel on a 3-day frame
The price rebound more than once at the lower border of the channel at the price of 50 is evidence of the strength of the channel border and the expectation of a rise
We have a higher stability moving average of 100
Likewise, there is a trend in which the price touched the RSI and rebounded from it
Entry price is 0112
First goal: 132.97
The second goal is 151.92
The third goal is 175.74

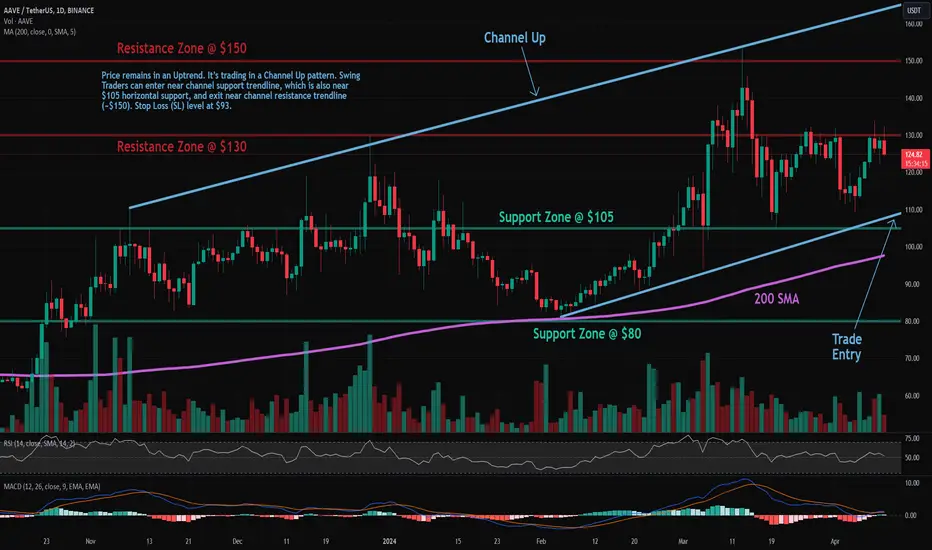
AAVE: Channel Up PatternTrade setup : Price remains in an Uptrend. It’s trading in a Channel Up pattern. Swing Traders can enter near channel support trendline, which is also near $105 horizontal support, and exit near channel resistance trendline (~$150). Stop Loss (SL) level at $93.
Pattern : Price is trading in a Channel Up pattern. With emerging patterns, traders who believe the price is likely to remain within its channel can initiate trades when the price fluctuates within its channel trendlines. With complete patterns (i.e. a breakout) – initiate a trade when the price breaks through the channel’s trendlines, either on the upper or lower side. When this happens, the price can move rapidly in the direction of that breakout.
Trend : Uptrend across all time horizons (Short- Medium- and Long-Term).
Momentum is Mixed as MACD Line is above MACD Signal Line (Bullish) but RSI ~ 50 (Neutral).
Support and Resistance : Nearest Support Zone is $105, then $80. The nearest Resistance Zone is $130, then $150 and $200.
AAVE /Usdt 1h. LONGHello traders. As you see price broken long time down trendline so still i am waiting for breaking 130$ level to up and price breaks last higher low for confirmation
. So based on your strategy you can made a profit i think
First tp is around 150$

📊#AAVE will rise according to cup-handle structure📈🧠Judging from the daily-level cycle, after completing the double bottom long target, we made daily-level corrections, and then broke through the neckline again, which means that a new bull trend has emerged with a high probability of breaking through the short defense point (198.71)🎯
➡️From an hourly perspective, we have constructed a cup-handle bullish structure near the neckline. With the new bullish structure as the driving force for the rise, there is a high probability that we will break through the resistance zone above.📈
🤜If you like my analysis, please like 💖and share it💬
💕 Follow me so you don't miss out on any signals and analyze 💯

AAVE/USDT - Aave: SuperTrend BBand Breakout◳◱ On the $AAVE/ CRYPTOCAP:USDT chart, the Supertrend Bband Breakout pattern suggests a consolidation phase that could precede a trend continuation or reversal. Traders might observe resistance around 133.28 | 143.73 | 166.13 and support near 110.88 | 98.93 | 76.53. Entering trades at 124.43 could be strategic, aiming for the next resistance level.
◰◲ General info :
▣ Name: Aave
▣ Rank: 73
▣ Exchanges: Binance, Kucoin, Bybit, Huobipro, Gateio, Mexc
▣ Category/Sector: Financial - Lending
▣ Overview: Aave is an open-source and non-custodial protocol to earn interest on deposits and borrow assets with a variable or stable interest rate. It also enables ultra-short duration, uncollateralized flash loans designed to be integrated into other products and services.
◰◲ Technical Metrics :
▣ Mrkt Price: 124.43 ₮
▣ 24HVol: 9,142,592.597 ₮
▣ 24H Chng: 2.784%
▣ 7-Days Chng: -3.82%
▣ 1-Month Chng: -5.39%
▣ 3-Months Chng: 29.03%
◲◰ Pivot Points - Levels :
◥ Resistance: 133.28 | 143.73 | 166.13
◢ Support: 110.88 | 98.93 | 76.53
◱◳ Indicators recommendation :
▣ Oscillators: NEUTRAL
▣ Moving Averages: STRONG_BUY
◰◲ Technical Indicators Summary : BUY
◲◰ Sharpe Ratios :
▣ Last 30D: -0.90
▣ Last 90D: 1.47
▣ Last 1-Y: 0.84
▣ Last 3-Y: 0.20
◲◰ Volatility :
▣ Last 30D: 0.94
▣ Last 90D: 0.85
▣ Last 1-Y: 0.77
▣ Last 3-Y: 1.10
◳◰ Market Sentiment Index :
▣ News sentiment score is N/A
▣ Twitter sentiment score is 0.62 - Bullish
▣ Reddit sentiment score is 0.43 - Bearish
▣ In-depth AAVEUSDT technical analysis on Tradingview TA page
▣ What do you think of this analysis? Share your insights and let's discuss in the comments below. Your like, follow and support would be greatly appreciated!
◲ Disclaimer
Please note that the information and publications provided are for informational purposes only and should not be construed as financial, investment, trading, or any other type of advice or recommendation. We encourage you to conduct your own research and consult with a qualified professional before making any financial decisions. The use of the information provided is solely at your own risk.
▣ Welcome to the home of charting big: TradingView
Benefit from a ton of financial analysis features, instruments and data. Have a look around, and if you do choose to go with an upgraded plan, you'll get up to $30.
Discover it here - affiliate link -

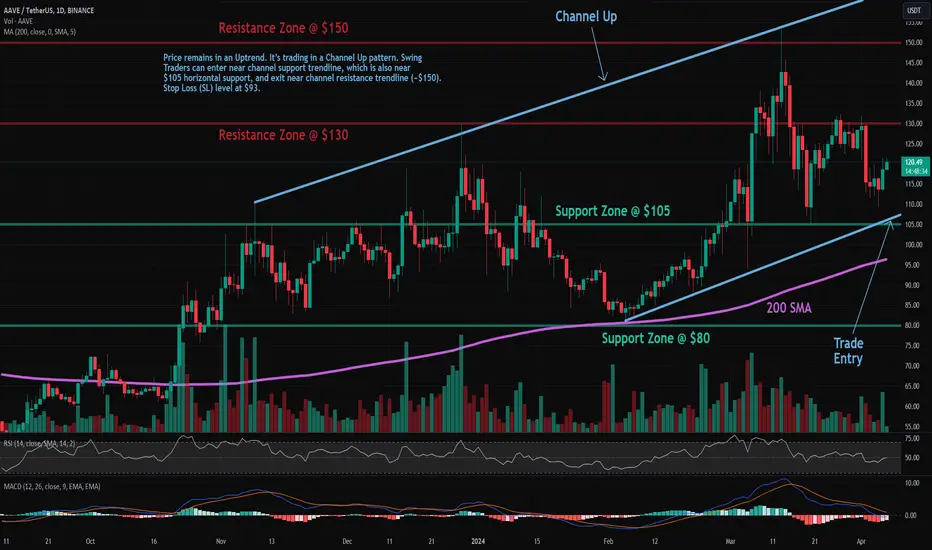
AAVE: Channel Up PatternTrade setup : Price remains in an Uptrend. It’s trading in a Channel Up pattern. Swing Traders can enter near channel support trendline, which is also near $105 horizontal support, and exit near channel resistance trendline (~$150). Stop Loss (SL) level at $93.
Pattern : Price is trading in a Channel Up pattern. With emerging patterns, traders who believe the price is likely to remain within its channel can initiate trades when the price fluctuates within its channel trendlines. With complete patterns (i.e. a breakout) – initiate a trade when the price breaks through the channel’s trendlines, either on the upper or lower side. When this happens, the price can move rapidly in the direction of that breakout.
Trend : Neutral on Short-Term basis and Uptrend on Medium- and Long-Term basis.
Momentum is Mixed as MACD Line is below MACD Signal Line (Bearish) but RSI ~ 50 (Neutral). MACD Histogram bars are rising, which suggests that momentum could be nearing another upswing.
Support and Resistance : Nearest Support Zone is $105, then $80. The nearest Resistance Zone is $130, then $150 and $200.
AAVE ChartNOT FINANCIAL ADVISOR Same with GETTEX:KDA CRYPTOCAP:AAVE Will bouncing to $418 and AAVE is a defi project it will pump because of CBDC naration. so i think AAVE is a good project

AAVE: Channel Up PatternTrade setup : Price remains in an Uptrend. It’s trading in a Channel Up pattern. Swing Traders can enter near channel support trendline, which is also near $105 horizontal support, and exit near channel resistance trendline (~$150). Stop Loss (SL) level at $93.
Pattern : Price is trading in a Channel Up pattern. With emerging patterns, traders who believe the price is likely to remain within its channel can initiate trades when the price fluctuates within its channel trendlines. With complete patterns (i.e. a breakout) – initiate a trade when the price breaks through the channel’s trendlines, either on the upper or lower side. When this happens, the price can move rapidly in the direction of that breakout.
Trend : Downtrend on Short-Term basis and Uptrend on Medium- and Long-Term basis.
Momentum is Mixed as MACD Line is below MACD Signal Line (Bearish) but RSI ~ 50 (Neutral).
Support and Resistance : Nearest Support Zone is $105, then $80. The nearest Resistance Zone is $130, then $150 and $200.

AAVE/USDT I BUY SETUP✔︎📈 BINANCE:AAVEUSDT.P SIGNAL
✔︎ENTRY : 126.82
🏓 TARGETS :
✔︎ T1 : 132.62
✔︎ T2 : 144.95
✔︎ T3 : 156.15
✘ STOP : 144.95
🚦Stop Trigger:
• If you make capital management: Stop is activated when one candle opening and closing
below the stop level of the same time frame of the signal.
• If you don't make capital management: Stop is direct without waiting for the candle to close.
💡Risk management :
• Enter the trade with 10% to 20% of your capital to reduce risk and save cash to enter other opportunities.
• Sell (25% to 50%) on (T1) and don't move your stop-loss.
• Sell 50% on (T2) and move your stop loss to the entry point.
• You are safe now, and the next 25% is up to you.
💡Reason for this trade:
This trade gives my trading system a sign of strength:
• My trading system is based on liquidity and reversal zones.
• When the liquidity is swept from one side under certain conditions, we will wait for the price on the other side.
The liquidity will attract the price like a magnet.
• the first side that has been swept:
1- previous weekly low
2- failure swing point
• Opposite side targets:
1- previous monthely high
2- engineering liquidity
3- liquidity void
💡Entry setup
1- reclaim range 61.8 fibo
⚠️WARNING:
• I'm not a financial advisor.
• Do your own research (DYOR).

AAVE: Channel UpTrade setup : Price remains in an Uptrend. It’s trading in a Channel Up pattern. Near term, if price breaks back above $130, it could revisit $150 for +15% upside potential.
Pattern : Price is trading in a Channel Up pattern. With emerging patterns, traders who believe the price is likely to remain within its channel can initiate trades when the price fluctuates within its channel trendlines. With complete patterns (i.e. a breakout) – initiate a trade when the price breaks through the channel’s trendlines, either on the upper or lower side. When this happens, the price can move rapidly in the direction of that breakout.
Trend : Uptrend across all time horizons (Short- Medium- and Long-Term).
Momentum is Mixed as MACD Line is below MACD Signal Line (Bearish) but RSI > 55 (Bullish). MACD Histogram bars are rising, which suggests that momentum could be nearing another upswing.
Support and Resistance : Nearest Support Zone is $105, then $80. The nearest Resistance Zone is $130, then $150 and $200.

AAVE Long idea. i believe that will happen. it is possible for this scenario to happen in most altcoins, if bitcoin does not fall below 68k, we are still in the bull. Good Luck. make money.

AAVE - USDT Update 29/03/2024G-Money's short version analysis based purely on technical analysis only, no nonsense "BS":
AAVE/USDT - low volume pair,
Stop Loss (SL): @ 107.11 USDT
Entry Point: @ 117.40 USDT
Take Profit (TP): @ 138.51 USDT
PS: ( 1 ) Remember: recommended re-enter area is between Stop Loss (ST) & Entry Point.
( 2 ) If price went half way between Entry Point & Take Profit (TP), be patient please & wait for price retracement to ( 1 )- EP-SL area or for the next new set up ;)

AAVEUSDT SHORT OUTLOOKHello Traders, this is outlook that i think might be work. All Entry, Stop Loss, and Take Profit its already showed up. All trade it is on yourself. DYOR.

Aave(Aave): Looking For BreakoutAave is looking sweet after having that nice bounce from 100EMA We are seeing a good upward movement trend forming here with a potential breakout to follow it as well. If all plays out nicely, we should see a good movement here for sure!
Swallow Team


AAVE - BUY SETUP (NOV 2023)AAVE - BUY SETUP (NOV 2023)
Based on technical analysis, the current setup of this coin appears to offer a favorable buying opportunity. The price action and Key indicators signal promising trends, suggesting a potential advantageous entry point. However, prudent consideration of market volatility and risk management is essential before making any investment decisions in the cryptocurrency market.

AAVEUSDT - Bouncing back from the support#AAVEUSDT (4H Chart) Technical Analysis Update
AAVE is bouncing back from the support.
As you can see in the chart, this is the 4th time its bouncing back from support and every time it bounced back from the support it made significant gain.
AAVE/USDT currently trading at $85.24
Entry Level :$ 85-84
Stop Loss: Below $82.52
Resistance level 1(Target) : $87.48
Resistance Level 2(Target): $91.9
Resistance Level 3(Target): $95
Resistance Level 4(Target): $99.65
Risk Reward Ratio : 1:5.2
Max Leverage: 5X
ALWAYS KEEP STOP LOSS...
Please Follow us, Like, Share and Comment your thoughts

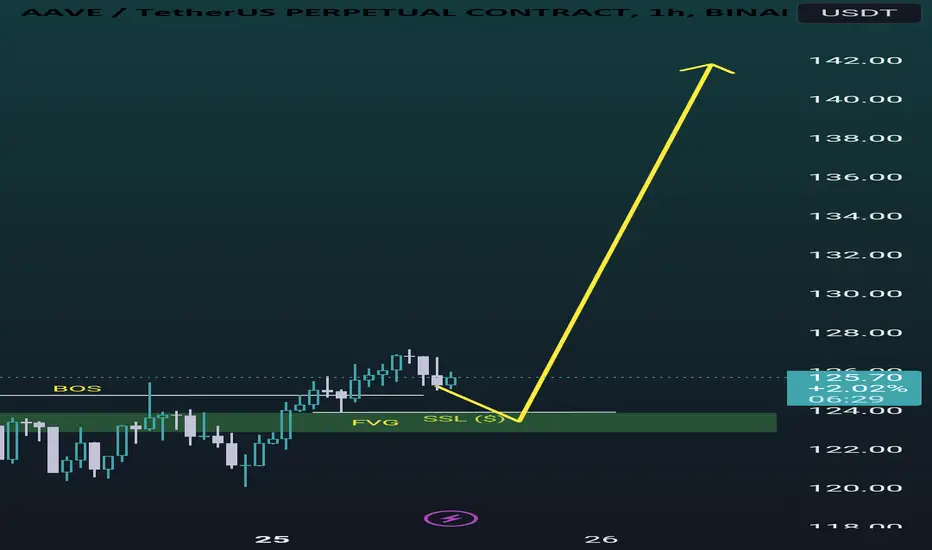
Aave bullish structure continue AAVE/USDT 1H Chart.
A clear break of structure (BOS) happened which has left a fair value gap.
This FVG is our Poi to Enter the Trade.
Do your analysis.
Aave has several unique selling points this year!Aave has several unique selling points when compared with competitors in an increasingly crowded market. During the DeFi craze in the summer of 2020, it was one of the biggest projects in terms of the total value of crypto locked in its protocol. The project allows people to borrow and lend in about 20 cryptocurrencies, meaning that users have a greater amount of choice.

AAVE IS VERY BULLISHFrom the place we inserted "start" on the chart, it looks like a diametric has started.
Wave D seems to be a diametric, and only wave g is left of this diametric. In the coming days, with the completion of wave g from D, the bullish wave E is expected to start.
By maintaining this range, it is expected to move towards TPs.
Closing a daily candle below the invalidation level will violate the analysis.
For risk management, please don't forget stop loss and capital management
When we reach the first target, save some profit and then change the stop to entry
Comment if you have any questions
Thank You

AAVE/USDT probability of bullish continuation from demand? 👀🚀💎 Paradisers, brace yourselves for a captivating chapter in the #AAVEUSDT saga, with signs pointing to a bullish breakout from its current stronghold.
💎 After facing resistance in a tough supply zone, #AAVE has intriguingly navigated through buyer territory. This maneuver hints at a potential dip before embarking on a bullish trajectory from the key demand level of $106.06. A surge of bullish energy here could propel EURONEXT:AAVE towards a significant challenge against the looming supply zone overhead.
💎 In the ever-shifting crypto arena, flexibility in strategy becomes paramount. If #AAVE stumbles at this critical juncture, adapting swiftly could be our ace in the hole.
💎 Enter Plan B: eyeing a bullish charge from a deeper demand level at $98.56. This becomes our vigil point, where a breach might signal an early transition to bearish trends for #AAVE. 🌴💰
