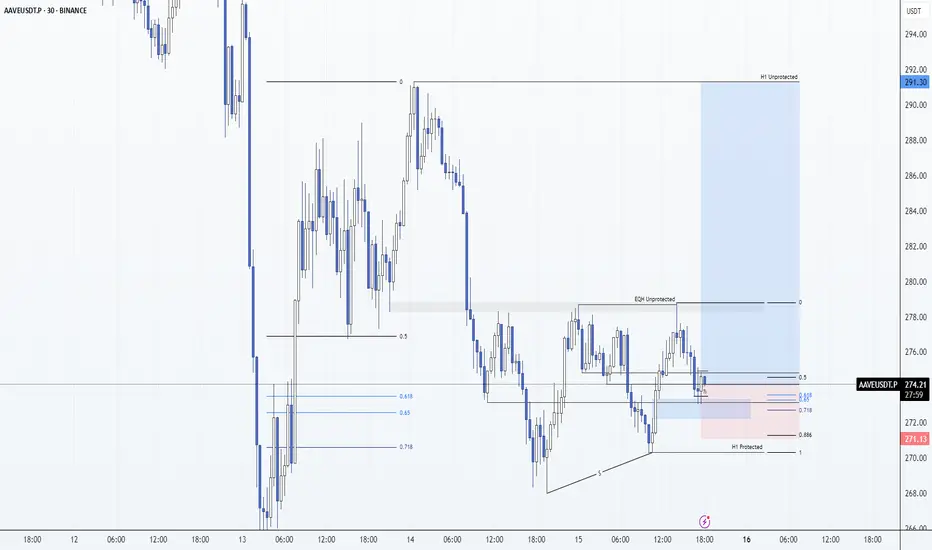
AAVE: Short 16/06/25Trade Direction:
AAVE Short
Risk Management:
- 0.5% Risk
Reason for Entry:
- H4 Ts
- H4 HTF Bearish
- H4 Overbought
- LTF showing signs of weakness
Additional Notes:
- Target EQHs then HTF DOL at 291
- Hedge against my Render Spot Long
AAVEUST trade ideas

#AAVE/USDT Analysis 📊 #AAVE/USDT Analysis 📊
🔹 CRYPTOCAP:AAVE broke out of the triangle pattern to the upside 🚀
🔹 Price tapped the 1H IFVG, which aligns perfectly with the OTE level — looking primed for a long setup 🎯
Patience + precision = sniper entry 💥

AAVE: Long 15/06/25Trade Direction:
AAVE Long
Risk Management:
- Risk halved because of weekend
- Halved again as counter HTF trend (Bearish)
- 0.25% risk
Reason for Entry:
- OTE Retracement
- Failure to displace on this bearish leg
- Key support
- Oversold M15
- M5 Ts
- M5 Bull Div
- H1 and M30 FVG
Additional Notes:
- Target EQHs then HTF DOL at 291
- Probably one of the weaker alts and if btc rolls over this will get stopped. If it breaks out of EQHs expect that imbalance to get aggressively swept to 291.
- SL At 0.886 retracement because my system dictates if the FVG gets fully mitigated we are going to sweep the H1 Protected
- Losing FVG (Fully mitigating it) would invalidate this idea.
- Highly risky as no MSB / CHoCH has formed for bulls.
Last trade of the day for me. Until I get a potential short trigger above 106,500 btc no more trades till tomorrow. Have a good weekend.
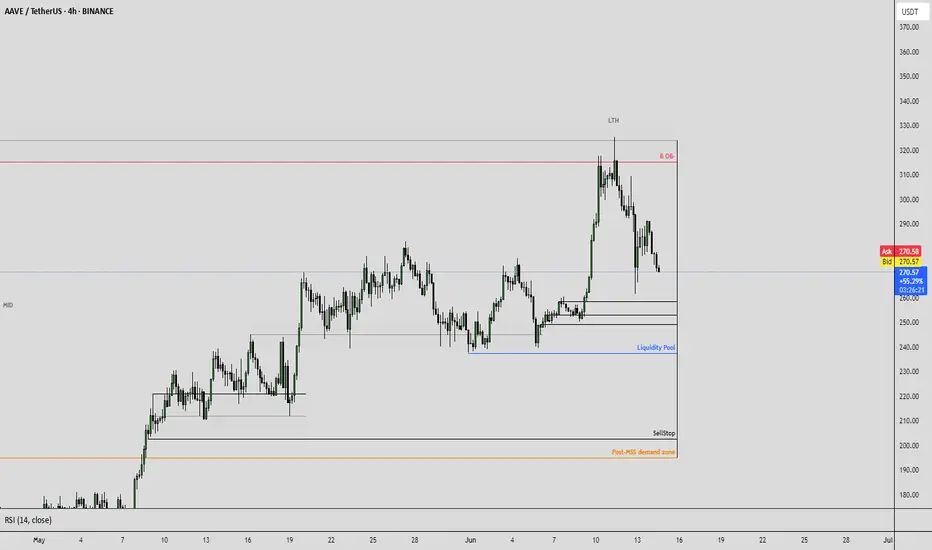
AAVEConclusion (How the Post-MSS Demand Zone connects to structure):
The Post-MSS demand zone has served as the foundation for the current bullish reversal and represents the base of this new uptrend.
As long as this zone isn't broken clearly and with high volume, the higher time frame bias remains bullish.
Any move lower from here should be viewed as a retracement to collect liquidity, not necessarily a trend reversal.

AAVE 4HConclusion (How the Post-MSS Demand Zone connects to structure):
The Post-MSS demand zone has served as the foundation for the current bullish reversal and represents the base of this new uptrend.
As long as this zone isn't broken clearly and with high volume, the higher time frame bias remains bullish.
Any move lower from here should be viewed as a retracement to collect liquidity, not necessarily a trend reversal.
AAVEConclusion (How the Post-MSS Demand Zone connects to structure):
The Post-MSS demand zone has served as the foundation for the current bullish reversal and represents the base of this new uptrend.
As long as this zone isn't broken clearly and with high volume, the higher time frame bias remains bullish.
Any move lower from here should be viewed as a retracement to collect liquidity, not necessarily a trend reversal.

AAVEUSDT 📊The current price BINANCE:AAVEUSDT is trading in a range between 275 and 240 dollars, and it’s likely we’ll see a fake breakout to 300 dollars. After this move, the price is expected to correct to 240 dollars and then head for a bigger move toward 320 dollars and higher.
📈If the 240-dollar level breaks, the next support levels at 210 and 175 dollars should be watched.
🔼Support Levels: 240, 210, 175 dollars
🔽Resistance Levels: 275, 300, 320 dollars

Last Chance to Catch AAVE Before Liftoff! Retest Almost CompleteYello, Paradisers! Are you ready to catch the next big mover before the herd wakes up? #AAVE is now setting the stage for a potentially explosive move, and this retest might be the last stop before liftoff!
💎After forming the low of the inverse head and shoulders, AAVE has been riding an ascending channel, a structure that usually supports sustained bullish trends. Recently, price broke through the neckline of that pattern and is now retesting it, offering us a textbook technical setup.
💎#AAVEUSDT has been holding the neckline supports strongly at $275 to $265 levels. This is the critical area to watch. If bulls successfully defend this zone, we could see price push back up toward $310, which aligns with the midline of the ascending channel and represents the first resistance.
💎If momentum carries through and that level is cleared, AAVE has open skies toward the $370–$400 range. That’s the 52-week high zone, and it coincides with the top of the channel, making it a magnet for price if bullish momentum continues.
💎Adding to the bullish momentum, the EMA-50 and EMA-200 have just formed a golden cross. This alignment often leads to sustained upward moves, especially when backed by a strong structure like the ascending channel we're in now.
Paradisers, strive for consistency, not quick profits. Treat the market as a businessman, not as a gambler.
MyCryptoParadise
iFeel the success🌴

Aave Has Room To Go Lower, I Will Spot The ReversalAave outperformed many pairs. Total growth reached 185%. It even produced one final advance and peaked only two days ago, 11-June. But now the bears are in and taking control of the chart. A strong rise is balanced out by a strong drop.
I think this is a nice project, a great project a nice pair. The strategy here is all the same. Advanced traders go SHORT. The rest, wait for support to be established before going LONG. Wait for the drop to end before buying again.
Remember, there will be plenty of time and plenty of signals showing the low is in. I will be here posting charts everyday.
I will catch the perfect bottom on this retrace, the same we did 7-April. It will be easy.
In fact, we will spot the reversal even before it takes place.
Thanks for the follow and for your continued support.
Namaste.

Is AAVE About to Explode Above or Collapse? Key Levels to WatchYello Paradisers! Is #AAVE quietly prepping for a major breakout… or is this just another setup to wipe out the impatient bulls before the real move begins?
💎#AAVEUSDT is moving in a textbook ascending channel, respecting both trendline resistance and support beautifully. The structure is clean, but deceptive. While many may assume this is an easy path higher, seasoned traders know better — especially with what’s happening near the critical resistance zone.
💎The red resistance zone ($270–$280) that was previously a major support during the last cycle is now acting as heavy resistance again. #AAVEUSD is currently battling this zone after several failed attempts to break through. But the structure still leans bullish as long as we stay within the ascending channel.
💎Both the 50 & 200 EMA are now acting as dynamic support. This is key — if the price remains above these EMAs and the lower channel boundary, momentum favors the bulls. A decisive breakout above $280 could trigger a parabolic rally toward the $375–$410 range, a level where serious resistance and profit-taking are expected.
💎However… if bulls get lazy and we see a strong breakdown below the ascending channel, especially below $237, the setup gets shaky fast. A complete invalidation of the bullish case occurs if AAVE loses $209 — from there, expect a breakdown structure to unfold with a likely test of much lower levels and a possible retest of the $150 zone.
Trade smart, Paradisers. This setup will reward only the disciplined.
MyCryptoParadise
iFeel the success🌴

AAVE I Weekly CLS I Model 2 I Dump it !!Hey, Market Warriors, here is another outlook on this instrument
If you’ve been following me, you already know every setup you see is built around a CLS Footprint, a Key Level, Liquidity and a specific execution model.
If you haven't followed me yet, start now.
My trading system is completely mechanical — designed to remove emotions, opinions, and impulsive decisions. No messy diagonal lines. No random drawings. Just clarity, structure, and execution.
🧩 What is CLS?
CLS is real smart money — the combined power of major investment banks and central banks moving over 6.5 trillion dollars a day. Understanding their operations is key to markets.
✅ Understanding the behavior of CLS allows you to position yourself with the giants during the market manipulations — leading to buying lows and selling highs - cleaner entries, clearer exits, and consistent profits.
📍 Model 1
is right after the manipulation of the CLS candle when CIOD occurs, and we are targeting 50% of the CLS range. H4 CLS ranges supported by HTF go straight to the opposing range.
"Adapt what is useful, reject what is useless, and add what is specifically your own."
— David Perk aka Dave FX Hunter ⚔️
👍 Hit like if you find this analysis helpful, and don't hesitate to comment with your opinions, charts or any questions.

Aave (AAVE): Aiming For $360-$400 Before Bigger Long SqueezeAave coin has had a good upward movement, and now we are inches away from a major resistance zone where we will be expecting to see some kind of big liquidity movement to lower zones.
RSI is overbought so we are already in dangerous zones, but we are pretty sure that before the big dump, we will reach the resistance zone so for now, this is our target area!
Swallow Academy

AAVE Breaks Major Resistance Is a Mega Rally Toward $460 on the Yello Paradisers, are you watching how #AAVEUSDT just exploded past its resistance zone? After weeks of slowly grinding upward inside a clean ascending channel, AAVEUSDT has just delivered a powerful breakout that could open the gates for a major continuation to the upside.
💎This breakout came with strength supported by strong green candles blasting through the previously established resistance zone near $280. The price decisively reclaimed this area, which has now flipped into a fresh support zone. As long as AAVE holds above this reclaimed region, the bullish momentum remains dominant and the probability of continuation grows significantly.
💎From a structural standpoint, #AAVE had been respecting a well defined ascending channel with rising support and resistance levels. Each pullback within the channel has been met with renewed demand, indicating strong market interest at every dip. The recent consolidation at resistance, followed by the aggressive breakout, confirms that the bulls are in control at least for now.
💎Looking ahead, the next visible target is the minor resistance at $357, followed by $380 and ultimately, the major supply zone between $460 and $470. These areas could act as points of reaction, but with momentum on AAVE’s side, the path upward remains technically cleanespecially if volume sustains.
💎On the downside, the invalidation of this bullish structure would come with a sharp drop below the key demand zone at $220. A breakdown below this level would shift the narrative and signal deeper corrective action, potentially opening the path toward the invalidation zone at $170.
Trade smart, Paradisers. This setup will reward only the disciplined.
MyCryptoParadise
iFeel the success🌴

Phemex Analysis #88: Pro Tips for Trading Aave (AAVE)Aave ( PHEMEX:AAVEUSDT.P ), a leading decentralized lending protocol and one of the standout Layer 1 tokens, has attracted substantial trader interest recently by demonstrating remarkable resilience. Impressively, AAVE bounced back by approximately 100% from its recent low of $113 on April 7. Adding to this optimism, AAVE broke through a significant resistance at $282 just yesterday, potentially signaling a bullish continuation.
However, traders must proceed with caution, as this recent upward breakout was accompanied by relatively lower trading volume and a weaker Relative Strength Index (RSI) compared to the previous bullish surge seen on May 27. These factors introduce uncertainty into AAVE’s near-term trajectory, prompting the need for careful evaluation of possible scenarios over the next few days.
Possible Scenarios
1. Continued Bullish Momentum
Despite the RSI divergence observed during this latest peak, AAVE may continue its upward momentum, driven by sustained investor enthusiasm and broader market conditions. Traders should closely monitor price action around immediate resistance levels for short-term profit opportunities.
Pro Tips:
Profit Taking: Consider locking in short-term gains as AAVE approaches significant resistance areas, particularly at around $333 and subsequently at $370.
Risk Management: Set protective stop-loss orders below the recent support at $250 to limit potential losses in case market sentiment shifts suddenly.
2. Limited Rise Followed by Sharp Rejection
Another plausible scenario involves AAVE rising moderately higher but facing strong selling pressure near critical resistance levels, such as $300 and $333. A rejection at these levels could trigger a sharp corrective move, particularly if accompanied by increased selling volume.
Pro Tips:
Cautious Entries: Be cautious about initiating long positions near these resistance zones. Instead, wait for clear signals or confirmations before entering.
Short Opportunities: Experienced traders could potentially capitalize on short-selling opportunities if strong rejection signals manifest at these resistance levels.
3. Retest of Lower Support Levels
Given the relatively weak volume accompanying the recent breakout, there is a potential third scenario in which AAVE retests lower support areas. A pullback towards previously broken resistance (now support) at around $282, or even further down to around $250 & $238, might occur as the market tests buyer strength.
Pro Tips:
Observe Volume: Pay close attention to trading volumes if prices decline. Low-volume pullbacks could present good accumulation opportunities at support levels.
Accumulation Strategy: Consider cautiously accumulating positions near $250 or $238 only after clear signs of price stabilization and potential reversal appear.
Conclusion
While Aave (AAVE) showcases impressive strength and investor confidence, the current RSI divergence and volume trends suggest caution. By closely monitoring the outlined scenarios and implementing disciplined risk management strategies, traders can better navigate the uncertainty and volatility surrounding AAVE’s current market conditions.
🔥 Tips:
Break free from "buy low, sell high"! Our new Pilot Contract empowers you to profit from ANY market direction on DEX coins with up to 3x leverage. Go long, go short, go further!
Check out Phemex - Pilot Contract today!
Disclaimer: This is NOT financial or investment advice. Please conduct your own research (DYOR). Phemex is not responsible, directly or indirectly, for any damage or loss incurred or claimed to be caused by or in association with the use of or reliance on any content, goods, or services mentioned in this article.

AAVEUSDT Is In a very important pointAs you can the price has gone up the midlane of the longterm channel, and the short term channel is signalling a move upwards toward the long term resistance if the price can secure this level ,in my opinion Aave can see the rootftop of its long term channel.

FREE SIGNALHello friends
Given the price range that has formed and the power of buyers in case of failure, we can open a position with capital and risk management to move towards the specified goals.
*Trade safely with us*

Aave Bearish, Be Aware (Do Not Buy Now, Sell or Wait)Aave grew almost 150% in 50 days. Now the market is entering a correction phase. Not a true correction only a retrace but it is almost the same.
The rising wedge is a bearish pattern. It is coupled with very low volume.
The action moved out of the rising wedge; bearish confirmed.
There is a local lower high and this points to lower before the market turns bullish again.
We keep it simple. We either wait or SHORT, but we do not buy here.
» If you are a bull, you can wait for prices to move lower to buy again or you can sell.
» If you are a bear, you can SHORT; this is an easy trade.
The market will confirm my analysis in a matter of days.
This is very easy of course.
Thank you for reading.
Stay (protect your money) safe.
Namaste.

AAVE PERPETUAL TRADE, Sold From $271.50AAVE PERPETUAL TRADE
AAVE SELL SETUP
Currently $271.50
Sold From $271.50
(Trading plan If AAVE go up to $280
will add more shorts)
Expecting target $266 OR DOWN
In the event of an early exit,
this analysis will be updated.
Its not a Financial advice

AAVEUSDT Analysis: Retracement Opportunity AAVEUSDT has been trending upward without significant retracement for a long time. With a 63% volume/market cap ratio , any meaningful retracement could offer an excellent opportunity. At this point, I see no reason to ignore such a setup if it aligns with key demand zones. This is a Spot Buy.
Key Points:
Lack of Retracement: AAVEUSDT has been on a strong run without a pullback.
Volume/Market Cap Ratio: 63% indicates healthy liquidity and interest.
Retracement Potential: A good pullback could provide a favorable entry.
Confirmation Indicators: I will use CDV, liquidity heatmaps, volume profiles, volume footprints, and upward market structure breaks on lower time frames for validation.
Learn With Me: If you want to master how to use CDV, liquidity heatmaps, volume profiles, and volume footprints to pinpoint accurate demand zones, just DM me. I’d be happy to guide you!
Reminder: Be aware of the market's current state and approach it with caution. Successful trading relies on meaningful levels and robust confirmations.
If you think this analysis helps you, please don't forget to boost and comment on this. These motivate me to share more insights with you! Wishing everyone success in their trades.
If you think this analysis helps you, please don't forget to boost and comment on this. These motivate me to share more insights with you!
I keep my charts clean and simple because I believe clarity leads to better decisions.
My approach is built on years of experience and a solid track record. I don’t claim to know it all, but I’m confident in my ability to spot high-probability setups.
If you would like to learn how to use the heatmap, cumulative volume delta and volume footprint techniques that I use below to determine very accurate demand regions, you can send me a private message. I help anyone who wants it completely free of charge.
My Previous Analysis
🐶 DOGEUSDT.P: Next Move
🎨 RENDERUSDT.P: Opportunity of the Month
💎 ETHUSDT.P: Where to Retrace
🟢 BNBUSDT.P: Potential Surge
📊 BTC Dominance: Reaction Zone
🌊 WAVESUSDT.P: Demand Zone Potential
🟣 UNIUSDT.P: Long-Term Trade
🔵 XRPUSDT.P: Entry Zones
🔗 LINKUSDT.P: Follow The River
📈 BTCUSDT.P: Two Key Demand Zones
🟩 POLUSDT: Bullish Momentum
🌟 PENDLEUSDT.P: Where Opportunity Meets Precision
🔥 BTCUSDT.P: Liquidation of Highly Leveraged Longs
🌊 SOLUSDT.P: SOL's Dip - Your Opportunity
🐸 1000PEPEUSDT.P: Prime Bounce Zone Unlocked
🚀 ETHUSDT.P: Set to Explode - Don't Miss This Game Changer
🤖 IQUSDT: Smart Plan
⚡️ PONDUSDT: A Trade Not Taken Is Better Than a Losing One
💼 STMXUSDT: 2 Buying Areas
🐢 TURBOUSDT: Buy Zones and Buyer Presence
🌍 ICPUSDT.P: Massive Upside Potential | Check the Trade Update For Seeing Results
🟠 IDEXUSDT: Spot Buy Area | %26 Profit if You Trade with MSB
📌 USUALUSDT: Buyers Are Active + %70 Profit in Total
🌟 FORTHUSDT: Sniper Entry +%26 Reaction
🐳 QKCUSDT: Sniper Entry +%57 Reaction
I stopped adding to the list because it's kinda tiring to add 5-10 charts in every move but you can check my profile and see that it goes on..

AAVE SHORT ALL trading ideas have entry point + stop loss + take profit + Risk level.
hello Traders, here is the full analysis for this pair, let me know in the comment section below if you have any questions, the entry will be taken only if all rules of the strategies will be satisfied. I suggest you keep this pair on your watchlist and see if the rules of your strategy are satisfied. Please also refer to the Important Risk Notice linked below.
Disclaimer

AAVEUSDT has big move to performAAVEUSDT has big move to perform after doing retracement at Fib 0.5 level, which is exactly falling at FVG.

AAVEUSDT → A false breakdown provokes a change of characterBINANCE:AAVEUSDT.P maintains a bullish market structure. The coin is consolidating, with bulls trying to hold their ground above the key support line.
Against the backdrop of a correction, the price is testing liquidity, with a false breakdown of support provoking a change in character to bullish within the local timeframe. Bulls are trying to maintain the bullish structure.
The price is breaking through the resistance of local consolidation, forming a change in character, but before growth, the market may close the gestalt in the form of an order block or liquidity located in the 249.5 zone.
Support levels: 249.11, 240.0
Resistance levels: 274.27, 280.47
Technically, the coin looks quite good and promising overall. If the bulls hold their ground in the 249-250 zone, then in the short to medium term, we could see good movement with the possibility of new highs...
Best regards, R. Linda!

Buy Trade Strategy for AAVE: Leading the Future of DeFi Title:
Buy Trade Strategy for AAVE: Leading the Future of DeFi Lending
Description:
This trading idea is based on AAVE, one of the most established and innovative protocols in the decentralized finance (DeFi) sector. As a decentralized liquidity protocol, AAVE allows users to lend, borrow, and earn interest on crypto assets without intermediaries. Its advanced features—such as flash loans, rate switching, and collateral swapping—have made it a favorite among both retail and institutional users. With consistent development, strong community support, and a transparent governance model, AAVE continues to lead the DeFi lending space, playing a fundamental role in shaping the future of on-chain finance.
Despite these strengths, the cryptocurrency market remains unpredictable. Regulatory changes, macroeconomic trends, and overall sentiment can significantly impact AAVE’s price and adoption. As with all crypto assets, trading AAVE involves inherent risks that must be managed carefully.
Disclaimer:
This trading idea is for educational purposes only and does not represent financial advice. Investing in cryptocurrencies like AAVE involves substantial risk, including the potential for total capital loss. Always conduct your own research, consider your financial situation, and consult with a financial advisor before making any investment decisions. Past performance is not a guarantee of future results.
