AAVE momentum succeeded in breakout?AAVE formed ascending scallop after an invalid Head and Shoulders pattern, but it pulled back strongly, can we see a higher movement?
AAVEUST trade ideas

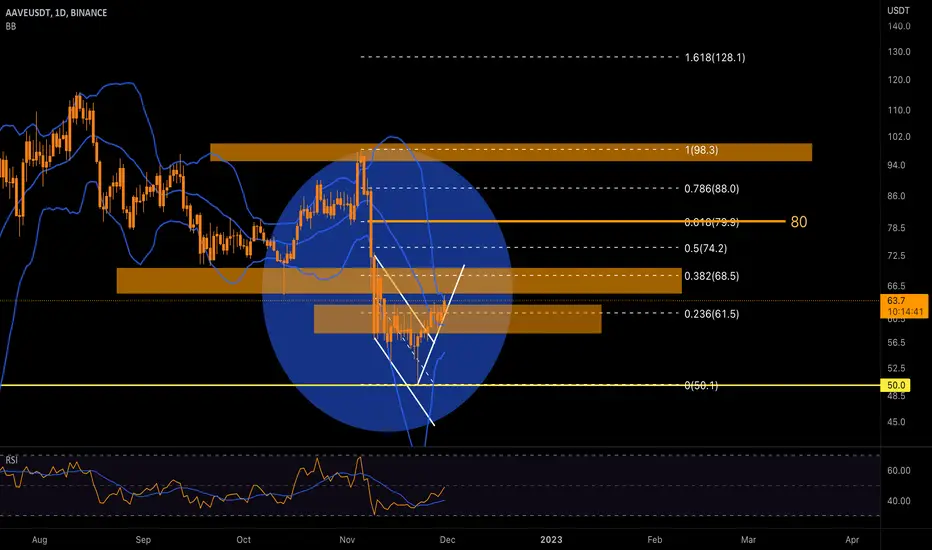
AAVE - Technical review and analysisAAVE has registered a complete range trend during the last week. Although the price of AAVE broke the trend line support, the buyers provided good support again due to the existence of static support below the $60 range. The positive reaction to the price of 58 to 60 dollars has caused a 9% growth and hit the resistance range of 63.5 to 66.6 dollars. If more support from buyers this week can bring the price back above the blue resistance range, we expect the AAVE currency trend to remain bullish for the short term. We can consider short-term targets in the range of $68-$70 and $80 range. . Note that the overall trend of the currency is still bearish on the higher time frames, and due to the last strong bearish wave that took the price to the $50 level, a break of the $70 minimum resistance is needed to change the trend.

AAVE | Be Careful Ahead of FOMCAAVE | Be Careful Ahead of FOMC
Price is showing a very interesting bullish pattern.
However today we have to be very careful as the move will
be related to the FOMC press conference that could push the price
up and down in different ways.
So overall the speculation should be very high.
From the technical perspective, price is showing a bullish
the pattern that can rise the price further.
However, all is very risky today and you should know this in advance.
Thank you and Good Luck!

AAVE LONG IDEA 🚀🚀 Hi guys , this Is a spot swing trade
Entry1 : 59.3
Entry2: 58.4
SL: 58
Tp : 63.1- 65
Please like my idea and follow me for more strong signals

AAVEUSDT | FALLING WEDGE BREAKOUTAAVE has been in a downtrend and continuously making lower lows and lower highs.
The lower trend was supported by falling wedge .
The price has hold the support zone and formed bullish candles on support.
The bulls ha now broken the price above the wedge .
We are expecting price can rise from here as it has hold an important support zone .
Trades your levels accordingly.

AAVEUSDT 1HAfter managing to reach the support of 60.7 the AAVE goes behind the EMA 200 which is at 61.70. RSI showing exhaustion in buying forces so there may be a correction to its supports of 59.7 or even 59.1. Always remembering that AAVE is a DEFI token and may be susceptible to evictions.
Suports: 59.7 / 59.1 / 58.5
Resistances: 60.7 / 61.7 / 62.4

Fast long on AAVEFast long on AAVE. Interesting moment, we are on the bottom level of maybe starting up trend. If I am right then we should move to up. If not, then downtrend will test low level.

Looks like AAve is about to breakout-- Looks like it's stuck between those two S/R zones
Sitting right inthe golden pocket area right now.
I'd say it's gonnapull back to 62 before moving up .

AAVE ⚡⚡ #AAVE/USDT ⚡⚡
Exchanges: Binance Futures
Signal Type: Regular (Short)
Leverage: Cross (20X)
Entry Zone:
1) 62.18
2) 62.25
3) 62.40
Take-Profit Targets:
1) 61.12
2) 60.12
3) 58.64
4) 58.06
Stop Targets:
1) 62.70
Trailing Configuration:
Entry: Percentage (0.5%)
Take-Profit: Percentage (0.5%)
Stop: Moving Target -
Trigger: Target (1)

Trading opportunity for AAVEUSDT Based on technical factors there is a Sell position in :
📊 AAVEUSDT
🔴 Sell Now 62.3
🧯Stop loss 64.7
🏹 Target 1 58.7
🏹 Target 2 56.0
🏹 Target 3 52.5
💸RISK : 1%
We hope it is profitable for you ❤️
Please support our activity with your likes👍 and comments📝

AAVE going downquick rundown on AAVE but it looks like its going back to its origins. this downtrend will continue until this coin drops sub $30, only then would i consider it a proper value area buy. Watch out for the rejection shortly and more downside to come over 50% left on the downside. careful out there traders.

AAVE/USDT
Forming a powerful pattern. I predict a growth.
Will this happen????
Write your opinion
Community Verified icon

AAVE/USDT still good to shortHey guys
We are back to AAVE/USDT pair. We still see a good possibility for this coin to go for lower levels once it breaks the EMA200 zone. breaking this zone would mean going for a correctional movement towards $57 zone. Any thought here guys?
If you like ideas provided by our team you can show us your support by liking and commenting.
Yours Sincerely,
Swallow Team 🔱
Disclamer:
We are not financial advisors. The content that we share on this website are for educational purposes and are our own personal opinions.

AAVE IDEAHELLO GUYS THIS MY IDEA 💡ABOUT AVEEUSDT is nice to see strong volume area....
Where is lot of contract accumulated..
I thing that the sellers from this area will be defend this SHORT position..
and when the price come back to this area, strong sellers will be push down the market again..
DOWNTREND + SUPPORT from the past + Strong volume area is my mainly reason for this short trade..
IF you like my work please like and follow thanks

AAVEUSDT TAKING REVERSE FROM ITS RESISTANCEConfluence:
1) uptrend line break
2) Trend line tested and got rejection.
3) Double top pattern.

AAVEUSDT | BULLISH CHANNELAAVE has been trading in a bullish parallel channel . The price is making higher highs and higher lows.
Currently it has formed good bullish candles on lower boundary of channel.
The price has also 0.23 fib level support too.
The bulls need to hold the channel and has a hurdle of 0.382 fib level.
While bears will be active near the resistance zone .
Trade your levels accordingly.

AAVEUSDT wants the breakout?The price is testing the descending channel after the breakout.
How to approach it?
IF the price is going to have a breakout and flip the resistance as new support, According to Plancton's strategy , we can set a nice order
–––––
Keep in mind.
🟣 Purple structure -> Monthly structure.
🔴 Red structure -> Weekly structure.
🔵 Blue structure -> Daily structure.
🟡 Yellow structure -> 4h structure.
⚫️ black structure -> <= 1h structure.
–––––
Follow the Shrimp 🦐

AAVE short opportunityAave has created a bearish divergence...just break the Market structure for short confirmation and take those lows..every coin has created a Bearish divergence.

AAVEIdea: The price will start to form a bullish cup and handle pattern if it can break through this resistance level. The price will continue the downtrend if it bounces down from the resistance level

Strong opportunities for alts, AAVE might move up!AAVE formed Adam and Eve Double Bottom pattern after a consistent uptrend, there is a huge action for altcoins and tokens now, as BTC and ETH moving sideways. AAVE will make it.
We saw good upside moves in the altcoins areas which have good projects, AAVE is apparent for having good one.

AAVE/USDT looks about to go downHey, traders
AAVE/USDT looks interesting and seems that it might be dropping as well soon. Well despite that ascending triangle pattern which is usually a sign of bullish movement we also see that this pattern has shown some weak spots so we are going to take a short position soon here.
If you like ideas provided by our team you can show us your support by liking and commenting.
Yours Sincerely,
Swallow Team 🔱
Disclamer:
We are not financial advisors. The content that we share on this website are for educational purposes and are our own personal opinions.

The specified targets can be available to buyers!AAVE has increased in price over the past week. The ceiling of the descending channel intended for it was broken with buyer support, and the price continued to rise with a very shallow pullback to the $57 range. The resistance considered in the $63.5-66.6 has been associated with the reaction, but this range is expected to be broken and become support along with the next resistance of $69-70. In this case, the next targets of the buyers will be in the range of $80.
The range considered at $58-$63 could be a very good demand area for upside moves in the medium term if it turns into support. If we see the price rise to $80 resistance for this week, there can be enough strength and demand to continue the upward movement in the return and pullback to this support. For the short term, as long as the uptrend line drawn in the 4-hour timeframe is maintained, the specified targets can be available to buyers.