AAVE: THE PERFECT STORM SETUP FOR 340% RETURNS🔄🚀 for more details FOLLOW ME AND READ BELOW 🚀
📈 The Bullish Convergence Pattern
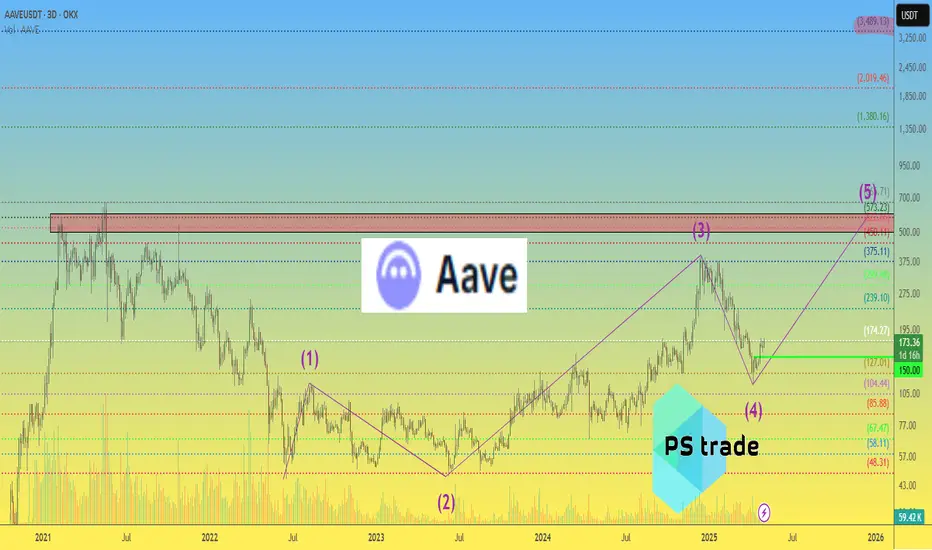
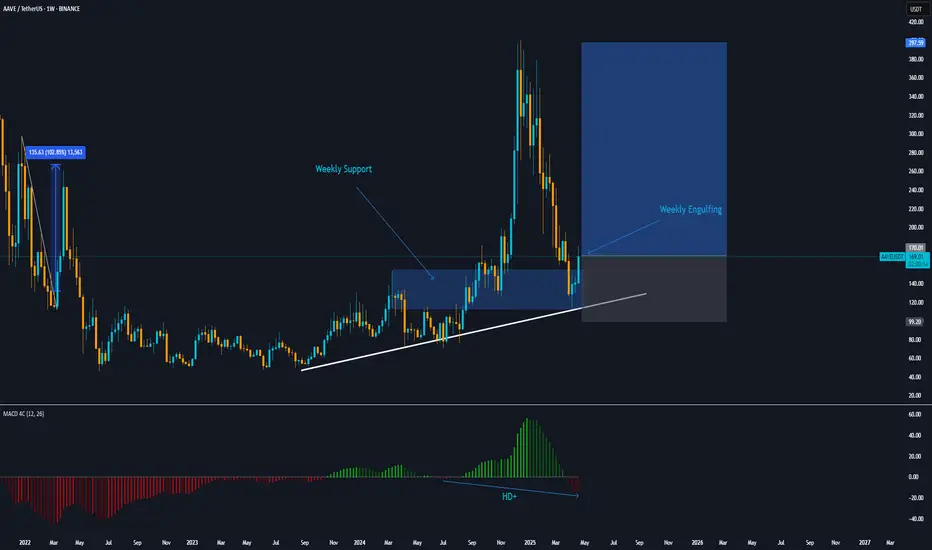
This AAVE/USDT weekly chart reveals a textbook pattern that's impossible to ignore. After forming a massive rounded bottom structure from 2022-2024, AAVE is now completing its correction phase with a clear descending triangle - typically a continuation pattern in an overall uptrend.
🎯 668 USD Target: Why It's Realistic
Notice the horizontal resistance at $668 (marked as "High") - this level has historical significance as it was tested twice in a perfect 13-bar, 91-day cycle. The current price of $151.63 represents a stunning opportunity, as reaching this target would deliver a 340% return.
⌛ Time-Based Symmetry
The chart shows two identical "13 bars, 91d" measurements. This remarkable symmetry suggests we're approaching the end of the correction, with a powerful move expected to begin in the coming weeks that could mirror the momentum seen in early 2021.
📊 Technical Confluence
Multiple factors align for this massive move:
- Price is testing the long-term support trendline (white curve)
- The current triangle formation is reaching its apex
- We're at a historical support zone ($144-$151)
- Volume has been decreasing during this correction (classic pre-breakout behavior)
💡 Why This Time Is Different
Unlike previous cycles, AAVE has established itself as a cornerstone of DeFi with sustainable revenue models, institutional adoption, and a proven track record through multiple market cycles. The fundamental backdrop supporting this technical pattern is stronger than ever.
⏰ Entry & Exit Strategy
- Entry Zone : $144-$152 (current level offers excellent risk-reward)
- Initial Targets : $250 (previous resistance), $400 (2024 high)
- Ultimate Target : $668 (multi-year resistance)
- Stop Loss : Below $125 (violation of the long-term trendline)
🔮 The Bigger Picture
This isn't just another trade - it's positioning for the next major DeFi wave. The identical 13-bar cycles suggest we're on the cusp of a significant market phase shift that could propel AAVE to new heights.
AAVEUST trade ideas

AAVE Retracement Long Entry ZoneStructure broken. Looking for a Fibo retracement to enter Long. Target Levels are supply POI on the chart.

AAVE Supply zoneCrucial AAVE decision zone for Fibo retracement.
Looking for price action on the key level for reject or breakthrough.

Aave long to $185Just now opened a long position on aave. Anticipating a breakout pump tonight to $185.
There is a decent chance that the market falls back down to my stop area, hopefully not but I did see thats probable but at the same time game confirmation to long based on my DTT strategy just now perfect.
Might early close around $181 if pumps. Depends on the momentum

AAVEAAVE looking very juicy in several time frames, 1D and 4H is the most detailing tf for analysis, so if you watch closely, you will notify that AAVE it is sitting on a very well positioned support where on 4H tf, the buying volume it is already +16% and this means that when volume goes over 20-25% on buy direction the price it will start to pump and the 1st target for me it will me 250-80$.
Keep an eye on it.
DYOR
NFA

AAve short to $168Just now opened a short position on aave. Expecting a dump back down to $168 soon. Market is currently high, this was a nice correction to the upside to get decent RR to short.
Roughly 2.56RR

AAVE price analysisGlobally, the price of OKX:AAVEUSDT looks very good compared to most altcoins.
Therefore, as of now, looking at the chart, we can assume that any purchase of CRYPTOCAP:AAVE above $150 can turn into a good medium or long-term investment.
Target for growth in 2025 to $500-600
Although, there are dreamers who are waiting for CRYPTOCAP:AAVE at $3500, then the project's cap will exceed $50 billion - do you believe in such prospects?)
AAVESimiliarly to LINK EURONEXT:AAVE on the daily has confirmed a reversal of trend to the upside. Targetting HTF Liquidity points, should be either daily or 4H. My entry lies on the 4h OB which has not been tapped. I will monitor PA once prices reaches my POI and announce a entry for you guys : )
Stay tuned for more trades and of course I appreciate a follow.

AAVEHere I see two possible scenarios. AAVE has been ranging for quite a while and I would be looking for shorting at 184 or long at 150. At 184 there is a clear OB which I would closely monitor if it holds and then short after confirmation. And at 150 I would wait for price to fill the breaker block and after confirmation enter the trade. I will be posting all of this free of charge as well as entries to my trades. Stay tuned.

AAVEUSDT is ready to begin an UptrendWith the closing of a strong bullish candle and its engulfing, we can expect the price to grow to its previous high price range.
AAVE, aims for X10 this bull season. Massive loans demand ahead!Aave is an Open Source Protocol to create Non-Custodial Liquidity Markets to earn interest on supplying and borrowing assets with a variable interest rate.
The apparent market shift in trend this past few days in the whole market after the extended correction is a good season to seed on this very valuable COIN.
Demands in LOANS will skyrocket fueling funding frenzy on position takers on their crypto holdings as we enter BULL SEASON. And the focus will be on AAVE the largest liquidity pool provider.
Ideal seeding zone is at the current bargain range of (170) which started on the 130 bottom price area.
Get positioned now on this one while its still at early stage. An easy x10 would the long term target on this. Fundamental and Technical growth on this is inevitable.
Spotted at 170.
Mid target 500
Long term 1000.
TAYOR. Trade safely.

Aave long to $180Market been pushing more aggressive. Things have change. I got caught up in a few shorts but lets make it right.
Anticipating further push towards $180
Trading with the trend.
Time sensitive
Price currently at key level.

AAVE/USDTThe coin is showing a bullish structure both locally and on the higher timeframes. Once the November low is swept, we can look for longs with a target at 194

AAVEUSDT SETUPHere is a trading idea that i think will take AAVE for a bull run, you can make your own further analysis and decision as this is not a financial advise, those are my level that im looking to buy since those leves holds supportive confluences

$AAVE solid bounceCRYPTOCAP:AAVE had a solid bounce off the lows and is now pushing into resistance. This weekly close will be key to confirm a reclaim of the 99 SMMA or a rejection.

aave short to $158.3 areaJust hopped into a aave short. I think the market is quite high right now and is in need of a correction and it seems which I think will likely happen to night.
MUltiple times price tried to break higher but more supply kept coming in. HHs kept failing.
Also its probably more ideal to short in the nights as in the day everyone is quite bullish or uncertain and lots of news be coming out to interfere with price action

AAVE - Alt Rising Star?Aave is a unique option in the alt coin universe. It's technology facilitates access to accelerated gains in a rising price environment, and with the recent release of a stable coin, Aave has positioned itself as a more serious player in the cryptoFi space.
Will Aave trend to the upside from here? Time will tell...
For now, our team has identified an opportunity within AAVEUSDT, where momentum may very well be turning to a 'bullish' rating should price be able to hold current levels - Caution as always is warranted.
We do however see elevated risk of 'bearish' momentum coming into play below the $129.00 mark.
We're inspired to bring you the latest developments across worldwide markets, helping you look in the right place, at the right time.
Thank you for reading! Stay tuned for further updates, and we look forward to being of service along your trading & investing journey...
Disclaimer: Please note all information contained within this post and all other Bullfinder-official Tradingview content is strictly for informational purposes only and is not intended to be investment advice. Please DYOR & Consult your licensed financial advisors before acting on any information contained within this post, or any other Bullfinder-official TV content.


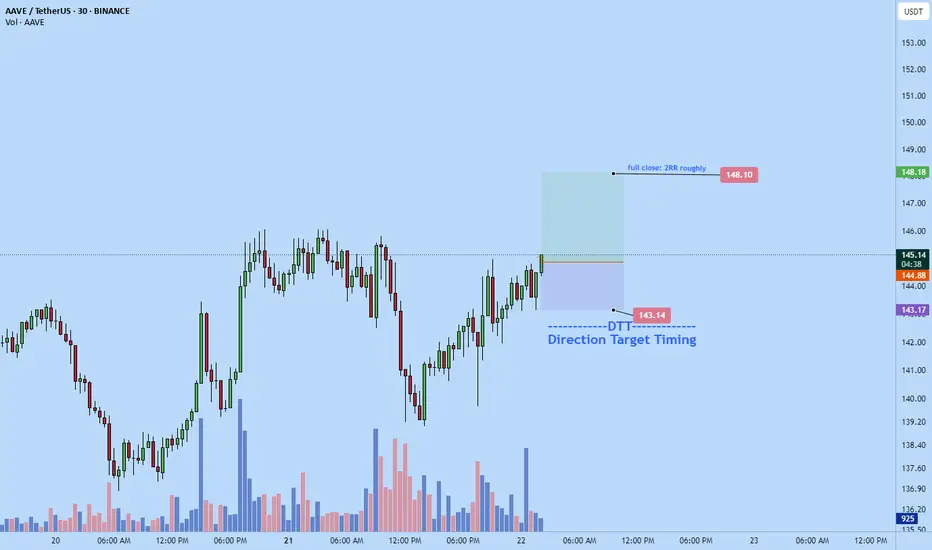
aave scalp long to $148.1Just now hopped into aave long. Anticipating a pump right now leading into new york session.
Time sensitive signal>
Stop: $143.14 area
Target: $148.1
DTT applied
Roughly 2RR
AAVEUSDT to head towards weekly resistance around 200The price has bounced from weekly support WS1 and currently trading above it. The next resistance is weekly resistance WR1 sitting around 165-195 zone. The price is headed towards this zone and in coming days or weeks it is going to hit this zone. However, there should be some pullback there. The next resistance zone beyond WR1 is weekly resistance WR2 sitting around 235-255. It is possible that after having some pullback at WR1, the price will eventually break WR1 and aim for WR2. However, WR2 is going to be strong supply zone and will push the price down again. I see still a possibility for the price to come down from WR2 to test weekly support zone WS2. But thats quite far yet, therefore, lets stick to the movement till WR2 and then we reevaluate the price action based on the reaction when the price hits WR2.

AAve long to $150Just now opened a long position on aave. Very high probability. Went in heavy
Anticipating a fast pump back up to $150 price target today.
Manage risk to what you can afford to lose if seeing this.
Might get a bit of drawdown but I anticipate it be quick if any

Potential Inverse Bullish Head & Shoulders! 📈 CRYPTOCAP:AAVE Update – Potential Inverse Bullish Head & Shoulders! 👀
CRYPTOCAP:AAVE appears to be forming an Inverse Bullish Head and Shoulders pattern, which could signal a bullish reversal! 🐂
⚠️ Watching for a breakout above the neckline (resistance) for confirmation.
🎯 Target: Green line level 👆

TradeCityPro | AAVE: Key Triggers in DeFi Lending Giant's Trend👋 Welcome to TradeCity Pro!
In this analysis, I want to review the AAVE coin for you. The AAVE project is one of the largest DeFi projects, operating in the lending sector, and holds the highest TVL among all projects in this category.
✔️ Currently, the coin of this project has managed to achieve a $2 billion market cap and with this market cap, it ranks 39th on CoinMarketCap.
📅 Daily Time Frame
In the daily time frame, as you can see, after a long-term uptrend that reached up to 383.59, the price entered a corrective phase and, following the break of the 278.56 zone along with a descending trendline, dropped to the 124.31 level.
💫 The 124.31 support is a very strong one, and the price has reacted well to it. The buying candle volume has increased after the price reached this zone, which indicates the strength of this support.
💥 If this support breaks, the price could begin its next bearish leg. The next support that AAVE has in this time frame is at 77.45, which could prevent further decline in case of a sharp bearish move.
📈 For a long position or spot buy, we first need to wait for the descending trendline to break, and for the price to form a higher low and high above this trendline to confirm a trend reversal.
🔼 Currently, the main bullish trigger is at the 194.97 level, and if this level breaks, the price could move back toward the 278.56 and 383.59 zones.
📉 For a futures position, the 148.17 level is a suitable trigger and can offer a risky long position. However, the spot buy and main position trigger is the 194.97 level. A break of the 50 level on RSI would bring bullish momentum into the market and can serve as a good confirmation for a long position.
🧩 For a short position, breaking the 124.31 level is a good trigger, and if this level breaks and RSI enters the oversold zone, the price could make a sharp bearish move.
📊 But more important than all is the market volume, which currently doesn’t have a clear trend. We’ll have to see whether, upon breaking 124.31 or 148.17, sufficient volume enters the market or not.
📝 Final Thoughts
This analysis reflects our opinions and is not financial advice.
Share your thoughts in the comments, and don’t forget to share this analysis with your friends! ❤️
