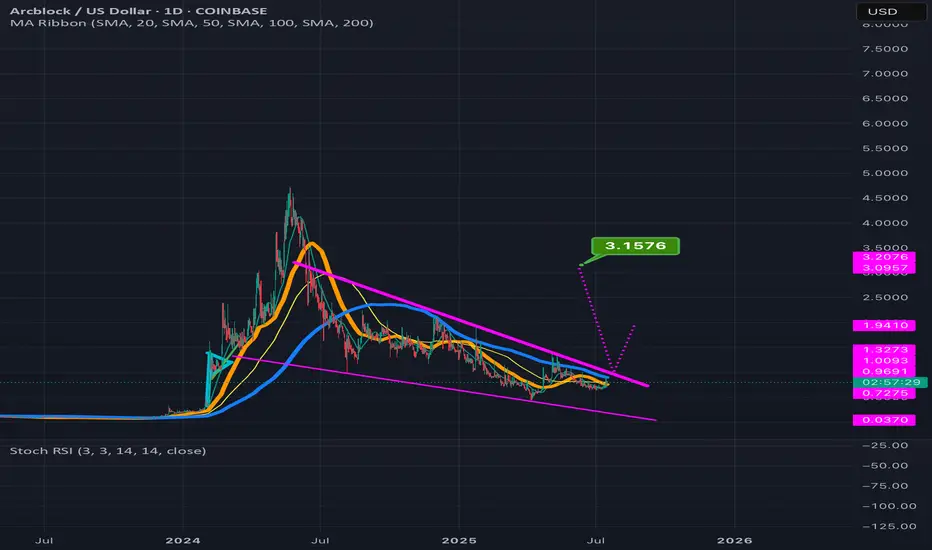
ABT can potentially 4x in value reading up from the wedge its inThe smaller pink dotted measured move line is for the inv h&s pattern its formed inside the wedge with the top trendline of the wedge doubling as the invh&s pattern’s neckline. Hitting that smaller target is more or less a 2x from current price action. If we hit the full falling wedge target that’s a 4x from where it is currently. *not financial advice*
ABTUSD trade ideas
ABT is about to explode - watch out for the breakout Currently consolidating, last year same time went up +100%. Watch out for the upcoming breakout which I expect it to be in the net two to three days.
Happy hunting
ABT round 2 about to start Yes look at round one at the bottom. Are we to repeat this pattern? Most likely. ABT couldn’t even back test the old high. Far too bullish!
The RSI bottomed out on the weekly time frame and created huge amounts of bullish divergence.
See you at $19 plus in the future.

ABT working on an inverse head and shoulders breakout Arcblock seems to have broken firmly above the inverse head and shoulder pattern on the daily chart. In order to keep heading to the target it will need to overcome the current resistance of the 200 MA (in blue). Once it is able to do that and flip that resistance into solid support, it should reach the full target of $2.57 with relative ease. *not financial advice*

JASMY & ARCBLOCK_chartsLook at the similarity between Arcblock chart and Jasmy Chart. I never noticed this before now.

Is the bullish reversal signal finally here for $ABT ? The 34 EMA (yellow line) has proven to be a very effective indicator for when we see bullish opportunties with ABT. As you can you see we have been respecting a Bearish channel for quite sometime, with a recent break out from the channel and attemps to change course. Time will tell.....
Truth be told, I got shook out of about half position due to stop loss/s set (as to ensure profit taking on the way down). I did not see quite the recovery happening this quickly, so if we continue to climb, I will be salty, while also happy =)

ABT token to surpass 22 dollars?After the parabolic run early 2024 the price came to a halt and started it's retrace and started bleeding slowly back to a dollar. Does this token have more gifts for it's holders?
A small community was able to understand the tech and get in early in the cents region and reaped the rewards. Most may have missed the first wave, don't miss the second one...

ABT - Long for long swing tradeABT is still tagging the oversold area on MACD, and heading still toward fear on the Fear and Greed index. It's dropped pretty sharply so once bullish momentum returns I expect a pretty hard snap upwards. I'm DCA'ing here at 1.25.

ABT to 3.67I like ABT's tokenomics with about 98 million in circulation. It was a great play earlier in the crypto bull cycle and I think early profit takers will jump back in as we move towards $5.00 later this year (Nov). My short term targets for price (on the daily) are around 2.85 to 3.67. It has consolidated well, we've seen recent buy signals kick based on technicals, and it looks to me we are moving away from peak fear towards the greed zone. I bought and am buying at 1.62 to 2.07. This is a really long swing trade that I'll be nibbling at on pullbacks till it's above five dollars. Personally, I like to sell into peak greed and top off my positions on hard pullbacks during peak fear cycles. I'll be watching the daily for invalidation of my targets but I think we've got, at least, a week or two of upward momentum coming.

ABT - Long-term bullish, short-term neutralABT has been building bullish momentum at the bottom of the range. We are coming out of peak fear on the daily charts and hit a pocket of buyer momentum. Revising my previous idea for ABT so new TP levels 3.32 and 4.98. This is a long-term trade, my invalidation level is 1.51 or lower on the daily. I consider this a high-risk, high-reward play that will take weeks or months to play out. We aren't at peak fear yet on the weekly so could see some temporary selling pressure to 1.66 in the short term if we don't have sustained buying through the Sunday close.

ABT needs some BUYERS We are continuing in this downward price channel, staying below my typical indicators that would tell me to go long. We are below both the 89 and 34 EMA, so until we can touch those and move beyond with some volume, it doesn't look good for upside. However, sideways action isn't bad either, which could indicate accumulation. Time will tell. I am still long.

ABT is not looking too strong these days. It is a bummer to write this update, but ABT looks to be failing at staying within the bullish channel that it started a few months ago. Unfortunately the entire cryto market is in sell off mode now that interest rates will stay higher for longer than we expected at the start of this year.
$2.79 needs to hold as support, but I matter it will only be some time before we lose that threshold as well. As always I hope I am wrong and see ABT back into the $4's and beyond one day.

Arcblock triggering a h&s breakdown on the 4hr chart.If it reached the full breakdown target it will head to 3.12. However being a smaller time frame and a bearish pattern in the middle of a bull market cycle, it does decrease the odds of it hitting the full target. I think 3.12 would make for a solid correction for ABT after making such excellent gains the past few months. I do still think after it finishes this correction it is still likely to hit the full measured move target of the log chart bull flag it broke up from awhile back and that this bear pattern breakdown is simply a correction along the way. *not financial advice*

Short ABT (Arcblock) SELLHey! I think Arcblock will drop here.
It is very overextended in the larger time frame and looks ready for a correction.
Lots of other coins are also looking bearish.
- Dalin Anderson

$ABT 30% Hot Setup We got all Your Level Signals right HereABT 30% Hot 🔥🛗🔥Setup >>
NYSE:ABT 30% Hot Setup We got all Your Level Signals right Here
Check Comments

$ABT 20% Hot Setup with Ai Targets & SignalsABT 20% Hot 🔥🛗🔥Setup >>
NYSE:ABT 20% Hot Setup with Ai Targets & Signals
Currently at CHannel Demnd ZOne

*Update* What was once resistance, now becomes supportThis is a quick update to my previous post mentioning ABT showing relative strength within this bullish channel. The channel shown was originally drawn a few weeks before we made this move. It is really fun to see how the once resistance level, has now become it's support while we move to the upside.
Current resistance sits at 4.74 - past history does not gurantee anything in the future, however if we keep the same bullish pennant set ups, we COULD see ABT breaking into the $5-$5.80 range sooner than later.
As always, just my humble opinion, and trust me, I am often incorrect, so please do not make any of your decisions based off my thoughts. However, I am always welcome to feedback and oppossing ideas.
Cheers.

Arcblock (ABT)** requested analysis **
On the above 2-day chart price action has corrected 50% since the sell signal in late January. Now is a good long moment. Why?
1) You know why.
2) Past resistance become support.
3) Support prints on the Fibonacci 0.786
4) Multiple oscillators print positive divergence with price action. On both USD and BTC pair.
Is it possible price action falls further? Sure.
Is it probable? No.
Ww
Type: Trade
Risk: 2%, tiny market cap
Timeframe: Now
Return: No idea

What was once resistance, now becomes support ABT is in a powerful channel that has been non-stop breaking new highs. this channel was drawn out a few weeks before this most recent upside move. If we can continue to maintain on the upperside on this channel, it would be very bullish IMO.

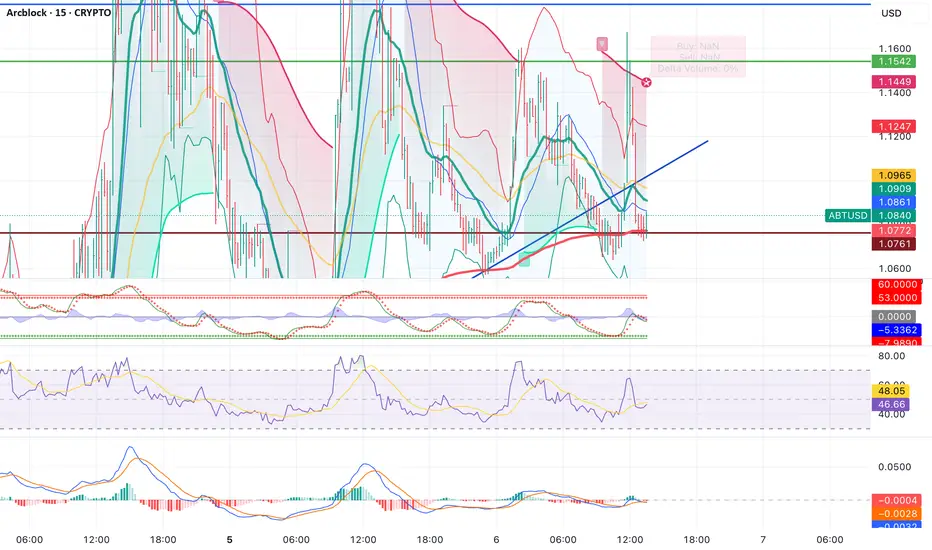
Is ABTUSD already triggering c&h w/a handle only on small TFs?ABTUSD just recently hit the full target of its linear chart’s recent bull flag breakout and in the process filled out this beautifully sculpted cup that I thought would take several daily candles to complete a handle of before continuing to move upward….to my surprise price decided to only let the handle develop on the 30minute-2hr chart before breaking above the neckline. So it is currently now most valid on the 35-45 minute chart…making it far more likely the pattern can be nullified on such a small tie frame, however as of right now it is well on the way to the full c&h breakout target…a few dives back below the neckline especially on such a small time frame are quite possible too before it musters up the strength to hit the full target. If it does hit that target it is well on the way of finally hitting my much higher target of the Log charts bullflag breakout which I will link that idea below. Keep in mind because it is the log chart its measured move target from breaking up from the flag is considerably higher than the one that was on the linear chart. *not financial advice*

ABTUSD Breaking upward from a bull pennantIt looks like it is validating the break upward, full emasured move target can lead to 180% gains from current price range. Of course always possible it corrects all the way back don to the top trendline of the pennant before reaching the full target. If so that’s simply an opportunity to enter at a zone with even bigger gains potential. It could just as easily keep pumping until it reaches the full target as well. If longer consolidation it could take 1 as many as 1-3 weeks to reach the full target also…and then of course a possibility with the least probability as it somehow does a 180 and doesnt reach the full target as all since anything’s possible…but as I said, that scenario is the one with the lowest probability at the moment. *not financial advice*

ABTUSD - Massive Upside Move, More to Come or Downside We Go? As you can see, we technically set a higher low around 2.37 with the wick of the most recent upside hourly candle. It is critical that we break 2.40 within the next 24 hours, otherwise I fear we will lose some of the bulls who are in this for a quick swing trade.
For the record, I am long for over a year now, current average is $.26 =)
I believe we can see more upside, but we should tread lightly and watch volume for confirmation of price action.

ABTUSD - critical next 24 hours ABT has had an incredible upside move, but technically we have set a higher low just now with the wick of that hourly candle.
We need to break to the upside and set a new ATH withint the next 24 hours, otherwise we will likely see some more downside.
IMHO so please take any of this with a grain of salt.
For the record, I am long since $.10-$.26 average =)
