ACAUSDT Forming Descending ChannelACAUSDT is shaping up to be an exciting crypto pair to watch, as it is currently trading within a well-defined descending channel pattern. This technical setup is widely recognized by traders as a potential bullish reversal indicator once the price breaks out above the upper trendline. The consistent formation of lower highs and lower lows within the channel reflects a controlled pullback phase, setting the stage for a significant breakout that could deliver gains in the range of 90% to 100%+.
The good trading volume backing ACAUSDT’s current moves adds more conviction to this pattern. Increasing volume during a breakout from a descending channel often signals strong buying interest and growing momentum. This pattern has historically rewarded patient investors who can identify early signs of a reversal and position themselves accordingly. Many crypto traders actively search for descending channel breakouts to capitalize on explosive price moves that follow.
Investor sentiment around ACAUSDT is turning increasingly positive as more participants take notice of this project’s fundamentals and technical signals. This growing interest is helping to build a solid base of support, making a breakout even more likely. If the overall crypto market remains favorable, ACAUSDT could attract significant capital inflow once the breakout confirms, driving the price well beyond current levels and potentially outperforming many other altcoins.
✅ Show your support by hitting the like button and
✅ Leaving a comment below! (What is You opinion about this Coin)
Your feedback and engagement keep me inspired to share more insightful market analysis with you
ACAUSDT trade ideas
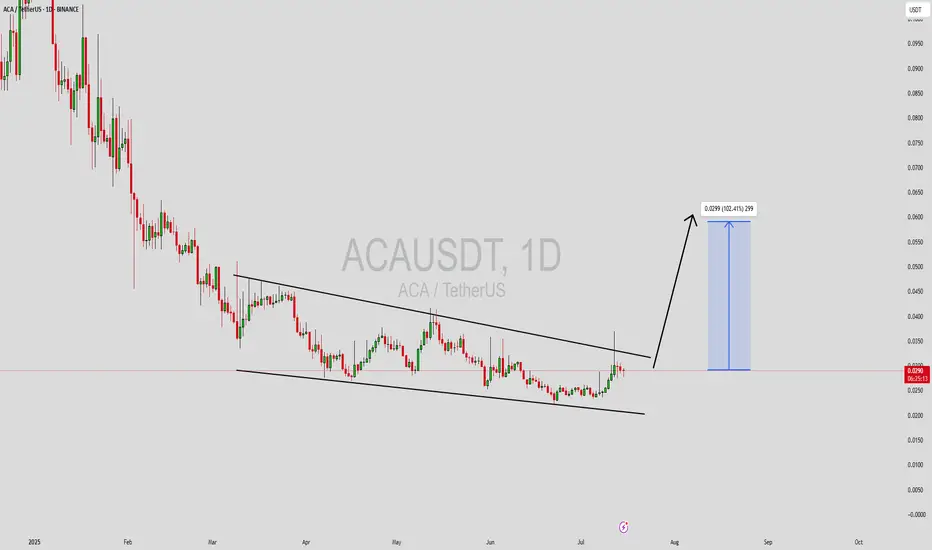
Acala Hits Bottom, Which Means Bull Market Next (2800-3500% PP)Acala is now five weeks into the fire. If you read often you will understand clearly what I mean; if you are new, this might not make much sense.
The low happened 14-April here, ACAUSDT. Some weak action and then red. Five weeks red and the action remains relatively sideways, not much change in price.
Current price trades above the 14-April low. The 14-April low was 0.02698. Current price is higher. Five weeks red, high bearish volume and yet, no new major lows.
Notice the drop from early December 2024 until April 2025. Five weeks red can cover a huge distance, there can be a strong decline. When you see five weeks red but no change in price, this is a bullish signal. It means that the bears have no strength. It means we are not seeing a bearish trend nor a bearish impulse, instead, a retrace and stop-loss hunt. Since bearish pressure is non-existent and after weeks of selling prices aren't going any lower, we can predict change soon.
This change is bullish. The bullish signal comes from the fact that the bearish action is just too weak. It is like seeing prices trading near resistance (say a new all-time high) for weeks, months with no advance. This would reveal that the top is in and a crash comes next. In this case, the bottom is in and a bull market will follow.
Thank you for reading.
Namaste.

ACAUSDT 1D Analysis ACA ~ 1D Analysis
#ACA Buy back gradually from here with a short term target of at least 15%+ from here, and a long term target of $0.1

ACAUSDT 1D#ACA is trading inside a Descending Channel on the daily chart — a pattern that often leads to a bullish breakout.
If the price manages to break above the channel resistance and the daily EMA50, we could see upside momentum toward the following targets:
🎯 $0.0335
🎯 $0.0382
🎯 $0.0475
🎯 $0.0613
⚠️ Always use a tight stop-loss to manage risk and protect your capital.

ACAUSDT forming a falling WedgeACAUSDT is currently displaying a strong falling wedge pattern—a historically bullish reversal structure that typically precedes sharp breakouts. After a prolonged downtrend, the price has formed lower highs and lower lows within a narrowing channel, suggesting decreasing selling momentum. The recent price action bouncing off the wedge's lower boundary, combined with a solid spike in volume, indicates a potential bottom formation and growing buyer interest.
Acala (ACA), known for its role in the Polkadot ecosystem as a decentralized finance hub, continues to show fundamental promise. With DeFi narratives heating up again and more liquidity flowing back into the Polkadot parachain ecosystem, ACA is regaining the attention of crypto investors and traders alike. Technical and fundamental convergence here is strong—making it a potential high-reward candidate for short- to mid-term bullish plays.
If this breakout confirms with strength above the wedge resistance, the projected price move could reach up to 90% to 100%+ based on measured move theory. Such breakouts often accelerate quickly due to short covering and renewed speculative interest. This is supported by rising trading volume and increased chatter among crypto communities, pointing toward renewed bullish momentum for ACAUSDT.
From a risk-reward perspective, the current zone near the wedge support offers an attractive entry for swing traders aiming to capitalize on the upcoming breakout. With multiple confluences lining up technically and fundamentally, this setup is one worth watching very closely.
✅ Show your support by hitting the like button and
✅ Leaving a comment below! (What is You opinion about this Coin)
Your feedback and engagement keep me inspired to share more insightful market analysis with you!

Acala Hits Bottom —Pre 2025 Bull Market Buy OpportunityLet's start with the long-term linear chart for perspective.
In this chart, we can see that the major decline ended in late 2022. All the action afterward is sideways.
Then we can notice the candles becoming ultra-small. This is the confirmation that the market is in a period of consolidation. At some point, the consolidation period ends and a new market cycle starts, the bull market.
Now, notice the far right, present day. Acala is trading at bottom prices and what happens? The highest volume ever, clearly visible; whales are buying.
So after years of sideways and strong new lows, buy activity goes off the chart. Those in the know are loading up and getting ready because Crypto is about to grow. The biggest growth cycle since 2021.
Thanks a lot for your continued support.
This is a friendly reminder. The best time to buy is now, when prices are low trading near support.
Namaste.

ACAUSDT 5DACA ~ 5D Analysis
#ACA Buy back from here if you still have a Conviction on this coin with a minimum target of 20%+.

#ACA/USDT#ACA
The price is moving in a descending channel on the 1-hour frame and is adhering to it well and is heading to break it strongly upwards and retest it
We have a bounce from the lower limit of the descending channel, this support is at a price of 0.0340
We have a downtrend on the RSI indicator that is about to break and retest, which supports the rise
We have a trend to stabilize above the moving average 100
Entry price 0.0377
First target 0.0404
Second target 0.0435
Third target 0.0474

ACAUSDT 5DACA ~ 5D Analysis
#ACA Re -visiting this lowest support.
Buy gradually from here if you still have a Conviction on this coin with a short -term target of at least 20%+.

ACAUSDT UPDATEACAUSDT is a cryptocurrency trading at $0.0430. Its target price is $0.0800, indicating a potential 80%+ gain. The pattern is a Bullish Falling Wedge, a reversal pattern signaling a trend change. This pattern suggests the downward trend may be ending. A breakout from the wedge could lead to a strong upward move. The Bullish Falling Wedge is a positive signal, indicating a potential price surge. Investors are optimistic about ACAUSDT's future performance. The current price may be a buying opportunity. Reaching the target price would result in significant returns. ACAUSDT is poised for a potential breakout and substantial gains.

SPOT ACA LONG 27.01.2025Pinning after exhaustion of sales.
🎯Purpose:
0.1135
I'll let you know when I record it manually.
‼️Risk per trade: 1% of the allocated funds for spot trading.

ACAUSDT %1600 Daily Volume SpikeACAUSDT Analysis: Patience with Precision
With a %1600 daily volume increase , SCRTUSDT is showing heightened activity. The blue box marked on the chart is identified as a strong demand zone , offering a high-probability entry point.
Key Points:
Demand Zone: The blue box is strategically selected using advanced analysis techniques.
Volume Surge: A significant spike in volume suggests potential for strong moves.
Wait for Confirmation: Be patient and allow the price to confirm before entering.
Trading Strategy:
When trading the blue box, I rely on these indicators for confirmation:
Cumulative Delta Volume (CDV)
Liquidity Heatmap
Volume Profile
Volume Footprint
Upward Market Structure Breaks on Lower Time Frames
Learn the Process:
I can teach you how to effectively use CDV, liquidity heatmaps, volume profiles, and volume footprints. DM me to elevate your trading skills and make better-informed decisions.
Final Remarks:
Patience is key in markets like this. Manage your risk carefully and ensure proper confirmation before taking action. Wishing everyone successful trades!

SPOT ACA LONG 24.12.2024Pinning after containment of sales.
🎯Purpose:
0.1288
‼️Risk per trade: 0.5% of the allocated funds for spot trading.
Thank you for subscribing and responding🚀.

ACAUSDT 1WACA ~ 1W
#ACA This trade is high risk. However, if you still have Conviction on this coin,. This support block would be a very good buying place for now.with a short term target of at least 20%++

Aca will go higher and higher in daily tfDear friends,
as you can see on the chart that aca is approaching to break the above resistance & it will break those levels in next week , it will climb higher and higher this is your chance now for react.
nfa dyor
initial tp's 0.14 , 0.16

ACA short term call for 0.13ACA has broken the LH and moving to move to HH i believe it can move to reach the TP-1 0.13

ACA/USDT: Bullish Harmonic Pattern in the Making"ACA/USDT is shaping up with a bullish harmonic pattern and is currently testing a critical support zone. The symmetrical triangle breakout is key, and price action indicates potential for a strong move! 📈
Stay patient and disciplined — opportunities like these reward traders who wait for confirmations. Remember, every challenge in the market is an opportunity in disguise. 💪
👉 Key Levels to Watch:
Resistance: 0.1150
Support: 0.1100
Break and retest will guide the next major move. Stick to your strategy, set your stops wisely, and let the market do the rest! 🚀
Tag your trading partners and let's ace this together! 🔥✨ #Crypto #ACAUSDT #TradingMotivation"

$ACAUSDT - This is how $ACA will play out. BINANCE:ACAUSDT :- Currently bullish on the 1H and 4H TF's. A small pending pullback on the 1H chart but from there we should look good. Check out the chart

Acala And Many Cryptocurrency Projects Will Grow 10X+ In 2025It seems the minimum now for 2025 for each pair is 10X (1,000% potential). Or at least I am looking for those with 10X or more.
Acala (ACAUSDT) hit bottom in June 2023. We have a higher low in August 2024.
Taking the current price as an entry level, hitting 0.74700 would produce a total of 1,000%+ growth. This would match the same prices ACAUSDT traded back in May 2022, not even a new All-Time High. The truth is that the charts, the market and recent action across many Altcoins, are pointing to so much more. So these are conservative targets.
What will happen in 2025?
What will happen that it is so big that will make Cryptocurrency grow this much?
One is the normal market cycle, we get a strong bull-market every four years. That's one thing.
The other thing is the global financial situation. While many people can consider socio-political instability and financial meltdown as something negative, the truth is that the end of something is the beginning of something else. As the scientist like to say, energy cannot be destroyed it can only be transformed. So if one market loses favor another gains.
Then there is also the evolution of money, the evolution of finance and humanity, technology... I mean, can you say the Internet wave is over? Can you say the technology wave is over? It is all only getting started.
Can you say the Cryptocurrency wave is over? This is only the beginning.
It will all grow because we are all growing.
The market is a reflection of us.
As humanity grows and evolves, so does Crypto and the rest of the world.
It is not only Crypto, everything that encourages freedom, abundance and innovation will grow.
There is no going back, you cannot live without a smartphone, you cannot go back to landline phones. You cannot go back to checks and gold coins, we have virtual money now; Bitcoin is the door, the Altcoins are the furniture which you use to entertain yourself, have fun and enjoy. This is the house of Crypto. Success is yours.
Namaste.

Trade Signal for ACAUSDT: Buy OpportunityHello Traders,
I am excited to share a trade signal for ACAUSDT utilizing our advanced EASY Quantum Ai strategy. Based on comprehensive data analysis and strategic insights, we see a promising buy opportunity. Here are the key details of this trade:
Direction: Buy
Enter Price: 0.0584
Take Profit: 0.05986667
Stop Loss: 0.05576667
Our prediction for this movement is grounded in several critical factors.
First, the ACAUSDT pair has shown a consistent upward momentum, with bullish signals in the past trading sessions. This is supported by strong volume increases, suggesting increased investor confidence and potential for price rally.
Second, technical indicators such as moving averages and the RSI have reached levels that historically signal a potential upward move. The moving average crossover points to a bullish trend, while the RSI remains in a zone that typically precedes price growth.
Additionally, market sentiment and broader economic factors suggest a favorable environment for digital assets, particularly for altcoins like ACA in the current market cycle.
With these insights, entering a buy position at the specified price offers a calculated opportunity with defined risk and reward parameters. As always, ensure you manage your risk appropriately.
Happy Trading!
Note: This forecast is made using the EASY Quantum Ai strategy and is for informational purposes only.

#ACA (SPOT) entry range(0.0360- 0.0580) T. (0.3090) SL (0.0309)BINANCE:ACAUSDT
entry range (0.0360- 0.0580)
Target1 (0.1039)- Target2 (0.1450) - Target3 (0.1798) - Target4 (0.3090)
SL .1D close below (0.0309)
*** Collect slowly in the entry range ****
*** This trade is short time investment ****
**** #Manta ,#OMNI, #DYM, #AI, #IO, #XAI , #ACE #NFP #RAD #WLD #ORDI #BLUR #SUI #Voxel #AEVO #VITE #APE #RDNT #FLUX #NMR #VANRY #TRB #HBAR #DGB #XEC #ERN #ALT #IO #ACA ****

ACAUSDTWe can attempt to buy ACAUSDT from specified level as it make HL , also there is no bearish divergence occur indicate that it moves upward.
SL , TP mention in chart.

ACAUSDT(AcalaToken) Updated till 01-09-24ACAUSDT(AcalaToken) Daily timeframe range. PA is in what i call semi-depressed zone. of course we can see some accumulation but a retrace is only valid when it breaks 0.0751 clean. its been holding decently for a while now. recent support at 0.0494.
