ACE/USDT Testing Long-Term Downtrend – Will It Break Out?Chart Overview:
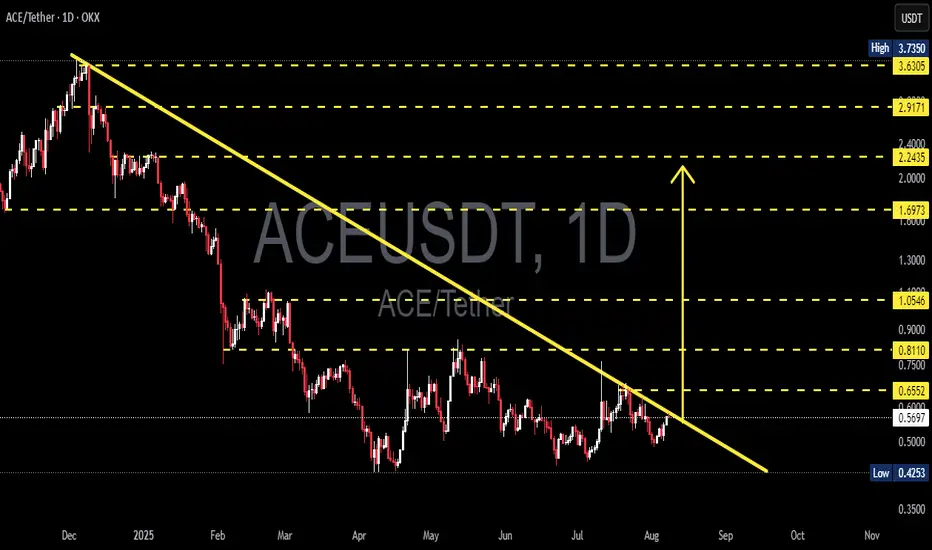
The ACE/USDT pair on the 1D (Daily) timeframe is currently in a prolonged downtrend that has persisted since early 2025. The price has consistently formed lower highs, and it's been contained under a well-respected descending trendline (yellow line).
Currently, ACE is approaching a key decision point near the trendline resistance zone ($0.57–$0.60). What happens at this level will likely determine the next major move.
---
🟢 Bullish Scenario: Breakout Ahead?
If the price successfully breaks above the descending trendline and confirms with a daily close above $0.6552, we could see a trend reversal from bearish to bullish. Key resistance levels to watch for potential upside targets are:
1. $0.8110 – psychological and structural resistance
2. $1.0546 – strong previous resistance
3. $1.6973 – mid-term bullish target
4. $2.2435 and $2.9171 – extended bullish targets if momentum continues
Confirmation should be supported by increasing volume and RSI breaking above 50.
---
🔴 Bearish Scenario: Another Rejection?
If the price fails to break the trendline and gets rejected, ACE/USDT may resume its downward trajectory and test the following support levels:
1. $0.5691 – immediate support
2. $0.5000 – psychological support
3. $0.4253 – historical low and potential demand zone
This scenario would reaffirm continued bearish dominance and prolong the current downtrend.
---
📊 Pattern Analysis: Descending Trendline
The dominant pattern here is a descending resistance trendline, showing clear selling pressure and bearish market structure.
A breakout would signal the first major higher high in months – a potential trend reversal signal.
---
🎯 Conclusion & Strategy:
ACE is at a crucial inflection point.
Traders should wait for confirmation before entering a breakout trade.
If a breakout occurs, consider a buy-the-breakout strategy with a stop-loss below the trendline.
If rejected, a short/rejection play toward lower support zones could be viable.
#ACEUSDT #CryptoAnalysis #Altcoins #TechnicalAnalysis #BreakoutTrade #BearishScenario #BullishScenario #DescendingTrendline
ACEUSDT trade ideas
ACEUSDT Breakout and Retested ready to go longACEUSDT was trading within a wedge-like channel pattern, but has now broken above the resistance, retested the breakout level as support, and is showing signs of a potential move for a new long-term uptrend

ACEUSDT 1D#ACE has broken above the descending triangle and the EMA100 on the daily chart. If the price holds above the breakout level, the potential targets are:
🎯 $0.818
🎯 $0.939
🎯 $1.060
🎯 $1.233
🎯 $1.453
⚠️ Always use a tight stop-loss and practice proper risk management.

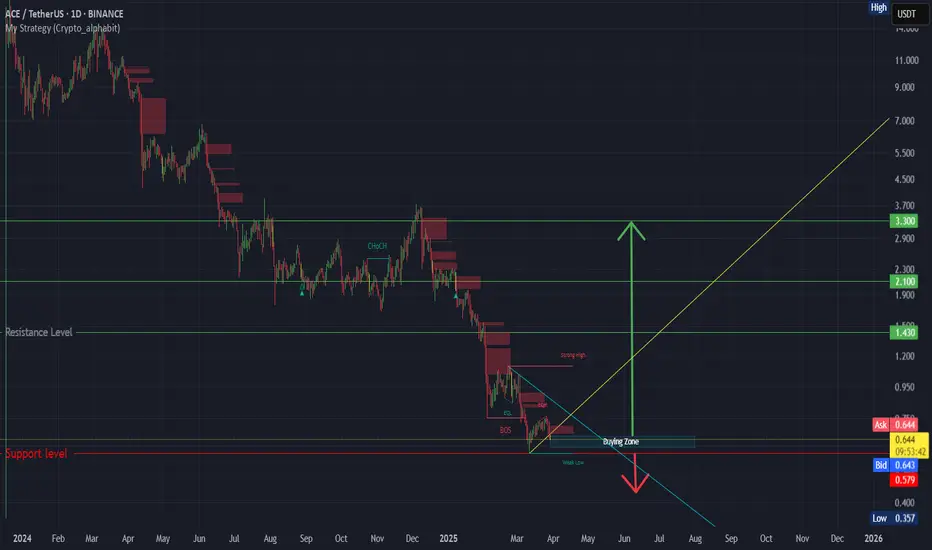
ACE/USDT – Breaking Out of the Falling Wedge? Potential Reversal📝 Technical Analysis Overview:
The ACE/USDT pair on the daily timeframe (1D – Binance) is showing signs of a potential breakout from a long-standing falling wedge pattern, suggesting a possible trend reversal to the upside.
🔍 Key Technical Highlights:
1. Falling Wedge Pattern:
A clearly defined falling wedge has formed from the December 2024 peak near $3.742, down to the current consolidation zone between $0.425–$0.514.
This yellow support box represents a strong demand zone, with repeated price reactions since April 2025.
2. Major Support and Resistance Levels:
Strong Support: $0.425 – $0.514 (accumulation zone)
Potential Resistance / Upside Targets:
$0.622
$0.756
$1.053
$1.339
$1.703
$2.254
$2.882
$3.623 (just below the previous high at $3.742)
3. Bullish Breakout Scenario:
A confirmed breakout above the descending trendline and resistance at $0.622 could trigger a bullish move toward higher targets.
The first key breakout confirmation would be a daily close above $0.756 with increasing volume.
4. Early Signals & Validation:
A breakout with strong momentum followed by a successful retest of the trendline would validate the bullish setup.
Watch for high volume and candle structure during the breakout phase to avoid fakeouts.
📌 Summary:
ACE is currently testing the final stage of a bullish falling wedge. A successful breakout could lead to a strong trend reversal with targets beyond $1.0 and higher. This setup offers a good risk/reward opportunity for bullish traders—confirmation is key.

ACEUSDT UPDATEACE/USDT Technical Setup
Pattern: Falling Wedge Breakout
Current Price: $0.635
Target Price: $1.714
Target % Gain: 250.34%
Technical Analysis: ACE has broken out of a long-term falling wedge pattern on the 1D chart with strong bullish momentum. Volume has increased significantly, confirming the breakout with potential for a 250% upside move.
Time Frame: 1D
Risk Management Tip: Always use proper risk management.

ACEUSDT 1D AnalysisACE ~ 1D Analysis
#ACE is attempting to break through this resistance line. A full-body candle close above this resistance line will confirm a continued bullish trend with a minimum target of 10%+.

ACE (SPOT - INVEST )BINANCE:ACEUSDT
ACE / USDT
(4H + 1D) time frames
analysis tools
____________
SMC
FVG
Trend lines
Fibonacci
Support & resistance
MACD Cross
EMA Cross
______________________________________________________________
Golden Advices.
********************
* Please calculate your losses before any entry.
* Do not enter any trade you find it not suitable for you.
* No FOMO - No Rush , it is a long journey.
Useful Tags.
****************
My total posts
www.tradingview.com
TECHNICAL ANALYSIS TAGALOGd : red
bb 50 below
rsi below 50
4hr: red
bb50: dt
rsi below 50
Right hand
double bottom
15: 3rd buga pababa na
bb 50 baba ng resistance line
note
- downtrend
-no excessive move tapos
na nung sunday night
price rejected on resistance line from left
pullback waiting if bounce
bias shorting
possible tabo tp 1.236

#ACE (SPOT) IN ( 1.700- 2.200) T.(8.000) SL(1.671)BINANCE:ACEUSDT
#ACE / USDT
Entry( 1.700- 2.200)
SL 1D close below 1.671
T1 3.300
T2 4.000
T3 4.800
T4 5.800
T5 8.000
______________________________________________________________
Golden Advices.
********************
* collect the coin slowly in the entry range.
* Please calculate your losses before the entry.
* Do not enter any trade you find it not suitable for you.
* No FOMO - No Rush , it is a long journey.
Useful Tags.
****************
My total posts
www.tradingview.com
**********************************************************************************************
#Manta #OMNI #DYM #AI #IO #XAI #ACE #NFP #RAD #WLD #ORDI #BLUR #SUI #VOXEL #AEVO #VITE #APE #RDNT #FLUX #NMR #VANRY #TRB #HBAR #DGB #XEC #ERN #ALT #IO #ACA #HIVE #ASTR #ARDR #PIXEL #LTO #AERGO #SCRT #ATA #HOOK #FLOW #KSM #HFT #MINA #DATA #SC #JOE #RDNT #IQ #CFX #BICO #CTSI #KMD #FXS #DEGO #FORTH #AST #PORTAL #CYBER #RIF #ENJ #ZIL #APT #GALA #STEEM #ONE #LINK #NTRN #COTI #RENDER #ICX #IMX #ALICE #PYR #PORTAL #GRT #GMT #IDEX #NEAR #ICP #ETH #QTUM #VET #QNT #API3 #BURGER #MOVR #SKL #BAND #ETHFI #SAND #IOTX #T #GTC #PDA #GMX #REZ #DUSK #BNX #SPELL #POWR #JOE #TIA #TFUEL #HOT #AVAX #WAXP #OGN #AXS #GALA #ONE #SYS #SCRT #DGB #LIT #QI #FIL

Trading opportunity for ACEUSDTBased on technical factors there is a Buy position in :
📊 ACEUSDT
🔵 Buy Now
🪫Stop loss 1.980
🔋Target 2.400
📏 R/R 1.8
💸RISK : 1%
We hope it is profitable for you ❤️
Please support our activity with your likes👍 and comments📝

ACE LOOKS BULLISH (1D)It looks like it is going to finish the big C wave which is a triangle and enter the D wave.
Wave D is bullish.
We have two entry points marked on the chart.
The target can be the red box.
Closing a daily candle below the invalidation level will violate this analysis
For risk management, please don't forget stop loss and capital management
Comment if you have any questions
Thank You

ACE Long 15m Sl -9.33%ACE Long Setup
Reason:
Strong Bullish Momentum.
Breakout Confirmation done on HTF
Resting in Golden Pocket.
All technical indicators Suggesting bullish Sign
Possible in very short term.
Best Regard,
Crypto Panda
BINANCE:ACEUSDT
BINANCE:ACEUSDT.P
BYBIT:ACEUSDT.P

ACEUSDT 1WACE ~ 2D
#ACE Back to retesting this support block. So far this support block continues to keep the price from falling lower. If you still have Conviction on this coin,. This support block would be a very good buying place for now. with a target of 20%++

ACEUSDT Trend Line Breakout!ACEUSDT Technical Analysis update
ACEUSDT is breaking its trend resistance line after 140 days of consolidation. Once the breakout is confirmed on the daily chart, we can expect a strong bullish move. The price has touched the 1.80 level multiple times and bounced back to resistance, but this time it has broken through the resistance line.

ACE Looks BullishOn a larger scale, ACE is inside a large diametrical, which is now at the end of wave C.
Wave C is a triangle.
By maintaining the green range and KEY level, it can move to the red box.
Closing a daily candle below the invalidation level will violate this analysis.
For risk management, please don't forget stop loss and capital management
Comment if you have any questions
Thank You

#ACE , $ACE in a very nice range for a good profitfor Short term investors , for swing traders
#trading #cryptocurrencytrading #bitcoininvestments #bitcoin #Investing_Coins , #Investingcoins, #Crypto_investing, #Cryptoinvesting, #investing, (#BTC, CRYPTOCAP:BTC , #Manta, #OMNI, #DYM, #AI, #IO, #XAI , #ACE)
BINANCE:ACEUSDT

Bullish Divergence keep it simple and wait for the bullish divergence to finish loading while finding a bottom.

ACEUSDTACE ~ 1D
#ACE If you have Conviction on this coin,. This support block would be a very good buy for now.

ACE potential ACE / USDT
Price printed Falling wedge breakout retest in HTF, also spotted some volume and movement recently into it
Note: don’t know the fundamentals about this token #DYOR

ACEUSDT Moving up soonACE has been in a downtrend for the past few months and recently it have been printing bullish divergences on the 3 days time frame which can indicate we wills see some bullish price action in the next few weeks.
Bullish divergences are form when the price action makes lower lows and the RSI makes higher highs. I have pointed some arrows up showing the lower lows and you wills see the RSI where it make the higher highs.
However take into consideration that this is not a guarantee long signal as sometimes it can get invalidated and we can go lower. I would say if it retest 1.50-1.90 and hold this level as support we can have a better entry for long.

ACEUSDTACE ~ 2D ✅
#ACE If you have Conviction on this coin,. You need to pay attention to this chart.
Make purchases gradually after breaking through the resistance line of this descending pattern.

Ace / Usdt BINANCE:ACEUSDT
Ace Coin with a focus on its current price level and resistance zones. If the price is holding steady at $2.3445, and if it breaks through the current resistance levels, the next potential resistance zones you’ve identified are between $2.534 and $3.1244.
Ace Coin is currently priced at $2.3445, and if it maintains this level, it could be poised for further gains. In technical analysis, if a price level holds steady and doesn’t fall, it often signals potential for upward movement. The next resistance zones identified for Ace Coin are between $2.534 and $3.1244.
Resistance zones are price levels where selling pressure is strong enough to potentially halt or reverse an upward trend. For Ace Coin, if it can break through the initial resistance at $2.534, it might face less resistance as it approaches the higher zone near $3.1244. This breakout could be seen as a bullish signal, suggesting that the coin has momentum and could continue appreciating.
Investors should monitor Ace Coin’s ability to hold its current price and watch for any significant volume or market news that might drive it past these resistance levels. It’s also important to consider broader market conditions and any fundamental factors impacting the coin. Always approach such investments with a clear strategy and risk management plan.
Disclaimer : I am Not Financial Adviser

