ACM 20% PROFIT TARGETHello traders, see the chart for detailed information and dont forget we consider both scenarios.. cost averaging.
tradehubng.
ACMUSDT trade ideas

ACMUSDT (AC MILAN FAN TOKEN) - BULLISH SETUP ANALYSIS 🔎
- ACMUSDT is printing a falling wedge (FW) pattern.
- A falling wedge pattern is a reversal pattern.
- A bullish pattern to be precise.
- There's a breakout potential.
BUY ENTRY ⬆️
- Breakout above the falling wedge's resistance.
TARGETS 🎯
- Horizontal resistance level (R1).
- Horizontal resistance level (R2).
SETUP INVALIDATION ❌
- Breakdown below the falling wedge's support.

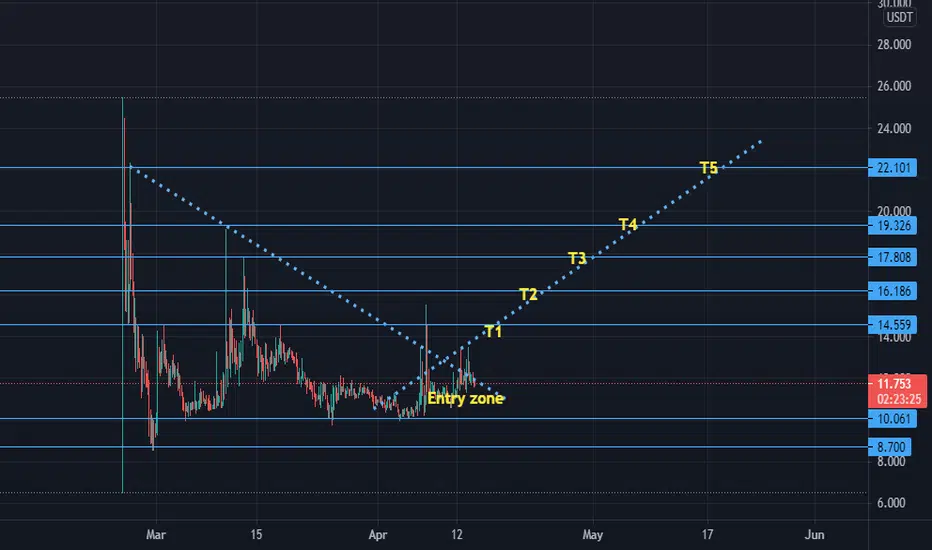
#ACMUSDT 4H#ACMUSDT BINANCE -SPOT
29-APRIL-2021
4H
👉Entry: 9.2 - 10.5
🚀Targets: 13.9 - 17.7 - 21.8 - 24.1 - 33.2 +++
⚡️use 5% max of your deposit
🚦STOP: 8.5
🚦STOP: Close daily candle below 8


ACM triangleACM has formed a beautiful triangle and i expect the triangle to be broken out to the upside.but we should wait for confirmation and a h4 candle to be closed over bearish trend lines and then we can expect 23.3.keep it in your watchlist and wait for breakout.


SHORT TERM! BUY ACMUSDT.short-term traders can buy ACMUSDT at market and sell at 14.
hold it longer to reach to 17, 20, 22.


ACM/USDT Analysis...Chart shows that the candles are closeing to the End of Triangle in April 20.
What do you see in this Chart?


Buy on Daily.Expecting an impulsive move up, as Acm has tested this $10 area many times and we can say it's sitting at its local bottom.
Its time for the leg up for Acm.


AC Milan Fan Token formed Gartley for upto 47% profit rallyHi dear patrons, hope you are well and welcome to the new update on AC Milan Fan Token.
The previous idea of ACM token produced more than 110% profit rally:
Now on daily time period chart the price action of ACM token has completed the formation of a bullish Gartley pattern.
This trade has a profit possibility up to 47% and the loss possibility is 12%.
Note: Above idea is for educational purpose only. It is advised to diversify and strictly follow the stop loss, and don't get stuck with trade


ACMUSDT 60% upHello traders!
It drops to the expected price which was 8.9 and now it is up 60%. once it reach 100% of the investment start take profits
I am expecting it to reach the 20$ target.
Hit the like button to support the idea.
Previous analysis


ACMUSDT Pending BuyHello Traders!
This is ACMUSDT analysis and I am expecting 100% profit from the move.
In the chart you can see the J pattern and after that Market failed to find support at the first support area which is the point where J pattern started.
Now I am expecting ACMUSD to move to 8.9 but the best price to buy is 10-11 because it might catch the strength before the expected price.
Target is 20 which is closer to the peak of J pattern but soon it will break the peak of J pattern.
Don't forget to hit the like button.
