Corn Futures ( ZC1! ), H4 Potential for Bullish Momentum Title: Corn Futures ( ZC1! ), H4 Potential for Bullish Momentum
Type: Bullish Momentum
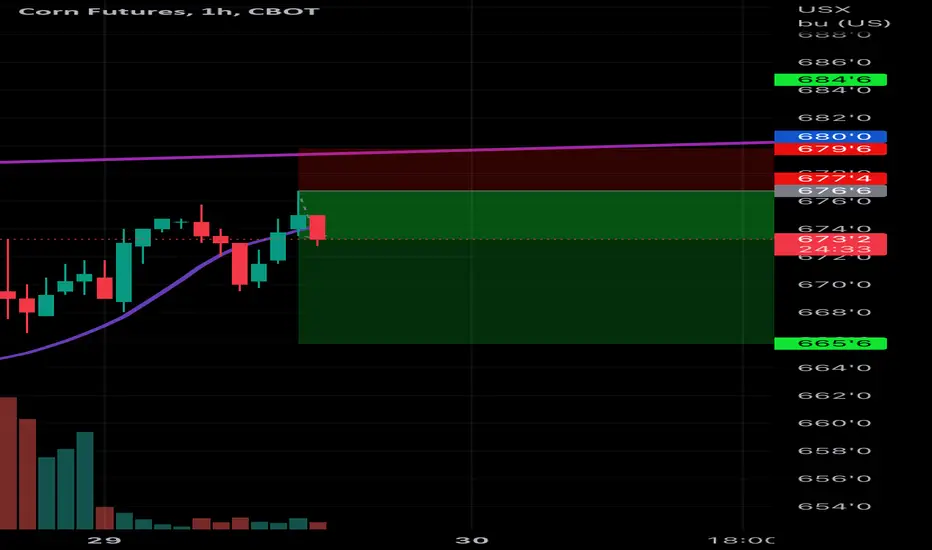
Resistance: 698.00
Pivot: 661.40
Support: 661.50
Preferred Case: Corn has been rising since September 28, 2022. The price is above the ichimoku cloud, adding to the bullish market bias. Price is currently consolidating along the 50% and 38.2% Fibonacci lines, which mark the first support level at 680.4. If the bullish momentum continues, price may move towards the first resistance level at 698.0, which contains two 100% Fibonacci lines.
Alternative scenario: Price may break through the first support and continue to fall towards 661.4, the pivot point and previous swing low.
Fundamentals: There are no major news.
CORNU2025 trade ideas

Corn Futures ( ZC1! ), H4 Potential for Bullish MomentumTitle: Corn Futures ( ZC1! ), H4 Potential for Bullish Momentum
Type: Bullish Momentum
Resistance: 698.00
Pivot: 661. 40
Support: 661.50
Preferred Case: Corn has been on a bullish trend since September 28, 2022. Price is above the ichimoku cloud , which denotes a bullish market, adding to this confluence. Price reversed course through the first support level at 680.4, which is marked by the 50% and 38.2% Fibonacci lines. Expect price to continue moving upwards approaching the first barrier at 698.0, which is where two of the 100% Fibonacci lines are situated, if this bullish momentum persists.
Alternative scenario: The first support, at 680.4, may be where corn reverses back down. Price may then continue to fall toward the pivot point and prior swing low at 661.4 from there.
Fundamentals: There are no major news.

Corn Futures ( ZC1! ), H4 Potential for Bullish Momentum Title: Corn Futures ( ZC1! ), H4 Potential for Bullish Momentum
Type: Bullish Momentum
Resistance: 698.00
Pivot: 661.40
Support: 661.50
Preferred Case: Corn has been on a bullish trend since September 28, 2022. Price is above the ichimoku cloud, which denotes a bullish market, adding to this confluence. Price reversed course through the first support level at 680.4, which is marked by the 50% and 38.2% Fibonacci lines. Expect price to continue moving upwards approaching the first barrier at 698.0, which is where two of the 100% Fibonacci lines are situated, if this bullish momentum persists.
Alternative scenario: The first support, at 680.4, may be where corn reverses back down. Price may then continue to fall toward the pivot point and prior swing low at 661.4 from there.
Fundamentals: There are no major news.

Corn Futures Continue to Consolidate Fundamental Spotlight:
Weekly Export Inspections
Corn: 661,658 metric tons; in line with analysts' estimates
Soybeans: 575,220 metric tons; in line with analysts' estimates
Wheat: 667,577 metric tons; above analysts' estimates.
Crop Progress
Corn: 20% harvested, this was within the range of estimates, 7% behind last year's pace
Soybeans: 22% harvested; this is a faster pace than expectations, but 9% behind last year's pace.
A Look at the Outside Markets
The dollar is continuing to retreat, trading back to one of the September 23rd breakout point near 111. If the dollar continues to retreat it may offer some support to commodities. Oil is approaching yesterday's high and equity markets are continuing to rally, trading roughly 2% higher this morning.
Technical Snapshot:
Corn
December corn futures were able to gain some ground to start the week, but the overall performance was still less than impressive considering the risk-on trade in other markets. The market is right in our pivot pocket this morning, we've outlined that as 678-682. A close above here could spark a move back towards resistance, we see that coming in from 698-700. We have been in and remain in the camp that believes there will be short term trading opportunities for participants on both sides. A break above resistance or below support would likely change that theses as we could see the market take more of a direction, other than sideways.
Bias: Neutral/Bearish
Previous Session Bias: Neutral/Bearish
Resistance: 698-700**, 725 3/4-728 1/4****
Pivot: 678-682
Support: 665-668 1/2***, 647 1/4-650 1/4****
Futures trading involves substantial risk of loss and may not be suitable for all investors. Trading advice is based on information taken from trade and statistical services and other sources Blue Line Futures, LLC believes are reliable. We do not guarantee that such information is accurate or complete and it should not be relied upon as such. Trading advice reflects our good faith judgment at a specific time and is subject to change without notice. There is no guarantee that the advice we give will result in profitable trades. All trading decisions will be made by the account holder. Past performance is not necessarily indicative of future results.

Corn Futures ( ZC1! ), H4 Potential for Bearish Momentum Title: Corn Futures ( ZC1! ), H4 Potential for Bearish Momentum
Type: Bearish Momentum
Resistance: 691.0
Pivot: 661.40
Support: 675.60
Preferred Case: The H4 price is in a downward trend. Price breached and closed below the first resistance level at 691.00. Price could potentially reverse back down to the pivot line and 20% retracement level at 661.40.
Alternative scenario: If the bullish momentum continues, price will move to 688.0, where the 23.6% Fibonacci line is located.
Fundamentals: There are no major news.

Corn Futures ( ZC1! ), H4 Potential for Bearish Momentum Title: Corn Futures ( ZC1! ), H4 Potential for Bearish Momentum
Type: Bearish Momentum
Resistance: 691.0
Pivot: 661.40
Support: 675.60
Preferred Case: The overall price on the H4 is bullish. Furthermore, the price is above the Ichimoku cloud, indicating that the market is bullish. Price attempted but failed to breach the first resistance level at 691.00. Price responded with a massive rejection wick. Price could potentially reverse back down to the first support level at 675.6, which also happens to be the 61.8% Fibonacci retracement line.
Alternative scenario: If bullish momentum continues, expect price to move towards 705.6, which contains the -27.2% Fibonacci expansion line and the 127.2% Fibonacci extension line.
Fundamentals: There are no major news.

Corn Futures ( ZC1! ), H4 Potential for Bullish Momentum Title: Corn Futures ( ZC1! ), H4 Potential for Bullish Momentum
Type: Bullish Momentum
Resistance: 6.900
Pivot: 667.50
Support: 6.310
Preferred Case: On the H4, the overall price is bearish. In addition, the price is below the Ichimoku cloud, indicating a bear market. Price attempted but failed to break through the Pivot at 667.500 overnight. Price could potentially reverse up to the first resistance level at 6.900, where the 38.2% Fibonacci line is located.
Alternative scenario: If bearish momentum persists, expect price to continue falling towards the first support level at 6.310, where the larger 78.6% Fibonacci line is located.
Fundamentals: There is no major news.

Corn Futures ( ZC1! ), H4 Potential for Bullish MomentumTitle: Corn Futures ( ZC1! ), H4 Potential for Bullish Momentum
Type: Bullish Momentum
Resistance: 680.00
Pivot: 667.50
Support: 661.75
Preferred Case: On the H4, the overall price is bearish . In addition, the price is below the Ichimoku cloud , indicating a bear market. Price has broken through the Pivot at 667.4, which corresponds to the previous swing low. Price also rebounded from the first support and rose above the first pivot . Price may maintain its short-term bullish momentum and move towards the first resistance level at 680.0, where the 38.2% Fibonacci line is located.
Alternative scenario: The price could reverse and head back down to the first support level at 661.75, where the -27.2% Fibonacci expansion is located.
Fundamsentals: There is no major news.

Daily ZC analysisDaily ZC analysis
Sell trade with target and stop loss as shown in the chart
The trend is down and we may see more drop in the coming period in the medium term
All the best, I hope for your participation in the analysis, and for any inquiries, please send in the comments
Corn Futures ( ZC1! ), H4 Potential for Bullish Momentum Title: Corn Futures ( ZC1! ), H4 Potential for Bullish Momentum
Type: Bullish Momentum
Resistance: 680.00
Pivot: 667.50
Support: 661.75
Preferred Case: On the H4, the overall price is bearish. In addition, the price is below the Ichimoku cloud, indicating a bear market. Price has broken through the Pivot at 667.4, which corresponds to the previous swing low. Price also rebounded from the first support and rose above the first pivot. Price may maintain its short-term bullish momentum and move towards the first resistance level at 680.0, where the 38.2% Fibonacci line is located.
Alternative scenario: The price could reverse and head back down to the first support level at 661.75, where the -27.2% Fibonacci expansion is located.
Fundamsentals: There is no major news.

Commodity Corn idea (28/09/2022)corn
We expect a drop in corn grains in the coming period and the end of the rise in wave ((C)) of wave II and the beginning of the decline in wave III targeting. prices of 585 and the decline depend on the decisive point 699

Corn Futures ( ZC1! ), H4 Potential for Bearish MomentumTitle: Corn Futures ( ZC1! ), H4 Potential for Bearish Momentum
Type: Bearish Momentum
Resistance: 679.25
Pivot: 667.50
Support: 660.00
Preferred Case: Overall price is bearish on the H4 with a retail double top formed. Price is also below the Ichimoku cloud which indicates a bear market. Price has broken through and closed the pivot at 667.4 where the previous swing low is. Expecting price to continue this bearish momentum and head towards the 1st support at 660.0 where the 127.2% Fibonacci extension line is.
Alternative scenario: Alternatively, the price may reflect off the pivot back up towards the 1st resistance
Fundamentals: No major news

Corn Futures ( ZC1! ), H4 Potential for Bearish Momentum Title: Corn Futures ( ZC1! ), H4 Potential for Bearish Momentum
Type: Bearish Momentum
Resistance: 679.25
Pivot: 667.50
Support: 660.00
Preferred Case: Overall price is bearish on the H4 with a retail double top formed. Price has broken through the 1st resistance at 679.25 where the 61.8% Fibonacci line is. Price could possibly retrace back up towards 677.6 where the 38.2% Fibonacci line and 1st resistance lie before heading down, breaking the pivot at 667.5 and then moving towards 1st support at 660.00 where the 127.2% Fibonacci extension line is.
Alternative scenario: Alternatively, the price may continue heading down towards the pivot before bouncing back up towards the 1st resistance.
Fundamentals: No major news

Commodity Corn idea (23/09/2022)Corn
The decline continues, since trading is less than the top of the B wave at 699.75 prices, and this decline continues to lower to the end of the III wave, targeting 585.75 prices in the medium term as well as in the long term

Corn Futures ( ZC1! ), H4 Potential for Bearish MomentumTitle: Corn Futures ( ZC1! ), H4 Potential for Bearish Momentum
Type: Bearish Momentum
Resistance: 698.50
Pivot: 667.50
Support: 679.25
Preferred Case: Price has reflected off the first support level at 698.50 on the H4 and appears to be descending again to test it. watch for the price to cross the first support level and go toward the pivot at 667.50, which is where the previous swing low lies. The chart appears to be constructing a double top with equal highs along the first resistance, which adds another confluence to this bias.
Alternative scenario: Alternatively, the price may bounce off the first support and continue moving back up toward the first resistance.
Fundamentals: No major news.

Corn Futures ( ZC1! ), H4 Potential for Bullish RiseTitle: Corn Futures ( ZC1! ), H4 Potential for Bullish Rise
Type: Bullish Rise
Resistance: 710.4
Pivot: 699.4
Support: 679.25
Preferred Case: On the H4, the price has came back down to test the 1st support at 679.25 and has reflected off it. Price has also went back above the Ichimoku cloud which indicates a bullish bias. Looking for price to continue bullish to hit the first resistance at 710.4 where the -27.2% Fibonacci expansion lies.
Alternative scenario: Alternatively, the price could drop down below the first support and head towards the second support at 668.25, where the 78.6% Fibonacci retracement line and previous swing low lies.
Fundamentals: No major news.

Corn Futures (ZC1!), H4 Potential for Bullish RiseTitle: Corn Futures ( ZC1! ), H4 Potential for Bullish Rise
Type: Bullish Rise
Resistance: 710.4
Pivot: 699.4
Support: 679.25
Preferred Case: On the H4, the price has bounced off the second support at 668.25 which is at the 78.6% Fibonacci retracement line, and went above the first support at 679.25. Price has also gone above the Ichimoku cloud which indicates a bullish bias. Looking for price to continue bullish to hit the first resistance at 710.4 where the -27.2% Fibonacci expansion lies.
Alternative scenario: Alternatively, the price could bounce back down from the pivot structure and drop to first support to 679.25, where the 50% Fibonacci retracement line sits
Fundamentals: No major news.

Corn Futures (ZC1!), H4 Potential for Bullish RiseTitle: Corn Futures (ZC1!), H4 Potential for Bullish Rise
Type: Bullish Rise
Resistance: 710.4
Pivot: 699.4
Support: 679.25
Preferred Case: On the H4, the price has bounced off the second support at 668.25 which is at the 78.6% Fibonacci retracement line, and went above the first support at 679.25. Price has also gone above the Ichimoku cloud which indicates a bullish bias. Looking for price to continue bullish to hit the first resistance at 710.4 where the -27.2% Fibonacci expansion lies.
Alternative scenario: Alternatively, the price could bounce back down from the pivot structure and drop to first support to 679.25, where the 50% Fibonacci retracement line sits
Fundamentals: No major news.

ZC Potential for bearish momentumType : Bearish Drop
Resistance :681.75
Pivot: 688.00
Support : 668.25
Preferred Case: On the H4, with the price reflecting off the 61.8% Fibonacci retracement line and the price being inside ichimoku cloud, we have a neutral bias on corn. price could back to 668.25 where the previous swing low is.
Alternative scenario: Alternatively, price might go back up towards the pivot line at 688.00
Fundamentals: Top farming and food firms could lose up to a quarter of their value by 2030 if they do not adapt to new government policies and consumer behavior tied to climate change, United Nations-affiliated campaigners said in a new report. (Farm and food investors face $150 bln loss on climate change)

Inverse Head and Shoulders Price is above the neckline.
Possible stop below the neckline.
No recommendation

Commodity Corn idea (15/09/2022)corn
We expect a drop in corn grains in the coming period and the end of the rise in wave ((C)) of wave II and the beginning of the decline in wave III targeting. prices of 585 and the decline depend on the decisive point 699
