Corn | double bottom ending with pre-breakout buildup
US dollar seems weakening favour commodites
Corn has been a long down trend
now it formed a double bottom in 4H chart
and making a pre-breakout builup, which is quit bullish
adding RSI divergence
CORNU2025 trade ideas

COT - Corn - LongComments: 5 years in a row this pattern seems to play out very well. Top in may/june and drop there after.
Cot 3y: 80.1
Cot 6m: 100
Rsi: daily bullish divergence
Price: good multiyear low support
Entry: 331.3/4

Corn Futures - Area Chart Analysis - Monthly ViewHello everybody,
Here is my chart analysis for Corn Futures.
Monthly timeframe & long-term vision.
Since its historical top at 806'4 Corn is on a downtrend.
Its bearish potential is really interesting.
Nevertheless, 300'0 price level could be the next support.
Indeed, Corn has been drifted in a range area between 320'0 & 440'0 since July 2014.
If the actual price breaks this level, Corn could reach the 200'0 price level which has been hit several times.
Between August 1998 & October 2005 but before also, I just don't have more space to show you that in this publication.
However, Pay attention for a possible pullback on the 300'0 price level !
I hope you'll like it !
Follow me for Futures Chart Analysis !
Thanks & see you !


Corn in the REALLY short termAs shown in the diagram. ABC corrective waves at this moment. Patiently holding my longs.

CornOn the 4hr chart we have a nice entry, the close above the 21 ema. Looking for a nice rally to the upside.


Great PotentialPurchased a lot of corn on 305 level, as I mentioned in the previous post. TP400, SL 280. Will add more if corn can fall to 236 level.


THE WEEK AHEAD: SNAP, NFLX, IBM EARNINGS; /ZC, /CLEARNINGS:
IBM (63/54) announces Monday after market close.
SNAP (92/102) announces Tuesday after market close.
NFLX (66/70) announces Tuesday after market close.
EXCHANGE-TRADED FUNDS ORDERED BY IMPLIED VOLATILITY RANK/PERCENTILE SCREENED FOR RANK >50/IMPLIED >35%:
XLU (77/47)
GDXJ (77/84)
GDX (67/65)
SLV (66/45)
TQQQ (63/111)
USO (62/112)
XLE (59/70)
EWW (58/54)
EWZ (53/69)
XOP (59/91)
BROAD MARKET EXCHANGE-TRADED FUNDS ORDERED BY IMPLIED VOLATILITY RANK/PERCENTILE:
IWM (72/54)
QQQ (47/38)
SPY (45/28)
EFA (44/31)
EEM (41/36)
FUTURES ORDERED BY IMPLIED VOLATILITY RANK/PERCENTILE:
/ES (44/40)
/NQ (47/39)
/YM (51/13)
/RTY 72/53
/CL (62/130)
/NG (94/71)
/GC (67/27)
/SI (66/43)
/ZC (57/28)
/ZS (33/17)
/ZW (27/31)
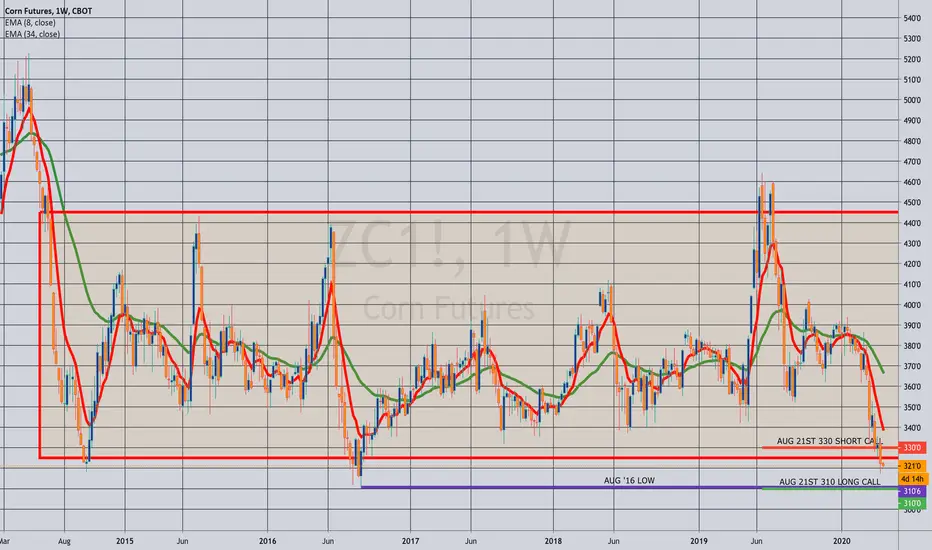
Notes: Pictured here is a /ZC August 21st 310/330 long call vertical, currently trading at 11.25 with a break even at 321.25 versus 321 spot. Ideally, you'd want to put this on with at least make one/risk one metrics, which would occur if the spread priced out at 10.00 even or below. /ZC is tantalizingly close to those August 2016 lows at 310 '06 ... .
Another future worth mentioning here: /CL. As I write this post, the May contract is currently trading at multi-year lows at 15.09, with the June contract trading at 23.66. May drops off this week with the question being how low the June contract will go. I continue to look to sell puts on weakness in the active contract at or below $20.
VIX/VIX DERIVATIVES:
VIX finished the week at 38.15 with the /VX term structure in backwardation.

Solid bottom Wow what a solid bottom. I think it won’t be a bad idea to start purchasing corns. Entry level will be at 318.2 and 305. I don’t really have a TP price for this. The potential looks huge.


CORN: bullish breakout on 4H timeframeA breakout of a descending straight line on 4H timeframe is about to occur on the corn and which is confirmed by an upward divergence on the MACD

CORN FUTURES (ZC1!) DailyDates in the future with the greatest probability for a price high or price low.
The Djinn Predictive Indicators are simple mathematical equations. Once an equation is given to Siri the algorithm provides the future price swing date. Djinn Indicators work on all charts, for any asset category and in all time frames. Occasionally a Djinn Predictive Indicator will miss its prediction date by one candlestick. If multiple Djinn prediction dates are missed and are plowed through by same color Henikin Ashi candles the asset is being "reset". The "reset" is complete when Henikin Ashi candles are back in sync with Djinn price high or low prediction dates.
One way the Djinn Indicator is used to enter and exit trades:
For best results trade in the direction of the trend.
The Linear Regression channel is used to determine trend direction. The Linear Regression is set at 2 -2 30.
When a green Henikin Ashi candle intersects with the linear regression upper deviation line (green line) and both indicators intersect with a Djinn prediction date a sell is triggered.
When a red Henikin Ashi candle intersects with the linear regression lower deviation line (red line) and both indicators intersect with a Djinn prediction date a buy is triggered.
This trading strategy works on daily, weekly and Monthly Djinn Predictive charts.
This is not trading advice. Trade at your own risk.

CORN FUTURES (ZC1!) WeeklyDates in the future with the greatest probability for a price high or price low.
The Djinn Predictive Indicators are simple mathematical equations. Once an equation is given to Siri the algorithm provides the future price swing date. Djinn Indicators work on all charts, for any asset category and in all time frames. Occasionally a Djinn Predictive Indicator will miss its prediction date by one candlestick. If multiple Djinn prediction dates are missed and are plowed through by same color Henikin Ashi candles the asset is being "reset". The "reset" is complete when Henikin Ashi candles are back in sync with Djinn price high or low prediction dates.
One way the Djinn Indicator is used to enter and exit trades:
For best results trade in the direction of the trend.
The Linear Regression channel is used to determine trend direction. The Linear Regression is set at 2 -2 30.
When a green Henikin Ashi candle intersects with the linear regression upper deviation line (green line) and both indicators intersect with a Djinn prediction date a sell is triggered.
When a red Henikin Ashi candle intersects with the linear regression lower deviation line (red line) and both indicators intersect with a Djinn prediction date a buy is triggered.
This trading strategy works on daily, weekly and Monthly Djinn Predictive charts.
This is not trading advice. Trade at your own risk.


CORN FUTURES (ZC1!) MonthlyDates in the future with the greatest probability for a price high or price low.
The Djinn Predictive Indicators are simple mathematical equations. Once an equation is given to Siri the algorithm provides the future price swing date. Djinn Indicators work on all charts, for any asset category and in all time frames. Occasionally a Djinn Predictive Indicator will miss its prediction date by one candlestick. If multiple Djinn prediction dates are missed and are plowed through by same color Henikin Ashi candles the asset is being "reset". The "reset" is complete when Henikin Ashi candles are back in sync with Djinn price high or low prediction dates.
One way the Djinn Indicator is used to enter and exit trades:
For best results trade in the direction of the trend.
The Linear Regression channel is used to determine trend direction. The Linear Regression is set at 2 -2 30.
When a green Henikin Ashi candle intersects with the linear regression upper deviation line (green line) and both indicators intersect with a Djinn prediction date a sell is triggered.
When a red Henikin Ashi candle intersects with the linear regression lower deviation line (red line) and both indicators intersect with a Djinn prediction date a buy is triggered.
This trading strategy works on daily, weekly and Monthly Djinn Predictive charts.
This is not trading advice. Trade at your own risk.


