We break this Line and Game on to 2011 HighsCorn plantings around the world are extremely behind schedule. As corn's plant by date passes prices will skyrocket. The red line is the range breakout area to go long for a parabolic move.
CORNU2025 trade ideas

Weather tradePurely a weather play, look for July corn to spike to 4.00 never fails during mid April early May

BULLISH DIVERGENCE MAY CORN two cases of clear bullish divergence here on the 60 min chart. new contract low was made during the last session.
I expect some short covering into the beginning of the week, a bounce off the lows signaled by the bullish divergence is possible. I could also see some further pressure occur until the bounce materializes
Everything here is purely my opinion, and in no way advice or recommendations on making trades. I may or may not hold positions in the instruments I analyze.


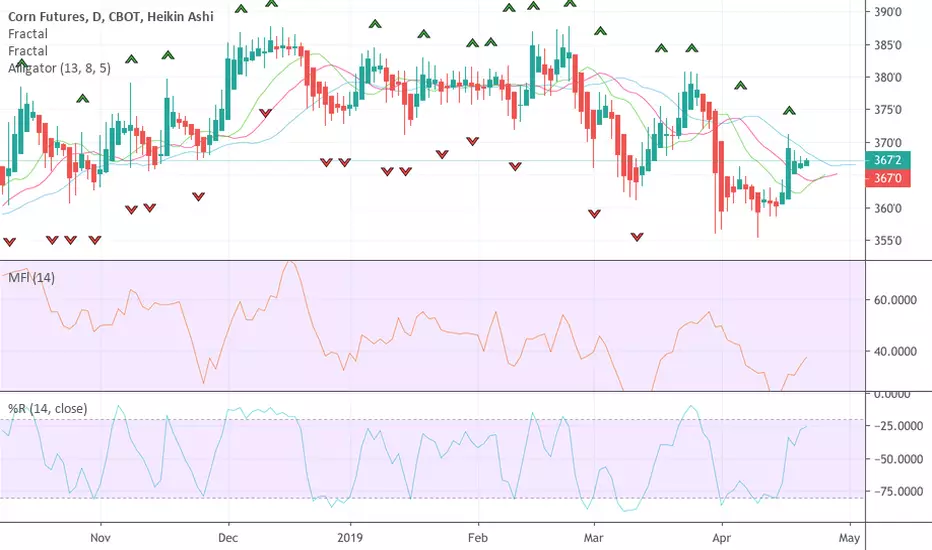
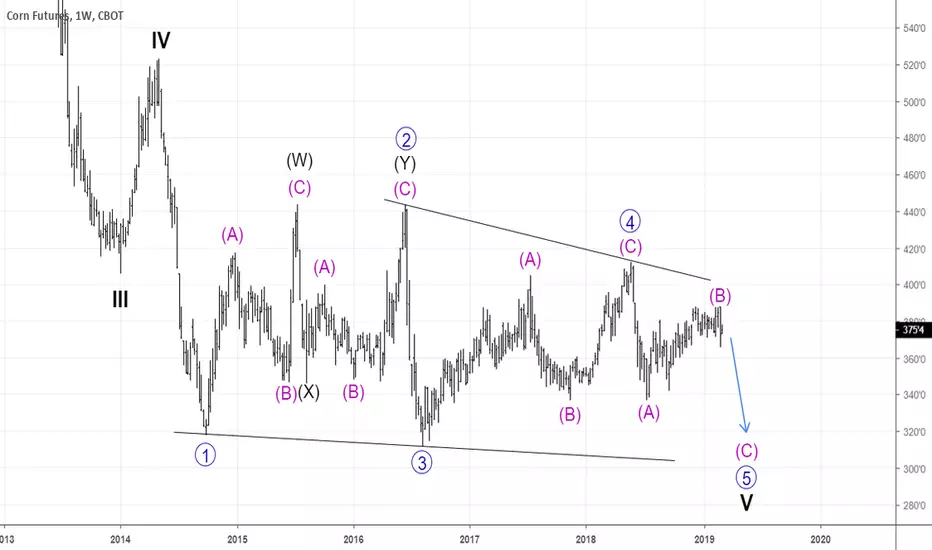
CORN DAILY CHART ANALYSISKey Level: 387’6
I’m working on the idea of triangle wave (B) complete and wave (C) is developing into 5 wave motive structure.
By using Elliot rule of “WAVE 2 never retrace 100% of wave 1”, we can establish an invalidation level that served as our key level of this analysis.
If wave (B) complete, corn has no business to go above 387’8 level and I’m looking forward to short with corn in wave 3.
Let’s see how corn market develop in the next coming days, week and month :D
Please leave a comment if you have any idea and suggestion to improve this corn analysis.
Happy trading

Corn Futures? A big question mark.What is going to happen with ag commodity futures in the coming months. Where are we going?
We are getting closer to the ever so important growing season in the United States, and ag futures have been stuck in a rut. Specifically corn.
February 8th, the USDA released another one of their important reports and traders saw a decrease in stocks/yield as well as other juicy information. Overall the report was nothing to get the market too excited. After the close us traders saw yesterday, it leaves me even more curious of where these futures are going to go.
From a chart prospective, we have seen strong congestion in corn futures. Looking at the chart here for CZ9 (dec 19), you can see a possible ascending triangle. I am not completely convinced.
I am torn fundamentally with the idea of larger acres coming and then throw in the size of the corn carry out, which is lower than we have seen in a while.
Off the cusp there are a few very interesting variables at play in the ag futures world. Throw in the continuing trade negotiations and every analyst prediction is radically altered.
For now it will be interesting to sit back and watch how this unfolds.
Comments always encouraged.
Everything here is purely my opinion, and in no way advice or recommendations on making trades. I may or may not hold positions in the instruments I analyze.
L.R.

LONG cornSoybean meal and soybeans are ripping after starting the day lower like corn with a nice dip. Nice place to enter with a tight stop loss

Week Plan: Bearish From 383'2Watching for weakness at the value area high at 383'2 with a target at the POC


#ZC_F $ZC_F #Corn – BEAR SPREADThe corn bear spread offers quite nice RRR 1:2. I have already entered at 4,0. My SL is set at 3,0 ($50/contract) and my PT at 6,0 ($100/contract).


#ZC_F $ZC_F #Corn – BEAR SPREADThis bear spread is quite cheap. I see a potential to grow to price 6,0. There is a strong S/R zone. Entry 4,0 / SL 3,0 ($50/contract) / PT 6,0 ($100/contract)

Time GuesstimateWe are watching a bearish movement based on the drive of the time target. Next could be a probable uptrend.

Time GuesstimateAfter a downtrend, we are watching a probable bullish movement based on the drive of the basic time target.

March Corn Bearish Gartley SetupMarch Corn has launched off of the lows at the end of a H&S fall and looks like it might be setting up for a bearish Gartley. Corn crossed over the 20 day MA and pivot and stayed above this at the end of the day and eyeing R1 at 386'7. Possible continued move to R2 at 392'2 depleting RSI. The R2 would be a triple top and might signify further upside. Significant resistance comes in at 398'1 though.


Corn: Moving sideways on 1W. Short.Corn has been practically neutral on 1W (RSI = 54.490, ADX = 23.173), trading sideways since mid July. With the price currently testing the inner 374'2 Resistance, we consider it to be high enough for a short towards the 0.618 1D Fibonacci = 356'6.


Corn forecast ZC1!Looks like a possible long setup for the short term, but beware of nearby resistance. Wait for confirmation.
Like this idea if you agree.
Follow me for more tips like this.

