March CornMarch Corn is creating a bullish flag today suggesting higher prices. Would be careful on this one as more chop would be in the offing for grains before Thursday's report. Next potential high is 366, 88.6% of the XA leg. If bulls can push it higher then the top of this market at 369. If the report on Thursday is bullish then the completion of the Butterfly at 372'4 and possible extension around 380 level.
CORNU2025 trade ideas

March CornMarch Corn still sees horizontal movement with creep upwards. Thursday is the USDA report for all grains, but the 2016 crop is still impacting this market. If USDA report shows a lowering of future crops, this may help corn. Also Funds may buy this week so support levels around 354'2 off the 3/1 Gann Fan may hold. If prices fall further look for 349 4/1 Gann Fan as next support.

CBoT cornCorn:
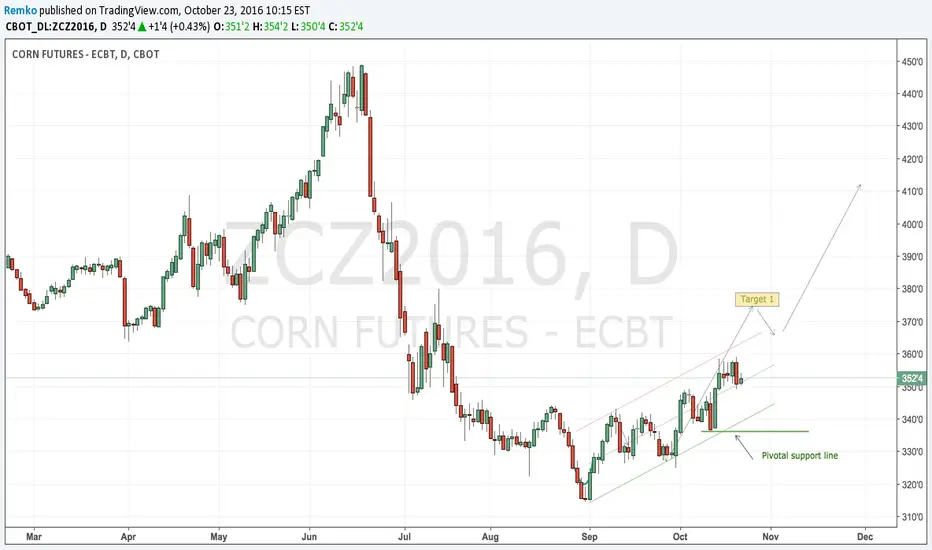
Price tried to but failed to kickstart the rally that we predicted a month ago but made a modest move down instead. Still, same move down was not impulsive and should rather be seen as an extended sideways move of the price. Price has been bumping into a heavy resistance zone that is positioned between, roughly, 362 and 268. We keep our bull scenario unchanged but have moved it a bit in time. We now are looking for another attempt of price to break the 362/368 resistance zone which then should serve as support and give price enough impulse to start trading towards our 420/440 target.

April Feeder Cattle Remains under 20 day moving averageApril Feeder Cattle fell a little further to stay under the 20 day moving average. We also have a rounding top suggesting further price action lower. Next possible price move to 123.25. Looking for 38.2 retracement. March Corn rose today. Looking for another day of up movement tomorrow to 360'6

CBoT CornCorn:
Price recently made some 'trap moves' which made us decide to step away from the market fro some time and let it play out. In meantime we see a clearer pattern being developed again which has resulted in a bull-flag-pattern. Same bull flag pattern has now the potential the unfold its last leg with the 375 level as first target by the end of December where price will meet resistance from the upper boundary of its current ascending price channel. The EW count suggests that pice has began its 3 of 3 wave which should give price support to trade substantia higher levels by the end of January or, possibly, mid February with 440 as second target.

Tough Going for CornMarch Corn faces a lot of resitance. Improved USDA sales results fight with high corn yields. Corn could also double top and trade back to 347 area. If bulls can push it through resistance at 365'6, it could continue to 375'2. Cypher inside a Butterfly shows a bearish Cypher and downtrend.


SHORT CORN WEEKLY I believe dec corn weekly is moving into a downward trend at least for the nearby due to a combination of technical and fundamental indicators.
MA's are nearing convergence and the Stoch RSI has already done so. MACD has begun its downward trend as well and RSI looks to be heading lower.
This week the USDA released another one of those great reports that they put together, and it was hardly bullish.
Record production and yield numbers (which was pegged at at 175.3!) were published and now the country could be looking at an ending stocks number to the tune of 2.4 billion or more, which is burdensome to say the least.
Until demand comes into play with any real significance, I am going to say this is a short for at least the nearby.
Looking to test the 3.22 support

Long Corn - Is there a Kernel of Truth? MACD has turned bullish coinciding with a potential break through resistance.

March 2017 Corn Up but heavy resistance followsCorn continues uptrend but will be met with downtrend resistance at next flight. If broken through will be met with resistance at 370. Double top reversal may occur and create choppy conditions. If it can break through both areas might see Butterfly completion to 402'6. There is a lot of corn on the market, so this would be a challenge for the bulls.

CBoT CornCorn:
Price did not break up through the 364/366 resistance line during last week as expected and traded only marginally higher during the week. We maintain our bias unchanged to be bullish with an important supportive level at 346 and a pivotal support at 336. We will have to go back to the drawing board if latter would be broken.

When bottoming or not yet?Wheat in a downtrend since 2012 and I think this is not the end, but, can be a turning point for a while...
Second target would a dream to hold Wheat long ETF for years :)


CBoT corn continued long play Corn:
Price mostly moved sideways during the past week but held well. The weekly candle (not attached/displayed) shows an almost perfect 'doji' which principally expresses doubt but we have no reason to believe that price will not continue its rally up and we keep our bull bias unchanged. Our pivotal supportive level remains unchanged at 336 for now.
The upper ascending line that starts at just below 364 on Monday and ends at 366 on Friday is expected to be broken during the coming week which will be the last confirmation that we need for our bull case scenario and after which we expect price to accelerate to the upside.
Our bottom line bias is up from here with essential support at 336.
CBoT corn long play carries onCorn:
Price is following our preferred path quite precisely an has confirmed our bull scenario during the past week. The pivotal support has been trailed up to 336 and as long as this low remains unbroken our bull scenario is valid.
Nothing else to add to that other than that our mid term outlook for this price is to reach 30% to 50% higher values during the Feb-May 2017 timeframe but that is still far away and we prefer to take it one step at the time.

Small pull back may be over- Ichimoku setup is neutral, with bullish bias in the forward Kumo
- Heikin-Ashi prints a doji candle today, haDelta may deliver a cross above its SMA3. Watch haDelta and haOscillator
- Support zone is still 335-338, while the key resistance is at 348. A break and close above 348 could open space for a larger bullish move.
- EWO is mild bullish
In last few days I had bid orders around 335-336. Unfortunately did not get a fill. -> here comes the mental excersise: buy higher? If yes, what's the highest level and the size that doesn't threaten a good risk/reward?
You have to enter trades like this with the worst case scenario: book the maximum possible loss on your trade in advance! :-) You must have a proper trade journal, and a sheet for your active trades, with all the realised and unrealised P/L numbers to measure all possible drawdowns of all positions.
Trading is not about winning, it is more about not losing too much at once! Trading is about risk management, and how you deal with individual and portfolio level risks/rewards.


CBoT corn keeps its bull scenarioCorn:
Price follows our preferred path reasonably well and we keep our bias unchanged to the upside. Price could extend the pullback that it started last Thursday a bit further early next week but is expect to resume its uptrend latest by Wednesday and possibly earlier. There is an ascending resistance trend line on the upside that starts at 356.5 and ends at 360 during the coming week which, if broken to the upside, will allow price to accelerate drastically. Nothing changes in our outlook, expectations and preferred path except that we have increased our pivotal support level to 325. If price would break that support we would have to reconsider our bull bias for this price and go back to our drawing board.

***Good Short Opp***Notes are on chart.
An aggressive play would be to take a shore futures position.
A conservative approach would be take a short call position.
17 Day $3.65 call option has a premium of $100/contract

ZC: Corn has a new potential uptrend signal hereLet's add to longs at market open, there's a chance a second 'Time at mode' signal confirms on close here. Move all stops to Sept. 12th's low, and open a 1% risk long, if we don't retest the new entry stop on close, we can expect a rally to 364'6 by or before October 25th.
We should see a strong rally from here, and at least 3-4% more upside, before a pause in it.
This is an example of the type of work we do with my signals group, so if you're interested in a free 1 week trial, message me.
Good luck,
Ivan Labrie.

CBOT Wheat - potential bouncePretty unclear chart.
Bounce expected short term
Strong resistance at 410

CBoT corn long Corn:
Price made indeed one more move down to the 325/330 zone from where it recovered last Friday with a 2% impulsive move to the upside. Nothing has changed in our outlook for this price. We keep our bias unchanged that a bottom is in the market and that price will trade up from here with 375 as first target. A break of the previous low on August 31 would negate our bias and would force us to go back to the drawing board.

Is Corn building a major bottom?If you followed my last trades via Twitter, I had some long Corn position from 329 average, which I closed when I saw Heikin Ashi exhaustion and reversal signal ard 340 +/- range top. It was a good decision, as price again dipped back to Kijun. Let's see the details as of today.
Weekly:
- Small change in Ichimoku setup. Still bearish, but as Tenkan dropped down to price after 9 weeks, by now Price is above Tenkan. Price is still far below Kijun Sen and forward Senkou B. (26 weeks as 52 weeks averages, which are at same level now: 376+)
- The whole picture looks like a 2 years wide range with 319 low, 425 high and 376 mid equilibrium. Unless bears get back into action and force a lower low on weekly close, longer term averages will not move any lower, they will stay around 376.
- MACD is very interesting. In case it crosses up, bears will not have enough power to push corn market lower, and then pull back to 360-376 could take place.
- Heikin-Ashi has some bearish bias this week, but haDelta and haOscillator are still stuck at zero.
Daily:
- Ichimoku is neutral, as price seem to hold above Kijun Sen again. Please note how low volatility is causing a Kumo compression: Forward Senkou A and B lines got very tight. A thinner Kumo ahead would be easier to break through.
- Heikin-Ashi ma signal a bullish reversal today. haDelta crossed up, haOscillator may follow if today we have an inside candle.
- EWO is neutral
- ATR has been very low. This also reflects lack of volatility. Commodites may trade sideaway with low volatility for some time, but once they decide to trade in direction, the moves are always sharp. This is why I like low volatility environments. My money management system always calculates with ATR when building a position. Lower ATR means more tradable contracts for one trade unit size, with still same nominal cash risk.
