ITA40 trade ideas

FTSE MIB elliot wave, target 14700we are in the wave 2 of 5 ( wave 5 of the bull market which began in 2009 ) on sp 500, it should go back at about 2000
14700 then 14200 on ftse mib, then it should go up at 19-20k for the next year following sp 500

SHORT FTSE-MIB (MIB)Still too many risks on the Italian Index; with the approach of the referendum it could suffer a sharp increase in volatility. Our medium- term targets remain unchanged. No economic growth, public debt continues to increase, and deficit is next to lose control. The situation of MPS and the overall banking sector could lead to widespread bail-in.

ITALIAN40 MIB INDEX DAILY LONG (REVERSAL)With the choppyness and slightdowntrend recently INDEX:MIB is going to see a bullish jump basic support and resistence along with the TL being broken shows a reversal (OVERSOLD). Price is well below the 50 and 20 EMA


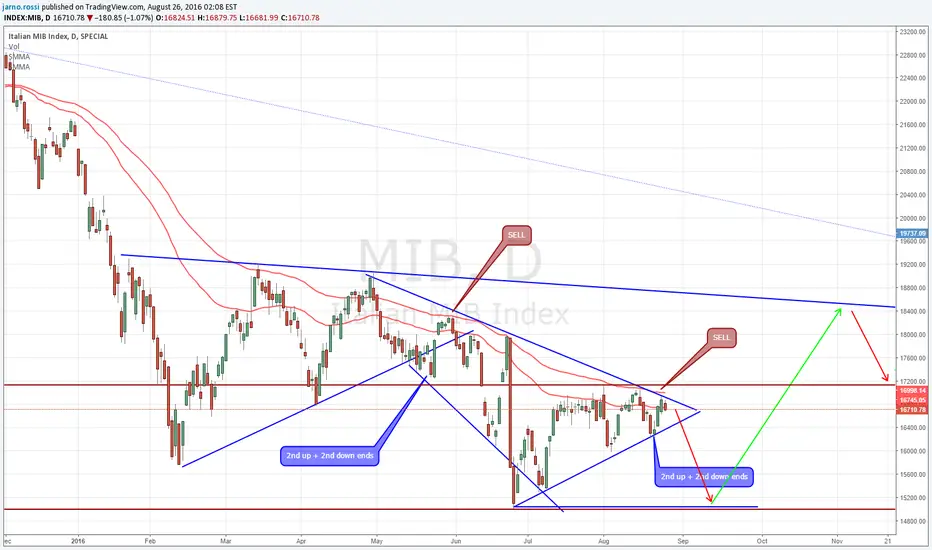
FTSE MIBThe attempt of passing the descresing trend line (dashed) is continuing and the end of the week will tell us the future of mib for the next weeks.


ITALIAN FTSE MIB SHORT SETUPIf you are looking for shorting opportunities on FTSE MIB sell the breakout. If the price breaks the black downward trendline with a strong impulse to the upside this setup is over. Bullish divergence on daily, more upside is possible.

$MIB Sees Limited Upside To 25013 Before Geo Completion | #euroFriends,
A confluence of technical hurdles is likely limiting any immediate upside potential in the Italian MIB Index, based on the following set of observations:
1 - ELLIOTT WAVE + GEO: In the most recent past (12-19 OCT 20009), price rallied to complete Elliott Wave's 4th wave, completing its corrective swing at 24558.00. This became a spring board from which bears plunged to 12296.00 on week of 23 JULY 2012 - This nadir defined the completion of a full bearish Elliott Wave impulsive swing at its 5th wave, as well as plotted the Geo's Point-2. As price rallied correctively from that level, it crunched the most recent price action into a narrow range from which to spring into that prior 24558.00 support-turned-resistance level.
2 - RECIPROCAL AB = CD SYMMETRY: As price unfolds into a correction, internal analysis of recent price action at this weekly scale reveals that a geometric projection could carry price to or slightly above the vicinity of the historical structural 24558.00 level. This geometry does not occur over the entire length of the recent corrective upswing, but structural analysis of lows vs. highs allow for a fair projection via an internal ab = cd pattern.
3 - PREDICTIVE/FORECASTING MODEL: As a stand-alone method, the Predictive/Forecasting Model has defined a high-probability resistance level defined as:
- TG-Hi = 25013.54 - 12 AUG 2015
This represents a qualitative target which is most able to impose a reversal event. In the context of above technical events, this adds credence to the probability of resistance and retracement as mentioned, with the 1-5' Line acting as an additional back-stop to a probable rallying into these targets.
OVERALL:
Technical analysis combined with predictive/forecasting model favor a limited upside potential to a narrow 24558.00/25013.54 range. A background Geo adds further weight through its geometry, raising the expectation of a retracement to a price level (18031.76 to 17555.77), corresponding to Point-4, as set by the Geo's Off-Set Rule.
Best,
David Alcindor
Predictive Analysis & Forecasting
Durango, Colorado - USA
-----
Twitter:
@4xForecaster
LinkedIn:
David Alcindor
-----
.


Montly view of the FTSE MIB INDEX As we can see, according to the E.waves theory, the Index is now finishing to complete the second wave of the third wave of the macro waves structure. For this reason i'm waiting for a buy opportunity when, in the lower time frame, i will see the right pattern/structure/wave formation that confirm this movement.
I'm going to look for this type of entry until the Index remain upside the start of the 1st wave as i've painted in the chart, otherwise this view will be wrong.
Entry: Between 15000/14000
stop loss: 12000
1 target : 24000
2 target : 30000
3 target : the sky

SHORT THE FTSE-MIB (MIB) We continue to believe that the situation is not resolved, especially in the financial sector. Our latest analysis of Unicredit, Intesa and the FTSE - Mib index were a success. The problems in the banking sector continue to be very serious, and even the Summit on 29 June in Brussels between Italy, France and Germany did not bring anything good. In addition, the Italian banks after paying big dividends in May, are now to have a shortage of capital, quantified in 40 billion euro.
Finally ottorbe to be held on referendum to the electoral law, which will be a referendum on the work of Renzi.
So the first target is 14.900 and then 12.600.


Index of Italian Market (MIB) created a downtrend before BREXITMIB shows signs of a downtrend (again). Around 17300 we expect a rezistance with higher volatility due to BREXIT.
INDEX:MIB [/symbol
MIB is mainly driven by low-quality titles from the bank sector.
We expect reaction to the downside with quite interesting RRR of almost 3.
More you can find and learn free on UncleTrader.com .


FTSE- Mib (MIB)If it was confirmed the break of support at 17.430 would open its doors to around 16,000 points, finding a first target in 16.799 area, like first target and then 15.920.
The italian economic growth prospects are not favorable. The total public debt continues to increase and tensions within the euro0.04% zone could be harbingers of negative cues in the markets. Consider that in the coming days we will have this calendar:
June 14 Fed rate decision
June 17 Three witches
June 23 Brexit
June 26 Elections in Spain

What's next?maybe we are going to close the triangle, but the mood is too flat and candles are looking at the 16k...

SHORT FTSE-Mib (MIB)The FTSE-Mib index is next to test the dynamic resistance, passing though the resistance that are currently in 18350 and 18530 area. In my opinion, the index could groped a new attack towards 19000 area (only if passing the 18.530 area), which if exceeded this time could encourage a further blow to the kidneys to the important static resistance area at 19350. Conversely, if it was confirmed the break of support at 17430 would open its doors to around 16,000 points, finding a first target in 16.799 area.
The italian economic growth prospects are not favorable. The total public debt continues to increase and tensions within the euro zone could be harbingers of negative cues in the markets. Consider that in the coming days we will have this calendar:
June 14 Fed rate decision
June 17 Three witches
June 23 Brexit
June 26 Elections in Spain


Short the FTSE-MibThe Italian index is composed for the most part by banks; the whole industry is in the spotlight because of the shaky situation. The fund Atlas ( Fondo Atlante) does not seem to be enough to stanch a situation that seems to be far more serious than previously indicated. Finally we want to emphasize that Italy's public debt continued to rise despite the negative rates, a sign that the recovery is not sufficient.

FTSE MIB 1W SHORTMAIN: SELL @18.000 TARGET: 15.850/14.650 STOP: 18.250
(test of support @17.500 with limited reaction upside then violation of the support downwards)
ALTERNATIVE: BUY @17.500 TARGET: 19.200/20.100
(support @17.500 holds and triangle formation continues upwards)

FTSE MIBprimary trend bullish support area 18250 and 23790 resistance area in the medium term support of 20500 has held up very well to the bottom and in the last two weeks we are witnessing a clear direction currently bullish closing price volatility there last 2 weeks that too low not by a clear direction
