NIKKEI: Strong Bullish Momentum Driven by Favorable IndicatorsData analysis indicates a "Bullish" bias for the NIKKEI, with a strong overall score. This positive outlook is supported by a confluence of factors, including Commitments of Traders (COT) data, retail positioning, seasonality, and trend. While some economic data points show neutrality or slight negativity, the overriding sentiment and key technical factors suggest a continued upward trajectory for the NIKKEI.
Key Supporting Factors (Bullish):
Strong Technicals/Momentum: The "Trend" and "Seasonality" scores of 2 each suggest strong underlying bullish momentum and favorable seasonal patterns for the NIKKEI.
COT & Retail Positioning: Positive scores in "COT" and "Retail Pos" (both 2) often indicate that institutional money and retail traders are aligned in a bullish direction, providing a strong foundation for upward movement.
GDP, SPMI, Retail Sales: These economic indicators, with scores of 1, are contributing positively to the overall bullish bias, indicating healthy economic activity.
JP225 trade ideas

Nikkei primary trend remains bullish.NIK225 - 24h expiry
Price action continues to trade around significant highs.
The primary trend remains bullish.
20 1day EMA is at 40385.
We look for a temporary move lower.
Dip buying offers good risk/reward.
We look to Buy at 40405 (stop at 40105)
Our profit targets will be 41305 and 41455
Resistance: 40895 / 41043 / 41315
Support: 40635 / 40375 / 40000
Risk Disclaimer
The trade ideas beyond this page are for informational purposes only and do not constitute investment advice or a solicitation to trade. This information is provided by Signal Centre, a third-party unaffiliated with OANDA, and is intended for general circulation only. OANDA does not guarantee the accuracy of this information and assumes no responsibilities for the information provided by the third party. The information does not take into account the specific investment objectives, financial situation, or particular needs of any particular person. You should take into account your specific investment objectives, financial situation, and particular needs before making a commitment to trade, including seeking, under a separate engagement, as you deem fit.
You accept that you assume all risks in independently viewing the contents and selecting a chosen strategy.
Where the research is distributed in Singapore to a person who is not an Accredited Investor, Expert Investor or an Institutional Investor, Oanda Asia Pacific Pte Ltd (“OAP“) accepts legal responsibility for the contents of the report to such persons only to the extent required by law. Singapore customers should contact OAP at 6579 8289 for matters arising from, or in connection with, the information/research distributed.

Nikkei Near ATHs One Year After Its Steepest Drop in 3 decadesNikkei Nears Historic Highs One Year After Its Steepest Drop in Three Decades
Ion Jauregui – Analyst at ActivTrades
The Nikkei 225 enters August trading above 41,500 points, approaching its all-time highs after recovering 26% from the lows recorded one year ago. In August 2024, the Japanese benchmark suffered its sharpest monthly drop in over 35 years, falling 12.4% due to domestic political uncertainty, global inflationary pressures, and tightening international monetary policy.
Twelve months later, the landscape has changed significantly. The resignation of the Japanese Prime Minister and the announcement of a new trade agreement between Japan and the United States have served as catalysts for a solid recovery that has restored investor confidence in Japanese financial markets.
Political Stability and External Momentum
The Prime Minister’s resignation, following the ruling coalition’s defeat in the Upper House elections, has reshaped the political scenario and paved the way for a new phase of moderate reforms. Simultaneously, U.S. President Donald Trump’s announcement of a 15% tariff on Japanese imports—including automobiles—has been interpreted by investors as a negotiated outcome that reduces the risk of a trade escalation.
Japan’s concessions to the U.S. can be seen as a means of avoiding a more significant conflict without committing to deep structural reforms. This has restored confidence not only in the Nikkei but also across Asian markets, albeit with renewed uncertainty this week.
Valuation and Outlook
According to Bloomberg's consensus forecasts, the index has a 12-month upside potential of 9%, with a target valuation around 45,133 points—above its previous historical high. However, only 48% of the companies in the index carry a buy recommendation, indicating the need for selective investment.
Companies such as Fujikura, IHI, Ryohin Keikaku, and Japan Steel Works have tripled their share prices since the August 2024 lows. Meanwhile, the automotive sector has seen sharp rebounds, with Subaru and Toyota posting gains above 15% in a single session following the trade agreement announcement.
Bond Market and Yen Pressures
The bond market’s reaction has been more cautious. Yields on Japanese government bonds have risen across the curve, with the 10-year JGB reaching 1.59%—its highest level in a decade. This reflects market expectations that the Bank of Japan may be forced to raise interest rates before year-end to offset fiscal pressures stemming from Japan’s new external investment commitments.
The yen is also under pressure following reports that Japan could invest up to $550 billion in U.S. infrastructure, potentially triggering capital outflows. This may affect the return of capital flows into Japan and influence index performance, particularly as the USD/JPY pair (nicknamed “Doruyen” in Japan) becomes increasingly relevant to carry-trade dynamics.
Technical Analysis
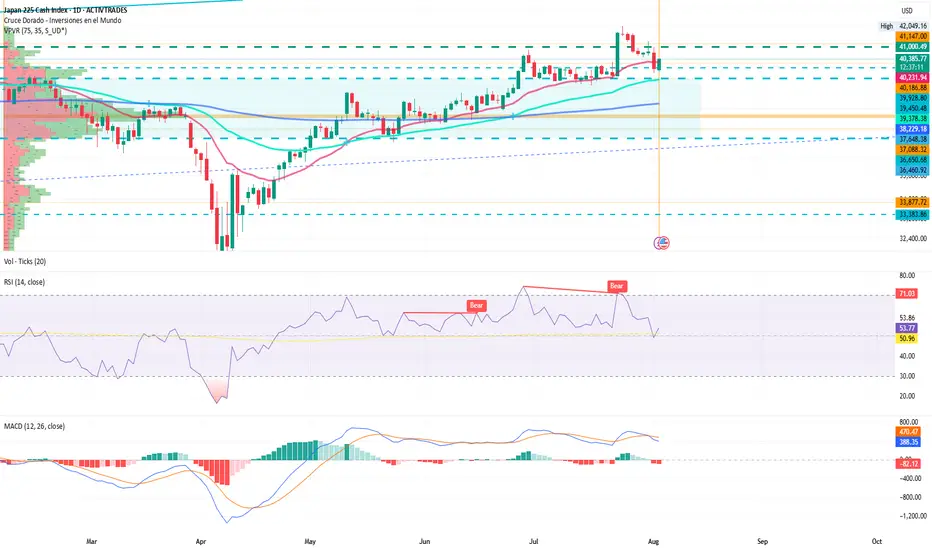
Asian trading began with a rebound from 39,727.15 points, extending gains into the European session and reaching 40,319.32 points. Technically, the index maintains a short-term bullish structure, though some indicators are beginning to show signs of momentum exhaustion.
In hourly charts, a notable technical signal has emerged: the 200-period moving average has crossed above the 100-period MA, an unusual move that may indicate a forthcoming pullback rather than continued short-term upside. This death cross, contrary to the classic golden cross pattern, although not visible yet on daily charts, suggests a phase of consolidation or correction in the coming sessions.
The RSI remains neutral at 53.41, showing no immediate signs of overbought or oversold conditions. Meanwhile, the MACD is trending downward, indicating growing bearish pressure.
Should this pressure materialize, key support levels are found near the point of control at 37,652, with further downside potential toward 36,658, where prior resistance may now serve as support. On the upside, a decisive break above 42,049.16 points would open the door to new record highs, reinforcing the long-term bullish trend established in 2024.
A Cautious Macro Environment
The Nikkei 225 has staged a remarkable recovery over the past year, driven by improvements in domestic politics and reduced trade tensions with the U.S. Nevertheless, structural risks remain—rising bond yields, a weaker yen, and major fiscal commitments could challenge both monetary policy and Japan’s economic competitiveness.
From a technical perspective, the index is nearing critical levels with mixed signals. While the underlying trend remains positive, the market could face short-term consolidation or correction, especially if pressure on the yen continues and the Bank of Japan signals policy tightening.
The Nikkei's performance for the remainder of 2025 will largely depend on the central bank’s response, global capital flows, and the stability of international trade relations. In this context, selective investment and disciplined technical analysis will be essential to identify opportunities without incurring excessive risk.
*******************************************************************************************
The information provided does not constitute investment research. The material has not been prepared in accordance with the legal requirements designed to promote the independence of investment research and such should be considered a marketing communication.
All information has been prepared by ActivTrades ("AT"). The information does not contain a record of AT's prices, or an offer of or solicitation for a transaction in any financial instrument. No representation or warranty is given as to the accuracy or completeness of this information.
Any material provided does not have regard to the specific investment objective and financial situation of any person who may receive it. Past performance and forecasting are not a synonym of a reliable indicator of future performance. AT provides an execution-only service. Consequently, any person acting on the information provided does so at their own risk. Political risk is unpredictable. Central bank actions can vary. Platform tools do not guarantee success.
Trading breakouts in summer: Japan’s index pushes higherSummer breakouts are tricky with low market participation, but Japan’s stock index just cleared a major level. Whether it’s a rectangle or inverse head and shoulders, the breakout looks valid. We explore how to manage risk, trim stop losses, and aim for a solid reward ratio. Will this push continue?
This content is not directed to residents of the EU or UK. Any opinions, news, research, analyses, prices or other information contained on this website is provided as general market commentary and does not constitute investment advice. ThinkMarkets will not accept liability for any loss or damage including, without limitation, to any loss of profit which may arise directly or indirectly from use of or reliance on such information.

JP225 NIKKEI225JP225 (Nikkei 225) Iis down by few popints and This recent downturn has been driven by global concerns, especially U.S. tariff escalations, a weaker-than-expected U.S. jobs report, and caution ahead of Bank of Japan policy updates. Major Japanese sectors such as technology, financials, and industrials have seen notable declines.
Despite this short-term dip, the index remains up about 2.5% in the past month and nearly 29% over the past year, reflecting powerful momentum in Japanese equities for 2025. The most recent all-time high was near 42,438 (July 2024), and the index is still trading near historic highs.
Technical and Market Drivers
Recent Volatility: Linked to external (U.S. tariffs, global growth) and internal (BOJ policy, earnings) factors.
Sector Weakness: Tech stocks (e.g., Advantest), financials (Mitsubishi UFJ), and heavyweight exporters (Toyota, Hitachi) have led the latest decline.
Sentiment: Investors are awaiting key signals from the Bank of Japan and further clarity on global trade and monetary policy developments.
Future Outlook for Nikkei 225
Short-Term:
The near-term outlook remains cautious. Analysts and forecasters expect the JP225 could see continued volatility, potentially testing support near 39,000–40,000, especially if global risk sentiment remains weak or BOJ signals tighter policy. However, the underlying fundamental backdrop—strong Japanese corporate earnings, robust foreign investment inflows, and yen weakness supporting exporters—still lends medium-term support.
Medium- and Long-Term:
Forecasts for End-2025: Consensus among strategists suggests potential for new highs by year-end. Some projections see the index reaching 44,000–45,400 or higher, especially if global and regional macroeconomic conditions stabilize and earnings growth persists.
Risks and Catalysts:
Global risk: Further U.S. tariff escalation, slowing global growth, or a sharp downturn in tech could weigh heavily.
Domestic support: Positive corporate governance reforms, sustained share buybacks, tax cut proposals, and improved domestic consumption are likely to underpin strength.
BOJ Policy: Changes in Bank of Japan monetary settings are a key source of both risk and potential upside; continued loose policy would be bullish, while unexpected tightening could trigger corrections.
#jp225 #japan #stocks

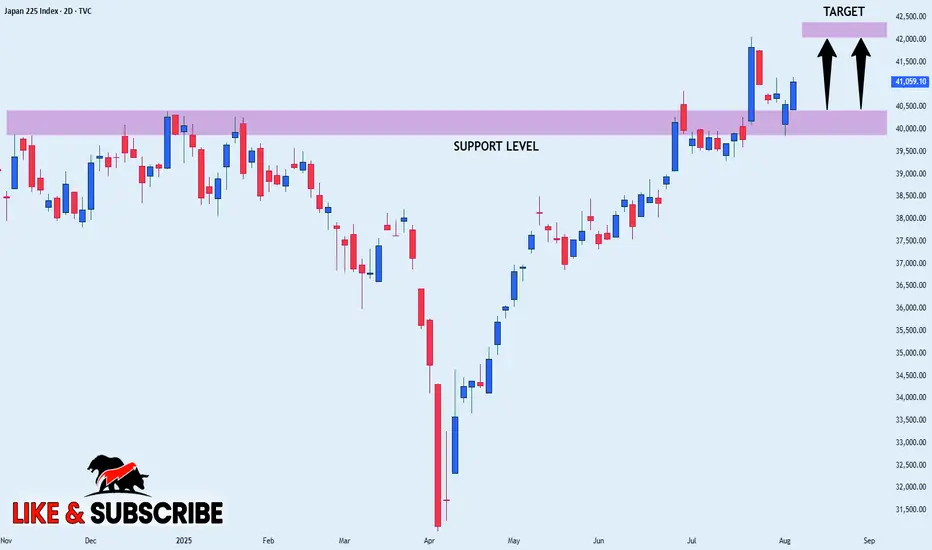
Japan 225 Unwind Pauses at Known SupportThe Japan 225 contract has spent the past three sessions partially unwinding the sharp rally sparked by Japan’s trade agreement with the United States last week, leaving price resting on a known support level. Near-term price action may determine whether bullish or bearish setups hold the upper hand.
If price holds 40162, longs could be established above with a stop beneath for protection, targeting a move back to last week’s high of 42070. Alternatively, a break and hold beneath 40162 would flip the setup, allowing shorts to be established below with a stop above for protection. Uptrend support sits today at 40000, making that an obvious target.
Momentum indicators remain mildly bullish despite the pullback, favouring upside over downside. However, with this setup, price action should carry more weight.
Good luck!
DS
Nikkei 225 Wave Analysis – 29 July 2025- Nikkei 225 reversed from the resistance zone
- Likely fall to support level 40000.00
Nikkei 225 index recently reversed from the resistance zone between the resistance levels 42000.00 (which started the sharp sell-off in 2024) and 41285.00.
This resistance zone was further strengthened by the upper daily and the weekly Bollinger Bands.
Given the strength of the aforementioned resistance zone and the overbought weekly Stochastic, Nikkei 225 index can be expected to fall to the next round support level 40000.00.

JP225 Long Trap or Bull Escape? Heist in Motion.🦹♂️🎯 JP225 Ninja Heist: Breakout Loot Plan 💥💰 (Long Game Playbook)
🌟Hi! Hola! Ola! Bonjour! Hallo! Assallamu Allaikum!🌟
Dear Money Makers, Market Raiders & Silent Robbers, 🤑💰💸✈️
It’s time to gear up for the ultimate breakout heist on the JP225 / NIKKEI Index CFD Market. Based on my 🔥Thief Trading style🔥—a mix of slick technical strategy and deep fundamental recon—this operation is primed for a bullish break-in.
🧠 Plan of Attack:
Our team is targeting a long-side entry only, aiming to loot the market before it hits the Electric Trap Resistance Zone ⚡—a known danger zone where big bears lie in wait. Let’s outsmart them!
🚪 Entry Plan – The Door to Gold
📈 "The heist is on once we crack that resistance vault!"
📍Trigger: Wait for candle close above 40,100 – that's your breakout cue.
🧲Pullback Setup: Place Buy Limit near recent swing low on the 15/30 min timeframe, or stack multiple DCA-style orders to scale in silently.
🔔 Don’t forget to set alerts—you snooze, you lose.
🛡️ Stop Loss – Don’t Get Caught
🛑 "Keep your escape plan ready, always!"
📍Preferred SL: Recent swing low on 4H timeframe @ 39,500
🎯 Adjust based on your risk level and lot sizing.
🧠 Smart robbers move stop loss only after breakout confirmation—don’t let hesitation cost you your cut.
🎯 Profit Target – Secure the Bag
🏴☠️ Escape Plan: Aim for 41,200 or bail early if the scene gets messy.
Use trailing SLs to protect your stash.
Scalpers, only play long side. Let the swing traders set the traps while you slice the pie.
📊 Why This Trade Works:
JP225 is currently fueled by:
🔼 Strong bullish momentum
🔍 Technical breakout setup
💹 Fundamental backdrop: macro trends, institutional flow, COT report, and global sentiment lining up like guards on break
🗞️ Want more intel? Check out the broaderr macroeconomic, sentiment, and positioning insights 🔗🔗🔗
⚠️ Risk Management Alert:
📰 During news hours, don’t act greedy.
❌ Avoid entries near big news drops.
✅ Use trailing SLs to protect profits from volatility whiplash.
❤️ Robbery Crew Boost Request
💥Hit that Boost if this plan helps you grab the market loot!
Let’s grow our Thief Trading Army together—every trader deserves a smooth escape and a fat wallet 🏆💪💸
📌 Disclaimer: This is not financial advice. Just a masterplan from a fellow market raider. Adapt your risk and strategy based on your own style. Markets can flip faster than you can say “bank run”—stay updated, stay sharp, and stay stealthy. 🕶️
🎭 See you at the next heist.

NI225: Move Down Expected! Short!
My dear friends,
Today we will analyse NI225 together☺️
The recent price action suggests a shift in mid-term momentum. A break below the current local range around 41,456.23 will confirm the new direction downwards with the target being the next key level of 40,954.70 and a reconvened placement of a stop-loss beyond the range.
❤️Sending you lots of Love and Hugs❤️

JPN225 H4 | Bearish reversalJapan 225 Index (JPN225) is reacting off the sell entry which acts as a swing high resistance and could reverse from this level oculd indicating a double top pattern which might lead to a potential price drop to the take profit.
Sell entry is at 42,043.92, which is a swing high resistance.
Stop loss is at 42,794.15, which aligns with the 127.2% Fibonacci extension and the 100% Fibonacci projection.
Take profit is at 41,269.97, which is a pullback support.
High Risk Investment Warning
Trading Forex/CFDs on margin carries a high level of risk and may not be suitable for all investors. Leverage can work against you.
Stratos Markets Limited (tradu.com ):
CFDs are complex instruments and come with a high risk of losing money rapidly due to leverage. 65% of retail investor accounts lose money when trading CFDs with this provider. You should consider whether you understand how CFDs work and whether you can afford to take the high risk of losing your money.
Stratos Europe Ltd (tradu.com ):
CFDs are complex instruments and come with a high risk of losing money rapidly due to leverage. 66% of retail investor accounts lose money when trading CFDs with this provider. You should consider whether you understand how CFDs work and whether you can afford to take the high risk of losing your money.
Stratos Global LLC (tradu.com ):
Losses can exceed deposits.
Please be advised that the information presented on TradingView is provided to Tradu (‘Company’, ‘we’) by a third-party provider (‘TFA Global Pte Ltd’). Please be reminded that you are solely responsible for the trading decisions on your account. There is a very high degree of risk involved in trading. Any information and/or content is intended entirely for research, educational and informational purposes only and does not constitute investment or consultation advice or investment strategy. The information is not tailored to the investment needs of any specific person and therefore does not involve a consideration of any of the investment objectives, financial situation or needs of any viewer that may receive it. Kindly also note that past performance is not a reliable indicator of future results. Actual results may differ materially from those anticipated in forward-looking or past performance statements. We assume no liability as to the accuracy or completeness of any of the information and/or content provided herein and the Company cannot be held responsible for any omission, mistake nor for any loss or damage including without limitation to any loss of profit which may arise from reliance on any information supplied by TFA Global Pte Ltd.
The speaker(s) is neither an employee, agent nor representative of Tradu and is therefore acting independently. The opinions given are their own, constitute general market commentary, and do not constitute the opinion or advice of Tradu or any form of personal or investment advice. Tradu neither endorses nor guarantees offerings of third-party speakers, nor is Tradu responsible for the content, veracity or opinions of third-party speakers, presenters or participants.

NIKKEI WILL KEEP GROWING|LONG|
✅NIKKEI is trading in an uptrend
And the index was making a bearish correction
But it has now retested a horizontal support level of 40,500
From where we are already seeing a bullish
Reaction and I am expecting the index to go further up
LONG🚀
✅Like and subscribe to never miss a new idea!✅
Nikkei 225 D1 | Strong upward momentumThe Nikkei 225 (JPN225) is falling towards a pullback support and could potentially bounce off this level to climb higher.
Buy entry is at 40,670.02 which is a pullback support that aligns with the 23.6% Fibonacci retracement.
Stop loss is at 39,100.00 which is a level that lies underneath an overlap support and the 23.6% and 50% Fibonacci retracements.
Take profit is at 42,550.16 which is a swing-high resistance.
High Risk Investment Warning
Trading Forex/CFDs on margin carries a high level of risk and may not be suitable for all investors. Leverage can work against you.
Stratos Markets Limited (tradu.com ):
CFDs are complex instruments and come with a high risk of losing money rapidly due to leverage. 66% of retail investor accounts lose money when trading CFDs with this provider. You should consider whether you understand how CFDs work and whether you can afford to take the high risk of losing your money.
Stratos Europe Ltd (tradu.com ):
CFDs are complex instruments and come with a high risk of losing money rapidly due to leverage. 66% of retail investor accounts lose money when trading CFDs with this provider. You should consider whether you understand how CFDs work and whether you can afford to take the high risk of losing your money.
Stratos Global LLC (tradu.com ):
Losses can exceed deposits.
Please be advised that the information presented on TradingView is provided to Tradu (‘Company’, ‘we’) by a third-party provider (‘TFA Global Pte Ltd’). Please be reminded that you are solely responsible for the trading decisions on your account. There is a very high degree of risk involved in trading. Any information and/or content is intended entirely for research, educational and informational purposes only and does not constitute investment or consultation advice or investment strategy. The information is not tailored to the investment needs of any specific person and therefore does not involve a consideration of any of the investment objectives, financial situation or needs of any viewer that may receive it. Kindly also note that past performance is not a reliable indicator of future results. Actual results may differ materially from those anticipated in forward-looking or past performance statements. We assume no liability as to the accuracy or completeness of any of the information and/or content provided herein and the Company cannot be held responsible for any omission, mistake nor for any loss or damage including without limitation to any loss of profit which may arise from reliance on any information supplied by TFA Global Pte Ltd.
The speaker(s) is neither an employee, agent nor representative of Tradu and is therefore acting independently. The opinions given are their own, constitute general market commentary, and do not constitute the opinion or advice of Tradu or any form of personal or investment advice. Tradu neither endorses nor guarantees offerings of third-party speakers, nor is Tradu responsible for the content, veracity or opinions of third-party speakers, presenters or participants.

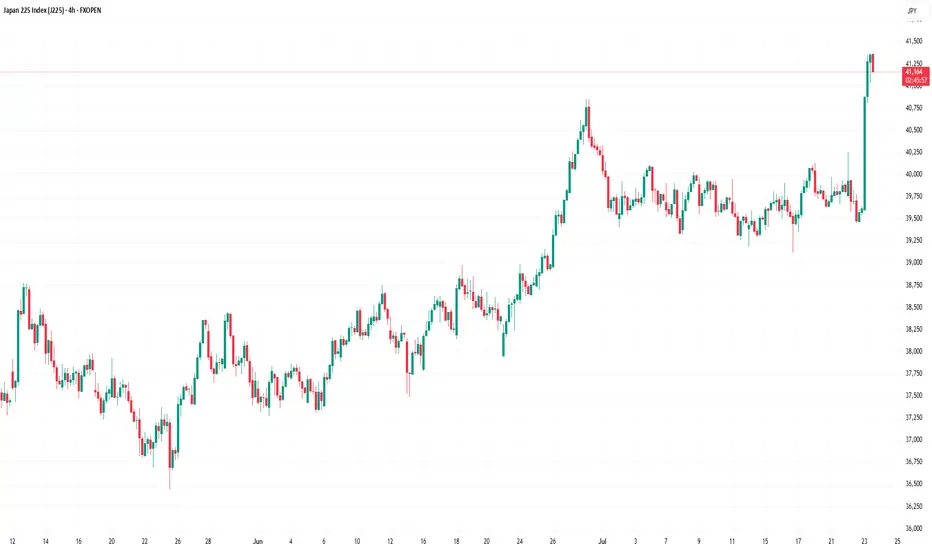
Nikkei 225 Index Surges Above 41,000 PointsNikkei 225 Index Surges Above 41,000 Points
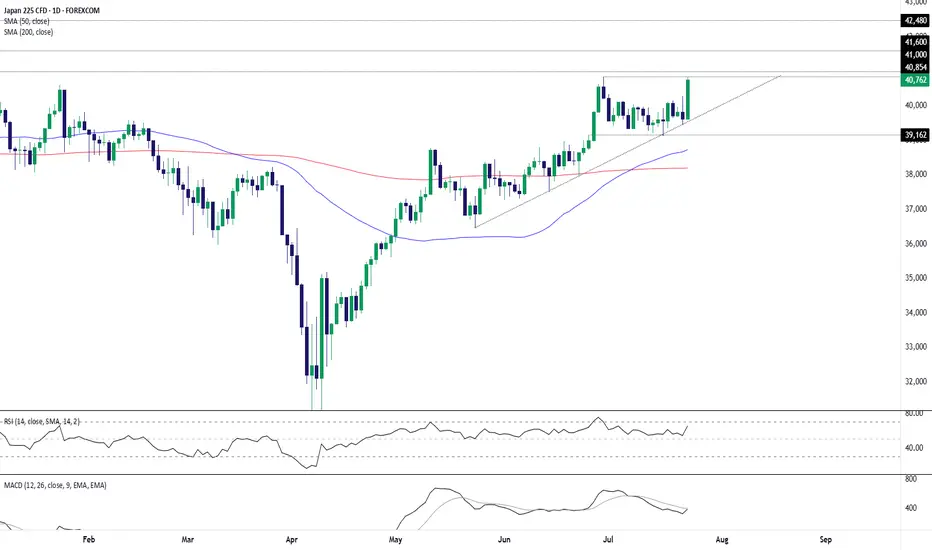
As the chart indicates, the value of the Nikkei 225 stock index has risen above the 41,000-point level — its highest mark since July 2024.
The primary bullish driver is the conclusion of a trade agreement between the United States and Japan. According to media reports, the deal will involve Japan paying a 15% duty on exports to the US, down from the previous 25% tariff. Shares of automotive companies are among the top gainers on the Japanese stock market.
European stock indices have also risen, as EU officials are scheduled to visit Washington on Wednesday, raising hopes for a potential US-EU trade agreement.
Technical Analysis of the Nikkei 225 Chart
Approximately a month ago, we outlined an ascending channel based on the price fluctuations observed in 2025. This formation remains relevant, and:
→ The price has moved into the upper half of the channel, suggesting that the median line may act as a support level going forward.
→ The nature of the latest price action is worth noting: as an immediate reaction to the news of the deal, two long bullish candles formed on the chart. However, once the price reached its 2025 high, upward momentum slowed sharply.
→ The RSI indicator signals overbought conditions.
Thus, it is reasonable to assume that, following an approximate 3.6% surge over an eight-hour period, the bullish momentum may have largely been exhausted. Nikkei 225 (Japan 225 on FXOpen) could now be vulnerable to a pullback, potentially towards the median line. Nonetheless, the ultimate direction will be shaped primarily by fundamental news.
This article represents the opinion of the Companies operating under the FXOpen brand only. It is not to be construed as an offer, solicitation, or recommendation with respect to products and services provided by the Companies operating under the FXOpen brand, nor is it to be considered financial advice.
Japan 225: Breakout Watch as Tariff Cut Fuels RallyThe Japan 225 contract is ripping higher today on a trade deal being reached between the U.S. and Japan, including the apparent lowering of auto tariffs to 15%.
The price has already bounced strongly from uptrend support established in May, putting a potential retest of the June 30 high of 40854 on the cards. With momentum indicators perking up—pointing to building bullish momentum—the case for a topside break is improving.
If the price can break and hold above the June 30 high, watch for a potential run towards 41000—a level that saw plenty of action back in 2024. It looms as a decent level to build setups around.
If the price breaks and holds above 41000, consider establishing longs with a tight stop beneath the level for protection. 41600 and 42480 screen as potential targets, depending on desired risk-reward.
While the setup could be flipped if the price stalls beneath 41000, just how much downside would be forthcoming given the current mood is questionable.
Good luck!
DS
NIKKEI Buy Plan — ATH Breakout Incoming!🚀 NIKKEI Buy Plan — ATH Breakout Incoming!
Buyers should stay alert and confident — NIKKEI is not just aiming to break its previous all-time high, it's preparing to print a brand new one. The recent price action shows strong bullish continuation, supported by:
✅ Weekly Fair Value Gap respected and driving upward
✅ Monthly FVG served as solid foundation
✅ No sign of rejection candles, just healthy retracements
✅ Liquidity magnets overhead are pulling price aggressively
Expect big bullish candles to form soon as price targets external liquidity.
Momentum is on buyers’ side — new ATH is not a matter of "if", but "when"!

Nikkei 225 Wave Analysis – 17 July 2025
- Nikkei 225 reversed from support area
- Likely to rise to resistance level 40550.00
Nikkei 225 index recently reversed up with the daily Doji from the support area located between the key support level 39000.00 (former resistance from May) and the support trendline of the daily up channel from May.
This support area was further strengthened by the 38.2% Fibonacci correction of the sharp upward impulse i from May.
Given the strong daily uptrend and the improved sentiment across global equity markets, Nikkei 225 index can be expected to rise to the next resistance level 40550.00 (former multi-month high from January).

JAPAN as a HERO? UP! GOKU Last Fight! JAPAN is the last one to join the party! The final fight for the #BlowoffTop.
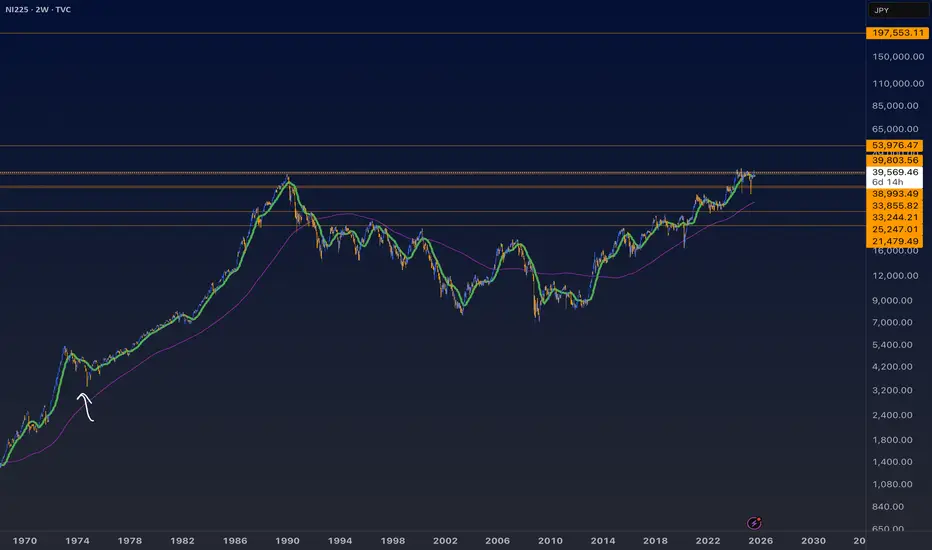
Why is this so important? If you look at correlations with BTC, global liquidity, China, the Fed’s interest rates, and more, Japan plays a key role. After China, Japan is the next to wake up and give the final push to this Bull Market.
The last time the Nikkei dropped more than 25% was during the COVID crash. What happened next? It rallied 26% in the first 52 days and extended its Bull Market to over 88% from the bottom.
With the current Carry Trade crisis (still unresolved), the TVC:NI225 has dropped more than 25% again, and guess what? It’s up 26% in the first 52 days... History doesn’t repeat, but it often rhymes.
It’s feeling like 2017 all over again... What do you think? 🚀📈

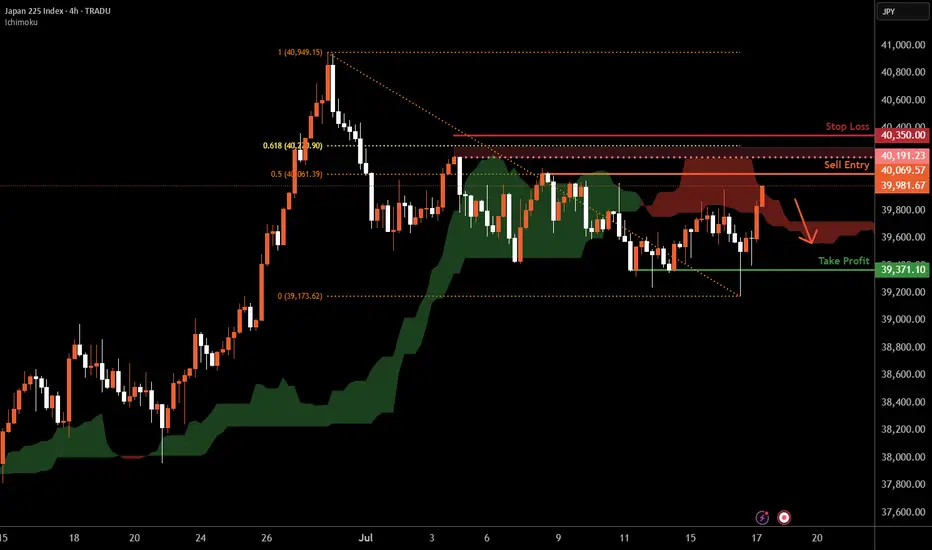
Nikkei 225 H4 | Swing-high resistance at 50% Fibo retracementThe Nikkei 225 (JPN225) is rising towards a swing-high resistance and could potentially reverse off this level to drop lower.
Sell entry is at 40,069.57 which is a swing-high resistance that aligns with the 50% Fibonacci retracement.
Stop loss is at 40,350.00 which is a level that sits above the 61.8% Fibonacci retracement and a swing-high resistance.
Take profit is at 39,371.10 which is a multi-swing-low support.
High Risk Investment Warning
Trading Forex/CFDs on margin carries a high level of risk and may not be suitable for all investors. Leverage can work against you.
Stratos Markets Limited (tradu.com ):
CFDs are complex instruments and come with a high risk of losing money rapidly due to leverage. 66% of retail investor accounts lose money when trading CFDs with this provider. You should consider whether you understand how CFDs work and whether you can afford to take the high risk of losing your money.
Stratos Europe Ltd (tradu.com ):
CFDs are complex instruments and come with a high risk of losing money rapidly due to leverage. 66% of retail investor accounts lose money when trading CFDs with this provider. You should consider whether you understand how CFDs work and whether you can afford to take the high risk of losing your money.
Stratos Global LLC (tradu.com ):
Losses can exceed deposits.
Please be advised that the information presented on TradingView is provided to Tradu (‘Company’, ‘we’) by a third-party provider (‘TFA Global Pte Ltd’). Please be reminded that you are solely responsible for the trading decisions on your account. There is a very high degree of risk involved in trading. Any information and/or content is intended entirely for research, educational and informational purposes only and does not constitute investment or consultation advice or investment strategy. The information is not tailored to the investment needs of any specific person and therefore does not involve a consideration of any of the investment objectives, financial situation or needs of any viewer that may receive it. Kindly also note that past performance is not a reliable indicator of future results. Actual results may differ materially from those anticipated in forward-looking or past performance statements. We assume no liability as to the accuracy or completeness of any of the information and/or content provided herein and the Company cannot be held responsible for any omission, mistake nor for any loss or damage including without limitation to any loss of profit which may arise from reliance on any information supplied by TFA Global Pte Ltd.
The speaker(s) is neither an employee, agent nor representative of Tradu and is therefore acting independently. The opinions given are their own, constitute general market commentary, and do not constitute the opinion or advice of Tradu or any form of personal or investment advice. Tradu neither endorses nor guarantees offerings of third-party speakers, nor is Tradu responsible for the content, veracity or opinions of third-party speakers, presenters or participants.
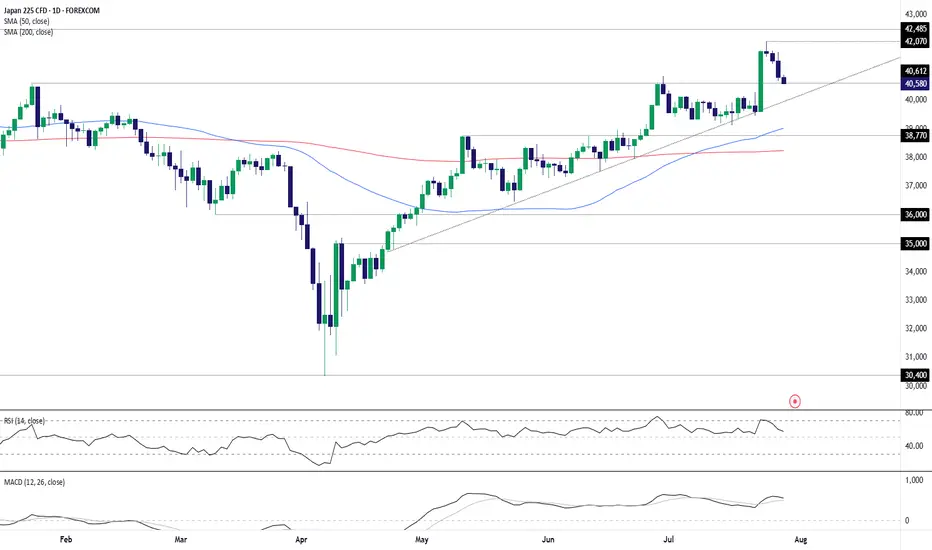
Bit of a delay - New Falling Wedge ready to break upJapan like Hong Kong is showing strong signs of growth.
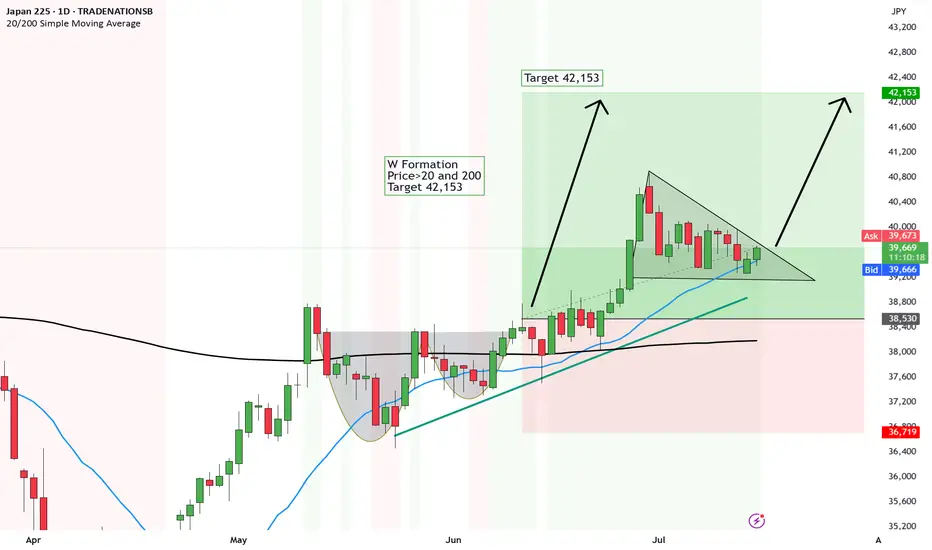
We first had the breakout above the Cup and Handle and now we are awaiting the breakout above the Falling Wedge...
There are some strong signs of upside fundamentally...
💼 1. Solid GDP & corporate profits
Japan’s economy grew about 2.7% annualized in Q1—beating estimates—and corporations are reporting stronger earnings growth
🌐 2. Foreign buying spree
Foreign investors have poured into Japanese stocks for weeks—13 of the last 14—with inflows fueled by attractive valuations and yen hedging
🤖 3. AI & chip boom
Tech and chip firms tied to AI are leading the charge, pushing market gains and drawing investor attention
💸 4. Cheap & reform-driven
Japanese equities trade at a discount (~15x forward P/E), and ongoing corporate governance reforms are boosting investor confidence
Here are the technicals
W Formation
Price>20 and 200
Target 42,153
Disclosure: I am part of Trade Nation's Influencer program and receive a monthly fee for using their TradingView charts in my analysis.
NI225: Will Go Up! Long!
My dear friends,
Today we will analyse NI225 together☺️
The recent price action suggests a shift in mid-term momentum. A break above the current local range around 39,581.12 will confirm the new direction upwards with the target being the next key level of 39,719.48 and a reconvened placement of a stop-loss beyond the range.
❤️Sending you lots of Love and Hugs❤️

NI225 NIKKEI 225 25-7-11Japan stocks remind me the most of this time in 1975, which marked a bottom. It’s not identical at all. Just the closest I could compare it to. It’s at all time highs and after a year or so of consolidation. The thing is now looks even better for a textbook W reversal up now. It’s a striking pattern really you can clearly see it. I wouldn’t be surprised if it makes more spikes back down though also before resuming an upward trend.
Nikkei 225 H1 | Swing-high resistance at a Fibo confluence zoneThe Nikkei 225 (JPN225) is rising towards a swing-high resistance and could potentially reverse off this level to drop lower.
Sell entry is at 40,196.22 which is a swing-high resistance that aligns with a confluence of Fibonacci levels i.e. the 78.6% projection and the 127.2% extension.
Stop loss is at 40,480.00 which is a level that sits above the 161.8% Fibonacci extension and an overlap resistance.
Take profit is at 39,712.53 which is a swing-low support.
High Risk Investment Warning
Trading Forex/CFDs on margin carries a high level of risk and may not be suitable for all investors. Leverage can work against you.
Stratos Markets Limited (tradu.com ):
CFDs are complex instruments and come with a high risk of losing money rapidly due to leverage. 63% of retail investor accounts lose money when trading CFDs with this provider. You should consider whether you understand how CFDs work and whether you can afford to take the high risk of losing your money.
Stratos Europe Ltd (tradu.com ):
CFDs are complex instruments and come with a high risk of losing money rapidly due to leverage. 63% of retail investor accounts lose money when trading CFDs with this provider. You should consider whether you understand how CFDs work and whether you can afford to take the high risk of losing your money.
Stratos Global LLC (tradu.com ):
Losses can exceed deposits.
Please be advised that the information presented on TradingView is provided to Tradu (‘Company’, ‘we’) by a third-party provider (‘TFA Global Pte Ltd’). Please be reminded that you are solely responsible for the trading decisions on your account. There is a very high degree of risk involved in trading. Any information and/or content is intended entirely for research, educational and informational purposes only and does not constitute investment or consultation advice or investment strategy. The information is not tailored to the investment needs of any specific person and therefore does not involve a consideration of any of the investment objectives, financial situation or needs of any viewer that may receive it. Kindly also note that past performance is not a reliable indicator of future results. Actual results may differ materially from those anticipated in forward-looking or past performance statements. We assume no liability as to the accuracy or completeness of any of the information and/or content provided herein and the Company cannot be held responsible for any omission, mistake nor for any loss or damage including without limitation to any loss of profit which may arise from reliance on any information supplied by TFA Global Pte Ltd.
The speaker(s) is neither an employee, agent nor representative of Tradu and is therefore acting independently. The opinions given are their own, constitute general market commentary, and do not constitute the opinion or advice of Tradu or any form of personal or investment advice. Tradu neither endorses nor guarantees offerings of third-party speakers, nor is Tradu responsible for the content, veracity or opinions of third-party speakers, presenters or participants.

NI225: Strong Growth Ahead! Long!
My dear friends,
Today we will analyse NI225 together☺️
The in-trend continuation seems likely as the current long-term trend appears to be strong, and price is holding above a key level of 39,810.33 So a bullish continuation seems plausible, targeting the next high. We should enter on confirmation, and place a stop-loss beyond the recent swing level.
❤️Sending you lots of Love and Hugs❤️
