NAS100 at Risk of Breaking Lower Amid Mixed Signals and End-of-MThe NAS100 is showing signs of weakness, with a clear daily pinbar candle signaling potential downside reversal. After a strong rally, the index appears overextended and vulnerable to a technical retracement. End-of-month profit-taking is likely adding pressure, as traders lock in gains and rebalance portfolios.
Uncertainty around reciprocal tariffs is also weighing on sentiment. Comments from U.S. officials, including Bessent, emphasize the need for renewed dialogue with China—highlighting unresolved tensions that could escalate. These trade concerns are surfacing just as the market is priced for optimism, increasing the risk of a pullback.
From a technical perspective, the daily pinbar near recent highs indicates a rejection of upward momentum. If confirmed with a break below the recent low, a move toward 20,400 or even the 50-day moving average could follow.
Seasonal flows and shifting sentiment may further limit upside in the short term. Any risk-off tone from global headlines or softer macro data could accelerate the move lower. Until the index clears resistance with conviction, the bias may now tilt to the downside. Traders should watch for follow-through signals and consider tightening stops.
USATEC trade ideas

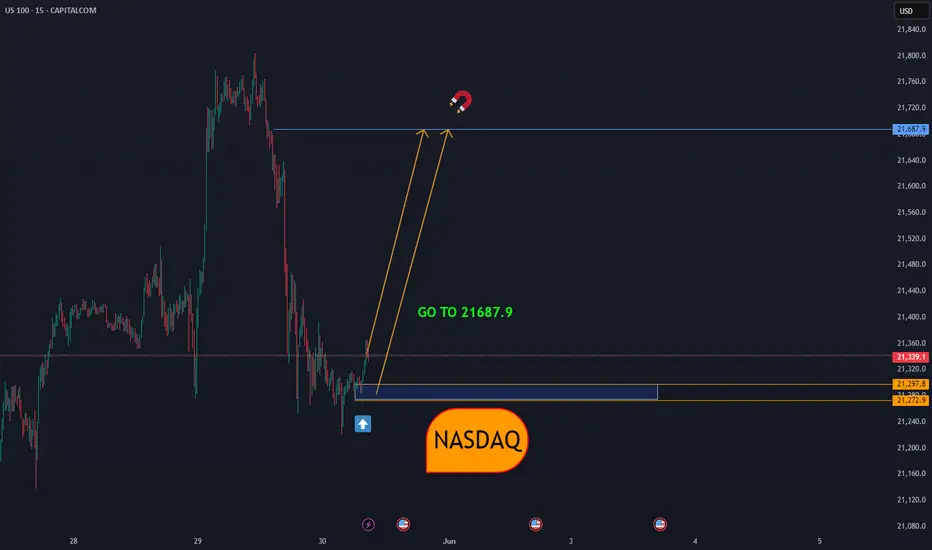
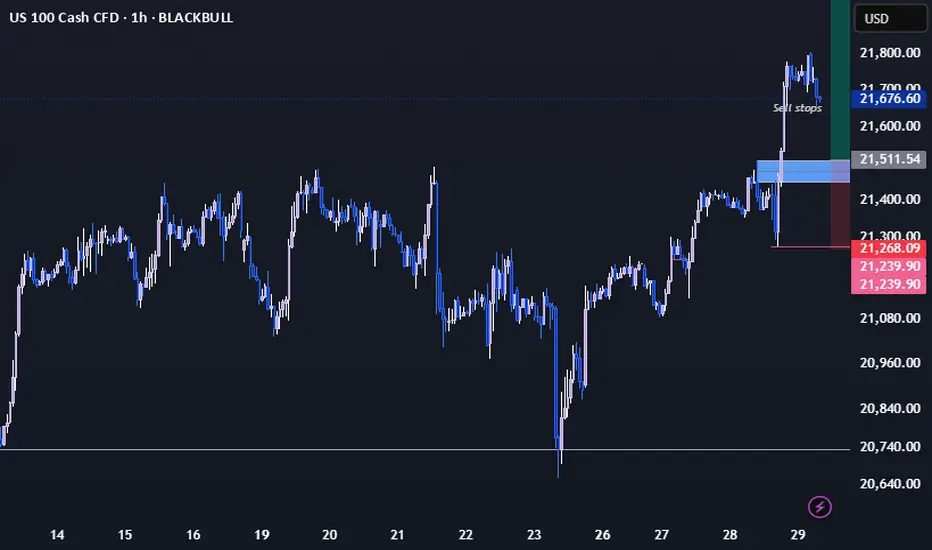
NASDAQGiven the geometry that has been created, there is a possibility of a correction towards the price of 21687.9, either from the current price or from a little lower, if the bottom of 21219 is broken, another decision must be made.
NASDAQ:NDX
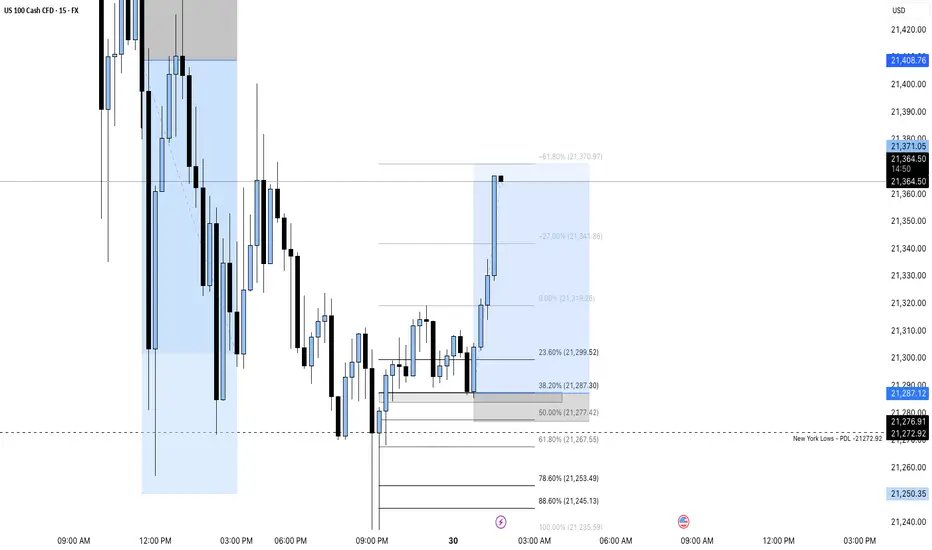
Nas100 Analysis Doesn't get any easier than this!
Seen price reversing from a strong AOI (38%) took buys targeting the -27 also the -61 on the fibonacci
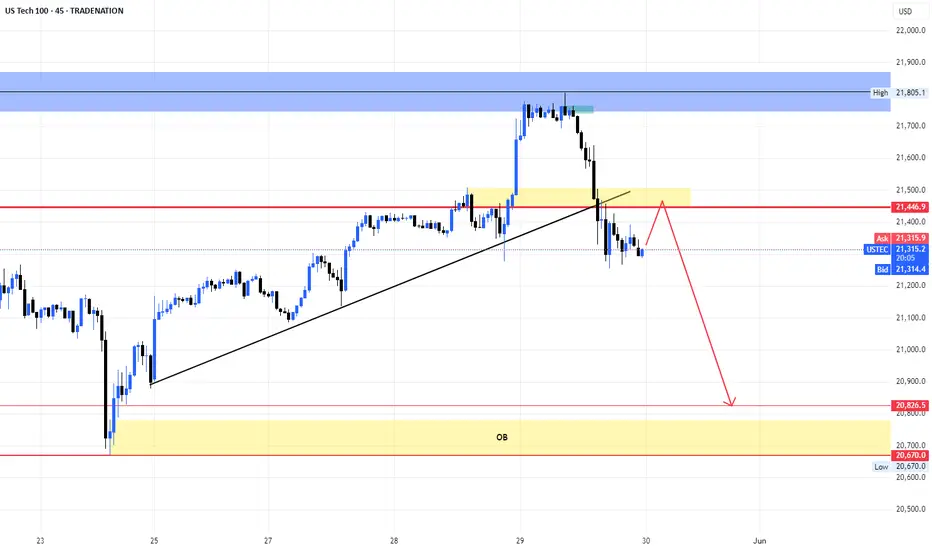
US100 Not yet ready for ATH - Structural BreakdownHere’s a detailed breakdown of the US Tech 100 - NASDAQ on the daily chart and why a lift off to ATHs may not be in play just yet.
✅ Key imbalance zones mapped out
🔻 Expecting downside clean-up before upside continuation
📊 FVGs & inefficiencies stacked below = high-probability revisit zones
If you’re trading NASDAQ, this map could be your cheat sheet before price makes its real move.
The market is respecting the ascending channel, but I’m expecting a cleanup of inefficiencies stacked below before any major continuation. Keep an eye on the key zones marked — price may revisit these areas for liquidity.
📉 Possible short-term correction
📈 Bias still bullish, but not without some pain first
Happy Trading !

NAS100-TEC100 - THE SECRETE OF TRADING INDICES STRATEGYTeam,
yesterday we short the NAS, DOW, DAX and long the GOLD - 4 out of 4 perfectly target hit
Now, we are going long, i want you to carefully look at the picture and understand the concept of how I structure the trade. This has been calculate using my statistic and probability to ensure our entry is safe.
First picture, is buying small volume, if market volatile and push further down, i need you to double up your trade, this allow us to win better.
That's the reason why you saw my videos that everyday i show LIVE trading and profitable every trade. However, always carefully look at your capital and know exactly how much risk are you going to take.
Remember, you can win straight 3-6 months and if you failed risk management and overleverage yourself, the account can easily be kill within 1 day.
Hope you all have a great day.!

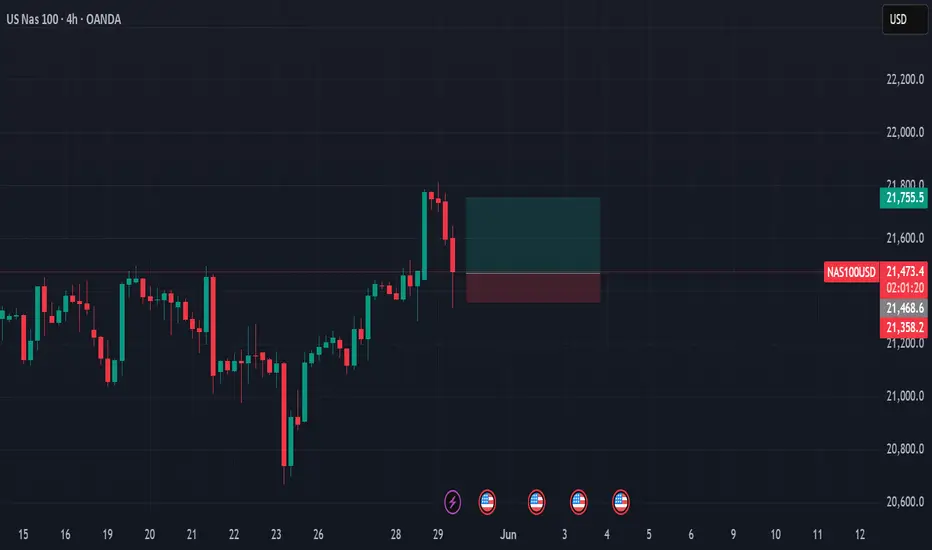
Nasdaq scenario 30/05/2025English : According to our analysis, we anticipate a bearish scenario.
Morocan Darija : kanchofo d'apres l'analyse dyalna antsanaw hboot
ATENTION : I only share my ideas, not signals
Falling towards pullback support?NAS100 is falling towards the support level which is a pullback support that lines up with the 23.6% Fibonacci retracement and could bounce from this level to our take profit.
Entry: 20,809.93
Why we like it:
There is a pullback support level that aligns with the 23.6% Fibonacci retracement.
Stop loss: 20,352.24
Why we like it:
There is a pullback support level that is slightly above the 38.2% Fibonacci retracement.
Take profit: 21,779.63
Why we like it:
There is a pullback resistance level.
Enjoying your TradingView experience? Review us!
Please be advised that the information presented on TradingView is provided to Vantage (‘Vantage Global Limited’, ‘we’) by a third-party provider (‘Everest Fortune Group’). Please be reminded that you are solely responsible for the trading decisions on your account. There is a very high degree of risk involved in trading. Any information and/or content is intended entirely for research, educational and informational purposes only and does not constitute investment or consultation advice or investment strategy. The information is not tailored to the investment needs of any specific person and therefore does not involve a consideration of any of the investment objectives, financial situation or needs of any viewer that may receive it. Kindly also note that past performance is not a reliable indicator of future results. Actual results may differ materially from those anticipated in forward-looking or past performance statements. We assume no liability as to the accuracy or completeness of any of the information and/or content provided herein and the Company cannot be held responsible for any omission, mistake nor for any loss or damage including without limitation to any loss of profit which may arise from reliance on any information supplied by Everest Fortune Group.

NASDAQThe target is for the price of 21272.4 to fall, with any correction if the ceiling of 21802 is not broken, a short trade can be made.
CAPITALCOM:US100

4hr break and retestgoing long here, price action is nice and simple
i am aiming for a 50 percent retracement to or close to the gerneral price action where it has previously broke out
NAS100 ANALYSIS Nas100 has the same sentiment as SPX500 .....Im expecting price to take out the lows first but better to be patient than to predict and gamble !!!

All I want is bullish price run until proven otherwiseIt would be nice if we used a breaker to continue buying. However, in the end, it all depends on how strong the Nas100 bullish bias is.
NAS100 ChannelThis is a channel on nas100 to be checked whenever you wish to , and observe the deviations of the trend


NAS100 Breakout or Bull Trap? | Smart Money Zone Rejected! NAS100 has just tapped into a strong supply zone marked by institutional activity — right around 21,700–21,731. After weeks of bullish momentum, price has now shown hesitation at this level.
📉 If sellers step in here, we may be witnessing the beginning of a retracement back to key demand levels.
---
🔑 Key Levels to Watch:
🔵 Resistance (Current Supply Zone): 21,700 – 21,731
🟦 First Demand Level: 20,507 – A previous structure and breakout zone
🟧 Major Demand Zone: 19,263 – Institutional accumulation zone and strong price memory
---
📊 What to Look For:
✅ Bearish confirmation at the supply zone (rejection candles, break of structure)
✅ Volume spike + lower highs = possible short-term reversal
❗ Invalidation: Clean breakout and retest above 21,731 may continue the bullish rally
---
🔮 Possible Scenario:
🟥 If sellers defend the current level, we could see:
1. Pullback to 20,500 📉
2. Deep retracement into 19,263 if demand fails 🚨
3. Short setups may become attractive below 21,500 with tight stops above the zone
---
⚠️ Why This Matters:
📆 We're heading into a heavy news week (see the upcoming US economic calendar at the bottom of the chart). Volatility is expected. Smart money often moves before major releases!
---
💬 What’s your bias? Are we looking at a fakeout or a breakout?
👉 Drop your analysis below and don’t forget to like if this helped your trading plan!
📌 Follow me @FrankFx14 for more smart money insights and daily trade setups.

Nasdaq analysis: 29-May-2025Good morning, everyone! Today's Nasdaq analysis is designed to educate and empower. Use these insights to refine your price action trading strategy.

US100 CFD // The bowl is completed at the 22.133 level, we can see this level as a sales opportunity and make some profit. When we sell, our take profit point is 10 exponentials.

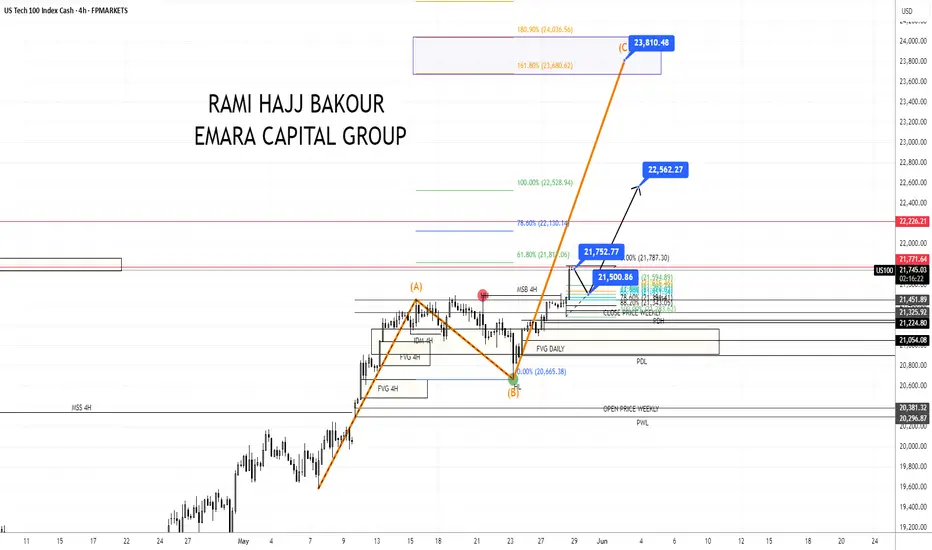
Nasdaq: Positive Momentum Builds Following Nvidia's Q1 EarningsThe Nasdaq is experiencing increased bullish momentum following Nvidia’s impressive Q1 earnings.
On the medium to long term, the index is targeting levels around 23,800.
In the short term, a corrective move toward 21,500 is expected, which will likely set the stage for a strong rebound toward 22,300 and 23,000.
📈 Stay tuned for upcoming opportunities and key levels!
📈 Suggested Hashtags for maximum reach:
#Nasdaq
#Nvidia
#EarningsSeason
#BullishOutlook
#TechnicalAnalysis
#PriceAction
#StockMarket
#TradingView
#MarketTrends
#Investing
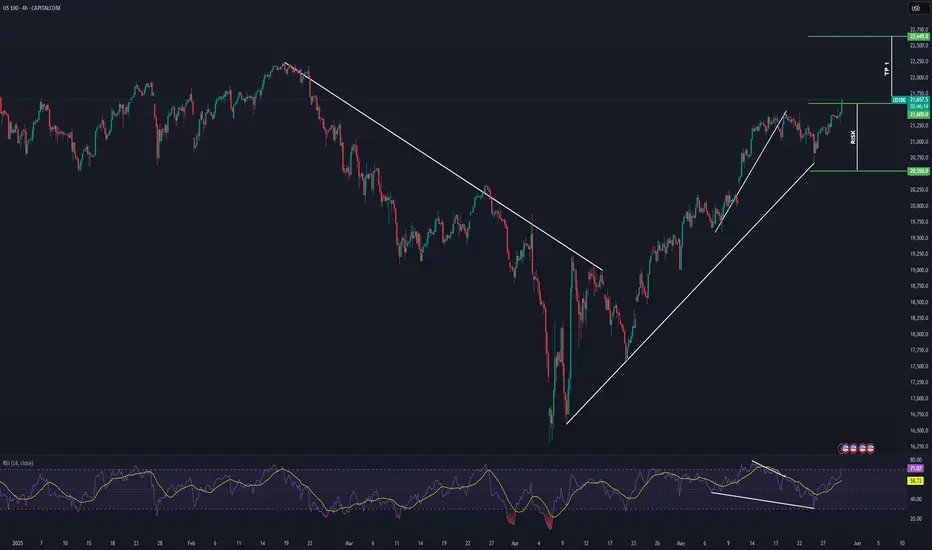
NASDAQ Potential Bullish ContinuationNASDAQ price action seems to exhibit signs of potential Bullish momentum as the price action may form a credible Higher High (after tarriff delays on the EU) with multiple confluences through key Fibonacci and Support levels which presents us with a potential long opportunity.
Trade Plan:
Entry : 21600
Stop Loss : 20550
TP 1: 22649
NASDAS PLANHello, good ? Me no.
I see this pattern. Consolidation this summer and fall in August and Setpember.
Bottom is December 2025.
After ? idk.
Good luck

Bearish US100everything is clear that the price will goes down after several times rejected from top.

US 100 – Further Moves Await NVIDIA Earnings UpdateGlobal stock indices have reacted positively at the start of this new trading week to President Trump’s decision to extend a deadline which would impose a tariff of 50% on EU goods imported into the US from June 1st to July 9th.
Taken alongside a new willingness being signalled from the EU side to speed the negotiating process along in key areas, means trader hopes have increased that a deal between the first and third largest of the world’s economies can be agreed in principle within the allotted time.
Focusing on US stock indices, the US 100 has risen 2.4% this week, taking it only a small step away from its recent highs at 21493 seen on May 20th. However, later today, the rally is about to face possibly its biggest challenge of the week in the form of earnings from the second biggest company on the planet ($3.3 trillion mkt cap) and AI bellwether NVIDIA, which are released after the market close.
Traders will not only be looking to judge company’s actual performance against expectations but will be eager to receive updates on the impact of President Trump’s tariffs on future revenue, chip deals with the Middle East, competition and its outlook for AI demand moving forward.
Answers to these questions and others may well impact sentiment towards technology stocks and the US 100 moving into the end of the week, and month, on Friday.
With increased volatility a possibility, knowing the technical outlook can also be helpful.
Technical Update: Focus on the May Highs at 21493
While last week did see correction themes develop within the US 100 index, there appears to be no clear-cut signs of a negative sentiment shift yet, as fresh buying developed above support provided by the rising Bollinger mid-average, currently at 20772 (see chart below).
However, looking forward, if the NVIDIA earnings prompt an increase in US 100 price volatility, what are the levels traders may be watching for clues to the next directional themes?
Potential Support Levels:
It is possible the rising Bollinger mid-average, currently at 20772, represents a first support for traders, and as such, closing breaks below this level might lead to a more extended phase of price weakness.
Such moves while not a guarantee of declines, could lead to a deeper sell-off towards 20001, which is equal to the 38.2% Fibonacci retracement of April 21st to May 20th 2025 price strength.
Potential Resistance Levels:
With this week seeing fresh price strength emerge from above the rising Bollinger mid-average, a positive price pattern of higher highs and higher lows, may still be evident. This reflects buyers currently being willing to pay higher prices, each time a setback materialises.
However, to maintain this uptrend pattern in price, the focus could now be on resistance provided by the May high at 21493 (May 20th), with closing breaks above this level required to suggest further strength might then be on the cards, towards what could prove to be the next potential resistance level at 22226, which is the February 18th 2025 all-time high.
The material provided here has not been prepared in accordance with legal requirements designed to promote the independence of investment research and as such is considered to be a marketing communication. Whilst it is not subject to any prohibition on dealing ahead of the dissemination of investment research, we will not seek to take any advantage before providing it to our clients.
Pepperstone doesn’t represent that the material provided here is accurate, current or complete, and therefore shouldn’t be relied upon as such. The information, whether from a third party or not, isn’t to be considered as a recommendation; or an offer to buy or sell; or the solicitation of an offer to buy or sell any security, financial product or instrument; or to participate in any particular trading strategy. It does not take into account readers’ financial situation or investment objectives. We advise any readers of this content to seek their own advice. Without the approval of Pepperstone, reproduction or redistribution of this information isn’t permitted.

NSDQ100 INTRADAY resistance retest ahead of US OpenThe USD continues to rally, driven by:
A strong rebound in US Consumer Confidence, reversing a six-month downtrend.
A decline in the number of Americans expecting a recession, improving risk sentiment.
This positive momentum helped offset weaker April Durable Goods Orders, which reflected business concerns tied to Trump’s tariff policies.
Trump Signals Progress with EU Trade Talks
Trump stated on Truth Social that the EU is moving quickly to begin trade negotiations after he expressed satisfaction with a proposed 50% tariff.
Markets could interpret this as a step toward de-escalation, potentially supporting US equities and the USD, while posing risk to EU markets if tensions resume.
SpaceX Test Failure
SpaceX’s Starship test failed mid-flight. While a technical setback, broader market impact is likely minimal unless similar failures persist.
Could marginally affect aerospace and space-related stocks.
Elon Musk on Crypto & Tax Policy
Musk criticized Trump’s tax bill, claiming it undermines DOGE and broader crypto innovation.
Slightly negative for crypto sentiment, particularly speculative tokens like Dogecoin.
Earnings in Focus
Nvidia (NVDA):
Market will watch for signs of weaker China-related growth, tied to Trump’s policy on semiconductors and AI.
Key impact expected on tech stocks, semis, and the NASDAQ.
Salesforce (CRM):
Focus on adoption of new AI tools and updates on the $8 billion Informatica acquisition.
Could affect broader enterprise software and cloud sector sentiment.
Key Support and Resistance Levels
Resistance Level 1: 21520
Resistance Level 2: 21850
Resistance Level 3: 22200
Support Level 1: 21000
Support Level 2: 20770
Support Level 3: 20560
This communication is for informational purposes only and should not be viewed as any form of recommendation as to a particular course of action or as investment advice. It is not intended as an offer or solicitation for the purchase or sale of any financial instrument or as an official confirmation of any transaction. Opinions, estimates and assumptions expressed herein are made as of the date of this communication and are subject to change without notice. This communication has been prepared based upon information, including market prices, data and other information, believed to be reliable; however, Trade Nation does not warrant its completeness or accuracy. All market prices and market data contained in or attached to this communication are indicative and subject to change without notice.
