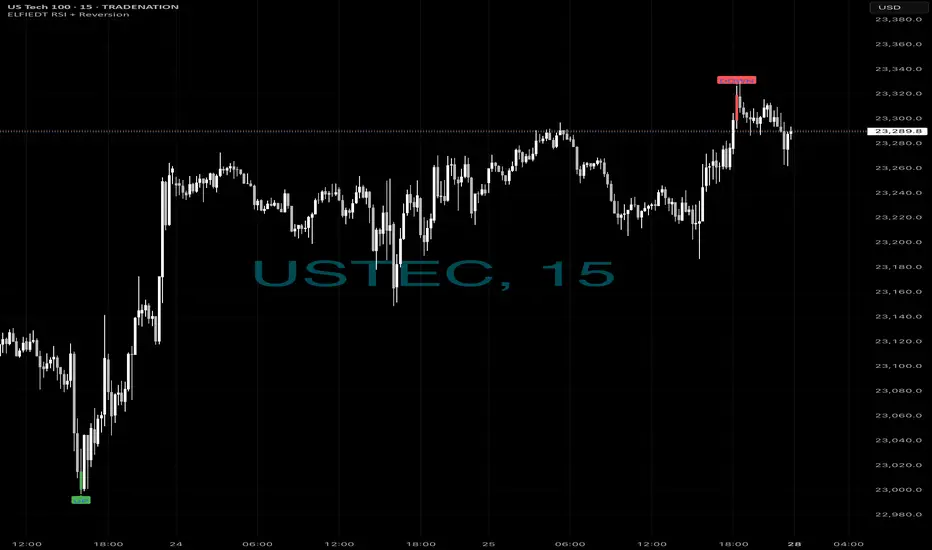
Longs then short - $$$🚀 Caught the Bottom. 🔻 Sold the Top.
Same chart. Same system. Same day.
While most traders were guessing,
ELFIEDT RSI + Reversion was sniping both ends on the US Tech 100.
📍 Long Signal:
At the dead low — green UP arrow fired.
The reversal followed instantly. Momentum exploded.
📍 Short Signal:
At the top of the rally — red DOWN printed.
Perfect spot. Price reversed hard within 1 candle.
⸻
🎯 How It Works:
✔️ Combines RSI overshoots + volatility reversion
✔️ Filters false signals using structure + time of day
✔️ Works on any index or FX pair
✔️ Real-time signals. No lag. No repainting.
⸻
💡 These weren’t “lucky trades.”
They were high-probability SETUPS.
Backed by logic. Confirmed by RSI extremes.
And now? Proven on the chart.
⸻
👉 Want to catch the next reversal like this?
💬 DM me “USTEC” or drop a 🚀
🔒 Access is limited to serious traders only.
📲 Follow for daily setups & training.
USATEC trade ideas
Upward momentum of Nasdaq is weakening, likely to fall to supporUpward momentum of Nasdaq is weakening, likely to fall to support level of 22k

Sunday pre market analysistake the liQ from Junes high then
possible hit the 4H FVG if not just continue
upwards into September

when to change your session bias and Take profit, YM! Long1. This video demonstrate when you should change you bias for the session, sometimes before session price action quite confusing but when you add SMT and strength switch concept to you bias you will see true price intention where it will go.
2. Always take entry or profit one level to another level, price always go from one level to another level.
3. This video I try to demonstrate how to take profit when you have to level to target, always look for the correlated instruments to build bias

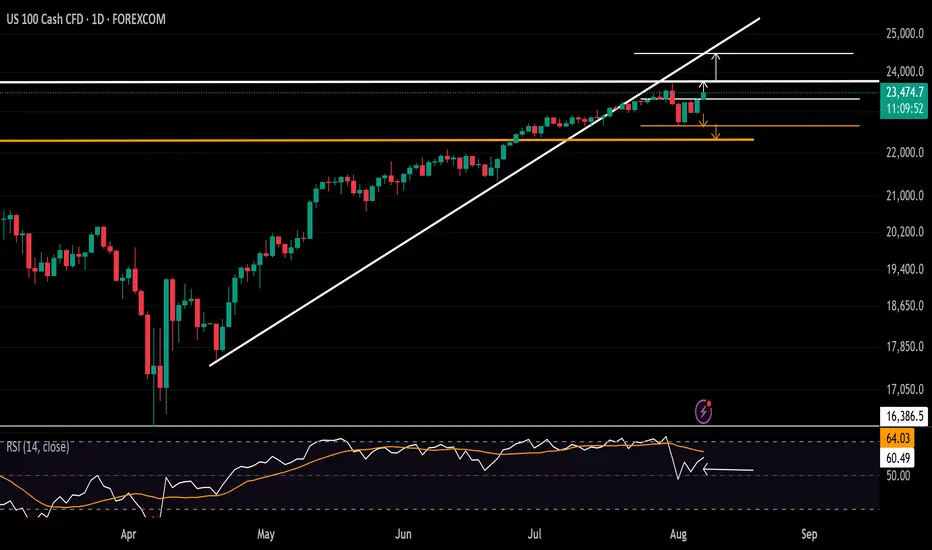
Nasdaq long position Nasdaq long position update. Nasdaq is still going as predicted and is about to hit the set target of 24,000. Recently Nasdaq retested a support of break-out and retest and continued with the bullish momentum. Nasdaq is set to thrive even higher to a price of 25,000.

NSDQ100 sideways consolidation support at 23045Nasdaq 100 Market Summary – August 8
Markets remain cautious, with a mix of corporate and macro developments driving sentiment.
Gold futures surged after the US unexpectedly imposed tariffs on one-kilo and 100-ounce gold bars. The move surprised traders and added fresh uncertainty to the metals market. Oil prices stabilized following a recent decline, as attention shifts to potential diplomatic developments, including a possible Trump-Putin meeting.
In the tech sector, Tesla scrapped its Dojo supercomputer project, a blow to its in-house AI and self-driving ambitions. This comes just weeks after Elon Musk said he was doubling down on the effort. The departure of the project’s lead adds to investor concerns. Meanwhile, Intel’s CEO responded to political pressure by reaffirming his board’s support, as Trump called for his resignation over alleged conflicts of interest.
On the economic front, the latest jobless claims data brought some relief after last week’s soft payrolls report. Initial claims rose slightly to 226,000, just above the 222,000 forecast. However, continuing claims came in higher at 1.974 million, with most of the increase seen in California—likely due to seasonal factors. Additionally, the New York Fed’s July survey showed a rise in both inflation expectations and concerns about the job market.
Conclusion for Nasdaq 100 Trading:
The tone remains cautious. Disruptions at major constituents like Tesla and Intel may drag on sentiment, while macro uncertainty—rising geopolitical tensions, new tariffs, and unstable commodity markets—adds to headwinds. Traders may rotate into defensives or software names with lower exposure to AI hardware or international trade risks. Expect range-bound trading with elevated volatility until clarity emerges on US-Russia diplomacy and the true extent of tariff impacts.
Key Support and Resistance Levels
Resistance Level 1: 23700
Resistance Level 2: 23900
Resistance Level 3: 24085
Support Level 1: 23045
Support Level 2: 22870
Support Level 3: 22675
This communication is for informational purposes only and should not be viewed as any form of recommendation as to a particular course of action or as investment advice. It is not intended as an offer or solicitation for the purchase or sale of any financial instrument or as an official confirmation of any transaction. Opinions, estimates and assumptions expressed herein are made as of the date of this communication and are subject to change without notice. This communication has been prepared based upon information, including market prices, data and other information, believed to be reliable; however, Trade Nation does not warrant its completeness or accuracy. All market prices and market data contained in or attached to this communication are indicative and subject to change without notice.


NAS100 H4 | Bullish bounce offUS100 (NAS100) has bounced off the buy entry which is a pullback support that is slightly above the 38.2% Fibonacci retracement and could rise to the take profit.
Buy entry is at 23,276.48, which is a pullback support that is slightly above the 38.2% Fibonacci retracement.
Stop loss is at 23,029.35, which is an overlap support that aligns with he 61.8% Fibonacci retracement.
Take profit is at 23,736.91, which is a swing high resistance.
High Risk Investment Warning
Trading Forex/CFDs on margin carries a high level of risk and may not be suitable for all investors. Leverage can work against you.
Stratos Markets Limited (tradu.com ):
CFDs are complex instruments and come with a high risk of losing money rapidly due to leverage. 65% of retail investor accounts lose money when trading CFDs with this provider. You should consider whether you understand how CFDs work and whether you can afford to take the high risk of losing your money.
Stratos Europe Ltd (tradu.com ):
CFDs are complex instruments and come with a high risk of losing money rapidly due to leverage. 66% of retail investor accounts lose money when trading CFDs with this provider. You should consider whether you understand how CFDs work and whether you can afford to take the high risk of losing your money.
Stratos Global LLC (tradu.com ):
Losses can exceed deposits.
Please be advised that the information presented on TradingView is provided to Tradu (‘Company’, ‘we’) by a third-party provider (‘TFA Global Pte Ltd’). Please be reminded that you are solely responsible for the trading decisions on your account. There is a very high degree of risk involved in trading. Any information and/or content is intended entirely for research, educational and informational purposes only and does not constitute investment or consultation advice or investment strategy. The information is not tailored to the investment needs of any specific person and therefore does not involve a consideration of any of the investment objectives, financial situation or needs of any viewer that may receive it. Kindly also note that past performance is not a reliable indicator of future results. Actual results may differ materially from those anticipated in forward-looking or past performance statements. We assume no liability as to the accuracy or completeness of any of the information and/or content provided herein and the Company cannot be held responsible for any omission, mistake nor for any loss or damage including without limitation to any loss of profit which may arise from reliance on any information supplied by TFA Global Pte Ltd.
The speaker(s) is neither an employee, agent nor representative of Tradu and is therefore acting independently. The opinions given are their own, constitute general market commentary, and do not constitute the opinion or advice of Tradu or any form of personal or investment advice. Tradu neither endorses nor guarantees offerings of third-party speakers, nor is Tradu responsible for the content, veracity or opinions of third-party speakers, presenters or participants.

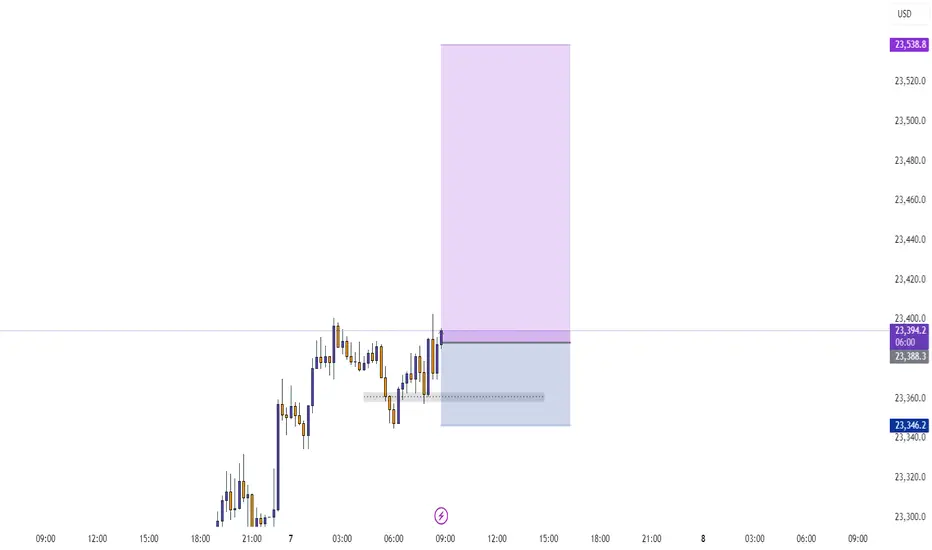
BUY USTEC 8.8.2025Confluence order: BUY at M15
Type of order: Limit order
Reason:
- The current top is not touching anything, expected to rise to the MAINKEY of H1~M15 above.
- M15~FIBO 0,5-0,618 (same position)
Note:
- Management of money carefully at the last bottom (23,459)
Set up entry:
- Entry buy at 23,438
- SL at 23,423
- TP1: 23,459 (~1R)
- TP2: 23,481 (~2R)
- TP3: 23,540 (~6R)
Trading Method: Price action (No indicator, only trend and candles)


NAS100 - LONGPrice pushed down a lot lower than I thought it would but sentiment still remains the same. Waiting for bullish confirmation for price to reach today's highs.

NAS100 - LONGstrong sell of this morning. Waiting for buyers to reenter the market and push price back to todays highs.

NASDAQ Index (US100 / NASDAQ) Analysis:The NASDAQ index has shown strong bullish momentum recently and is currently trading near a key resistance level at 23,530.
🔻 Bearish Scenario:
If the price fails to break above 23,530 and selling pressure begins to appear, we may see a downside correction toward 23,350. A break below this level could extend the decline toward 23,000.
🔺 Bullish Scenario:
If the price successfully breaks and holds above 23,530, it could support a continued move upward toward 23,730 as the first target. With sustained momentum, we might see a further push toward 24,000.
⚠️ Disclaimer:
This analysis is not financial advice. It is recommended to monitor the markets and carefully analyze the data before making any investment decisions.
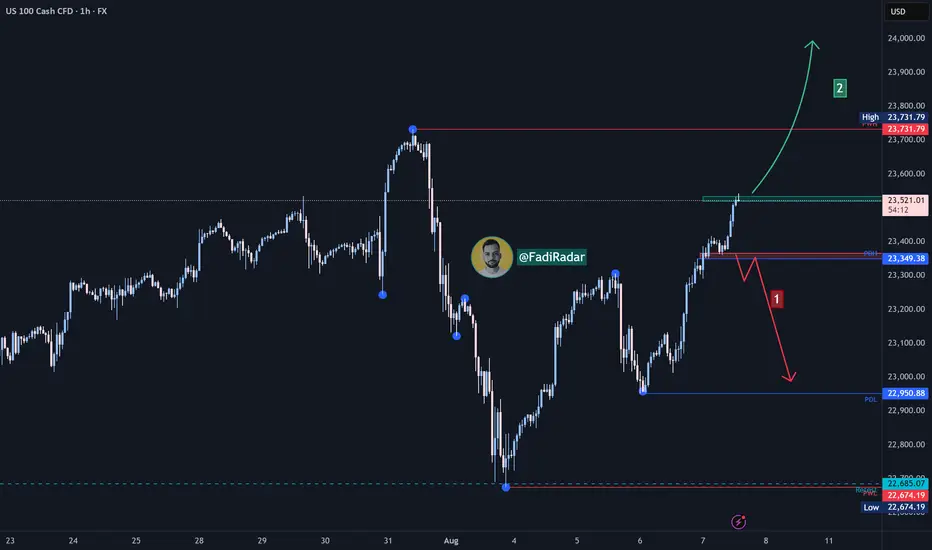
Nasdaq Eyes Record Highs Once AginNasdaq faces pressure as it trades below the trendline connecting the consecutive higher lows from April 2025. However, the latest decline rebounded from strong support at 22,700. Price action has reclaimed the 23,000 and 23,400 levels, suggesting a potential shift in tone.
A clean close above 23,500 is likely needed to push the index toward new highs above 23,700. From there, price may either pull back or continue an extended rally toward 24,000 and 24,400.
On the downside, if price falls back below 22,700, the risk increases for a move toward the previous key peaks from 2025 near 22,400 and 22,200.
- Written by Razan Hilal, CMT

BUY USTEC 7.8.2025Confluence order: BUY at M15
Type of order: Limit order
Reason:
- The current top is not touching anything, expected to rise to the sub-key of H1~M15 above.
- M15~FIBO 0,5-0,618 (same position)
Note:
- Management of money carefully at the last bottom (23,,367)
Set up entry:
- Entry buy at 23,339
- SL at 23,317
- TP1: 23,367 (~1R)
- TP2: 23,403 (~3R)
- TP3: 23,459 (~5R)
Trading Method: Price action (No indicator, only trend and candles)

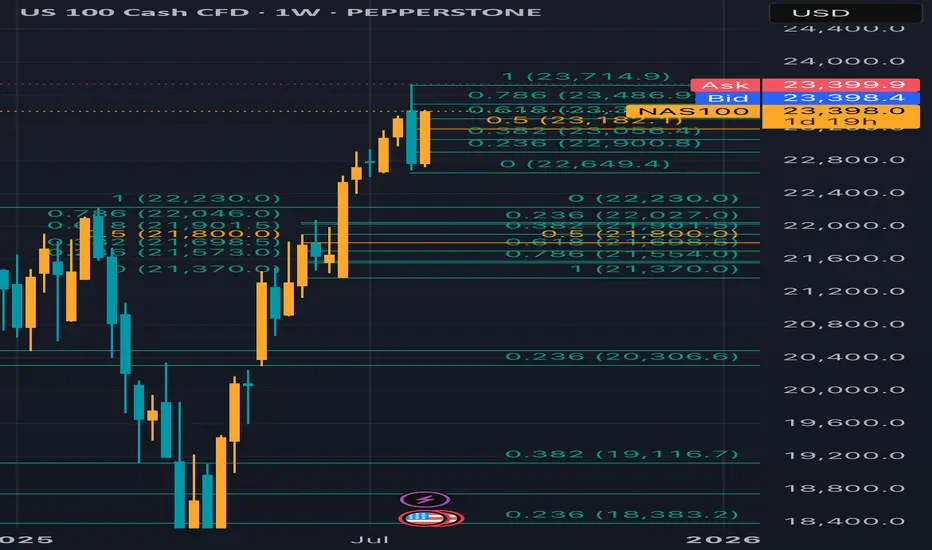
Aug 6th corrective phase, bullish trade setup The Nasdaq 100 is a tech-heavy index, highly sensitive to macroeconomic factors like interest rates, tech earnings, and market sentiment. On August 6, 2025, the market is likely influenced by:
• Monetary Policy: Recent Federal Reserve actions (rate cuts or pauses) could drive bullish momentum, as lower rates favor growth stocks in the Nasdaq.
• Economic Data: Employment, CPI, or tech sector earnings reports could impact volatility.
• Technical Levels: Fibonacci retracements, support/resistance, and trendlines are critical for intraday trading.
I entered Nasdaq above the 0.382 level (23,056.4), First target 23400 was reach at approximately 7pm PST the next targets are the 1.0 (23,700)
*this is not financial advice entertain at your own risk 📊📈
NAS100 at mjaor resistance area Fib 0.5Price has reached the 0.5–0.382 Fibonacci retracement zone of the recent swing. If the bears are strong, we may see a rejection toward the trendline support. However, if this resistance is broken, a bullish continuation is also possible. Let's see how it plays out.

Nasdaq Pumping High, We Might Ride The WavePrice today(Wed) is recovering from yesterday's (Tue) dumping. Our bullish direction is still intact.
Entries should be taken once, price has entered within our Area of Opportunity.
Targets with their success rate have been outlined on the charts.

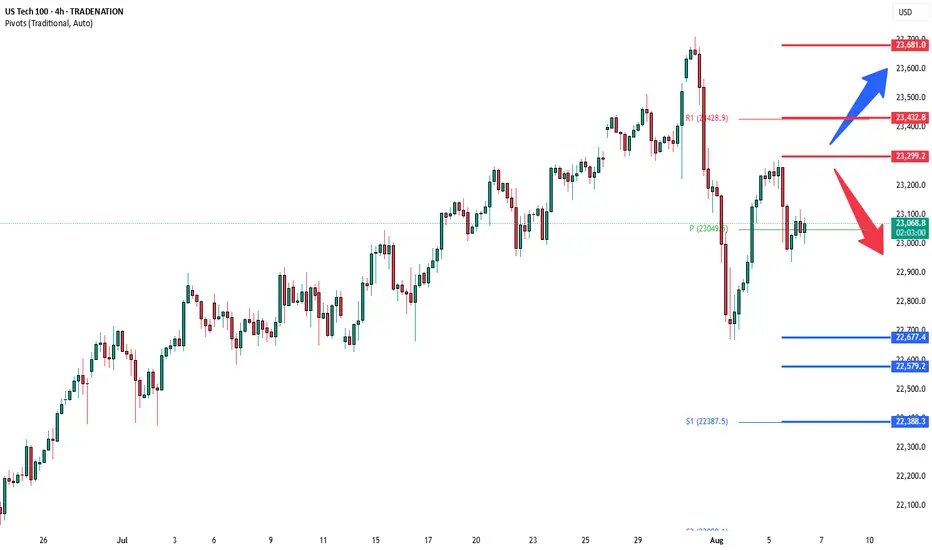
NSDQ100 Pre US Open Key Trading levelsTrade Policy & Tariff Risks:
Donald Trump escalated trade rhetoric, signaling higher tariffs on countries importing Russian energy, and previewing new tariffs on semiconductors and pharmaceuticals within days. This raises geopolitical and supply chain uncertainty—key risks for NSDQ 100 tech and healthcare stocks, particularly chipmakers, drug manufacturers, and firms exposed to global trade.
Swiss Tariff Dispute:
Swiss President Keller-Sutter is in Washington seeking to lower a newly imposed 39% tariff—highlighting the broader unpredictability of US trade actions, which could fuel market volatility and weigh on investor sentiment.
Ukraine Conflict & Sanctions Outlook:
As the US pushes toward an Aug. 8 deadline to resolve the Ukraine conflict, Trump's envoy is in Moscow. Potential Kremlin concessions (e.g., halting airstrikes) may reduce geopolitical risk premiums, especially for defense, energy, and global consumer tech firms.
Federal Reserve & Rate Policy:
With Fed Governor Kugler resigning, Trump is expected to name a replacement this week. His ongoing pressure on the Fed to cut rates adds policy uncertainty. This could support rate-sensitive NSDQ stocks in the near term, especially growth names in tech, if dovish expectations build.
Takeaway for NSDQ100 Traders:
Expect increased volatility around tariff news, Fed appointments, and geopolitical headlines. Traders should watch for:
Semiconductor stocks (e.g., NVDA, AMD, INTC) under pressure from tariff threats.
Big tech and biotech swings tied to pharma trade policy.
Potential relief rallies if Russia concessions materialize or Fed commentary turns dovish.
Key Support and Resistance Levels
Resistance Level 1: 23300
Resistance Level 2: 22430
Resistance Level 3: 23680
Support Level 1: 22677
Support Level 2: 22580
Support Level 3: 22388
This communication is for informational purposes only and should not be viewed as any form of recommendation as to a particular course of action or as investment advice. It is not intended as an offer or solicitation for the purchase or sale of any financial instrument or as an official confirmation of any transaction. Opinions, estimates and assumptions expressed herein are made as of the date of this communication and are subject to change without notice. This communication has been prepared based upon information, including market prices, data and other information, believed to be reliable; however, Trade Nation does not warrant its completeness or accuracy. All market prices and market data contained in or attached to this communication are indicative and subject to change without notice.
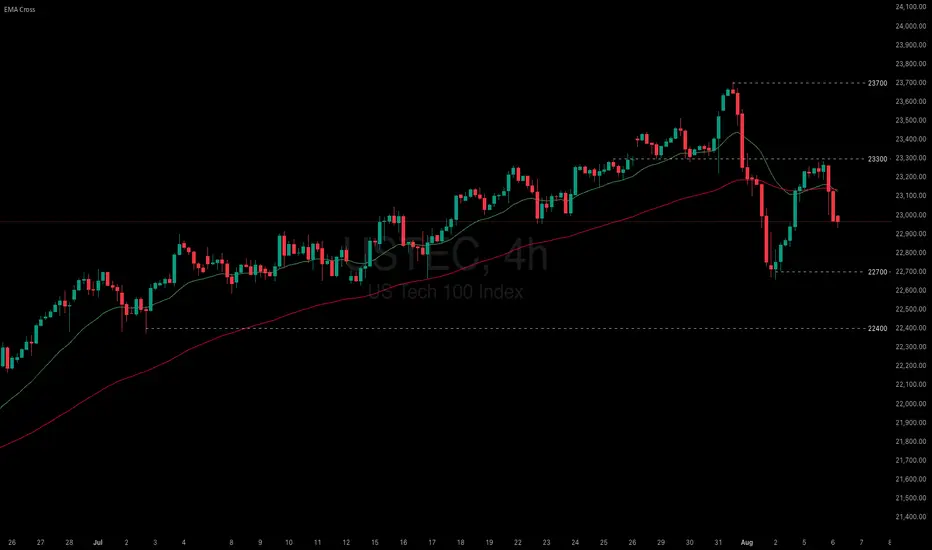
US indices paused as fragile macro data undermined recent gains
US equity gains paused amid President Trump’s renewed tariff threats and weakening economic data. Trump warned of steep tariff hikes on India and a potential 35% levy on the EU if obligations are not met. Meanwhile, the US July Services PMI fell from 50.8 to 50.1, missing the 51.5 consensus. New orders dropped to 50.3, while employment declined to 46.4—the lowest since March.
USTEC briefly tested 23300 before breaking below both EMAs. The widening gap between EMA21 and EMA78 suggests a potential shift toward bearish momentum. If USTEC fails to break above the resistance at 23300, the index could decline further toward 22700. Conversely, if USTEC breaks above both EMAs and 23300, the index may gain bullish traction toward 23700.
NAS100 vs AUS200 ShortThis ratio measure is not net short on the regression break.
It indicates there is mis-pricing of risk and you should take cation in the coming weeks.
