ACXUSDT 1D#ACX has been moving inside a descending channel for a long time — it might be time for a move up.
In case of a breakout above the channel resistance, the targets are:
🎯 $0.1832
🎯 $0.2019
🎯 $0.2206
🎯 $0.2471
🎯 $0.2810
⚠️ As always, use a tight stop-loss and apply proper risk management.
ACXUSDT trade ideas

ACX/USDTKey Level Zone: 0.1820 - 0.1850
LMT v2.0 detected.
The setup looks promising—price previously trended upward with rising volume and momentum, then retested this zone cleanly. This presents an excellent reward-to-risk opportunity if momentum continues to align.
Introducing LMT (Levels & Momentum Trading)
- Over the past 3 years, I’ve refined my approach to focus more sharply on the single most important element in any trade: the KEY LEVEL.
- While HMT (High Momentum Trading) served me well—combining trend, momentum, volume, and structure across multiple timeframes—I realized that consistently identifying and respecting these critical price zones is what truly separates good trades from great ones.
- That insight led to the evolution of HMT into LMT – Levels & Momentum Trading.
Why the Change? (From HMT to LMT)
Switching from High Momentum Trading (HMT) to Levels & Momentum Trading (LMT) improves precision, risk control, and confidence by:
- Clearer Entries & Stops: Defined key levels make it easier to plan entries, stop-losses, and position sizing—no more guesswork.
- Better Signal Quality: Momentum is now always checked against a support or resistance zone—if it aligns, it's a stronger setup.
- Improved Reward-to-Risk: All trades are anchored to key levels, making it easier to calculate and manage risk effectively.
- Stronger Confidence: With clear invalidation points beyond key levels, it's easier to trust the plan and stay disciplined—even in tough markets.
Whenever I share a signal, it’s because:
- A high‐probability key level has been identified on a higher timeframe.
- Lower‐timeframe momentum, market structure and volume suggest continuation or reversal is imminent.
- The reward‐to‐risk (based on that key level) meets my criteria for a disciplined entry.
***Please note that conducting a comprehensive analysis on a single timeframe chart can be quite challenging and sometimes confusing. I appreciate your understanding of the effort involved.
Important Note: The Role of Key Levels
- Holding a key level zone: If price respects the key level zone, momentum often carries the trend in the expected direction. That’s when we look to enter, with stop-loss placed just beyond the zone with some buffer.
- Breaking a key level zone: A definitive break signals a potential stop‐out for trend traders. For reversal traders, it’s a cue to consider switching direction—price often retests broken zones as new support or resistance.
My Trading Rules (Unchanged)
Risk Management
- Maximum risk per trade: 2.5%
- Leverage: 5x
Exit Strategy / Profit Taking
- Sell at least 70% on the 3rd wave up (LTF Wave 5).
- Typically sell 50% during a high‐volume spike.
- Move stop‐loss to breakeven once the trade achieves a 1.5:1 R:R.
- Exit at breakeven if momentum fades or divergence appears.
The market is highly dynamic and constantly changing. LMT signals and target profit (TP) levels are based on the current price and movement, but market conditions can shift instantly, so it is crucial to remain adaptable and follow the market's movement.
If you find this signal/analysis meaningful, kindly like and share it.
Thank you for your support~
Sharing this with love!
From HMT to LMT: A Brief Version History
HM Signal :
Date: 17/08/2023
- Early concept identifying high momentum pullbacks within strong uptrends
- Triggered after a prior wave up with rising volume and momentum
- Focused on healthy retracements into support for optimal reward-to-risk setups
HMT v1.0:
Date: 18/10/2024
- Initial release of the High Momentum Trading framework
- Combined multi-timeframe trend, volume, and momentum analysis.
- Focused on identifying strong trending moves high momentum
HMT v2.0:
Date: 17/12/2024
- Major update to the Momentum indicator
- Reduced false signals from inaccurate momentum detection
- New screener with improved accuracy and fewer signals
HMT v3.0:
Date: 23/12/2024
- Added liquidity factor to enhance trend continuation
- Improved potential for momentum-based plays
- Increased winning probability by reducing entries during peaks
HMT v3.1:
Date: 31/12/2024
- Enhanced entry confirmation for improved reward-to-risk ratios
HMT v4.0:
Date: 05/01/2025
- Incorporated buying and selling pressure in lower timeframes to enhance the probability of trending moves while optimizing entry timing and scaling
HMT v4.1:
Date: 06/01/2025
- Enhanced take-profit (TP) target by incorporating market structure analysis
HMT v5 :
Date: 23/01/2025
- Refined wave analysis for trending conditions
- Incorporated lower timeframe (LTF) momentum to strengthen trend reliability
- Re-aligned and re-balanced entry conditions for improved accuracy
HMT v6 :
Date : 15/02/2025
- Integrated strong accumulation activity into in-depth wave analysis
HMT v7 :
Date : 20/03/2025
- Refined wave analysis along with accumulation and market sentiment
HMT v8 :
Date : 16/04/2025
- Fully restructured strategy logic
HMT v8.1 :
Date : 18/04/2025
- Refined Take Profit (TP) logic to be more conservative for improved win consistency
LMT v1.0 :
Date : 06/06/2025
- Rebranded to emphasize key levels + momentum as the core framework
LMT v2.0
Date: 11/06/2025
- Fully restructured lower timeframe (LTF) momentum logic
- Enhanced entry timing for better precision and alignment with key levels

BUY/LONG ACXUSDT FOLLOWING D1 PEAKBUY/LONG ACXUSDT FOLLOWING D1 PEAK
This week, from now until the weekend, BTC is expected to correct. Let BTC do its thing—but its correction benefits pairs like ENA, PNUT, ACX, and others waiting for BUY entries. These pairs will likely reach their entry levels soon, or even dip lower, depending on how ugly the market gets in the coming days (it’s looking pretty rough).
You’ll notice ACX on H4 is currently in a corrective pullback, but don’t rush to short it. Wait for accumulation and a confirmed bottom, then LONG for the next upward wave.
Entry Buy: Wait to BUY around $0.2383.
Close Buy: Take profits around $0.36 (approximately).
Wishing you success!

ACXUSDT – Resistance Zones Marked on the Chart!
“Key levels ahead—will resistance hold or will we see a breakout?”
🔥 Key Insights:
✅ Resistance Zones Clearly Defined – Watch for strong reactions.
✅ Rejection = Short Setup – Only with LTF breakdown + CDV confirmation.
💡 The Smart Plan:
Focus on LTF (15M & 1H) Price Action – Breakout or rejection will be clear there.
Use CDV & Volume Profile – Don’t trade blindly, follow the data.
Let the Market Show the Way – We react, not predict.
“Patience + Smart Entries = Winning Trades—watch the chart, trade the plan!” 📉
A tiny part of my runners:
🎯 ZENUSDT.P: Patience & Profitability | %230 Reaction from the Sniper Entry
🐶 DOGEUSDT.P: Next Move
🎨 RENDERUSDT.P: Opportunity of the Month
💎 ETHUSDT.P: Where to Retrace
🟢 BNBUSDT.P: Potential Surge
📊 BTC Dominance: Reaction Zone
🌊 WAVESUSDT.P: Demand Zone Potential
🟣 UNIUSDT.P: Long-Term Trade
🔵 XRPUSDT.P: Entry Zones
🔗 LINKUSDT.P: Follow The River
📈 BTCUSDT.P: Two Key Demand Zones
🟩 POLUSDT: Bullish Momentum
🌟 PENDLEUSDT.P: Where Opportunity Meets Precision
🔥 BTCUSDT.P: Liquidation of Highly Leveraged Longs
🌊 SOLUSDT.P: SOL's Dip - Your Opportunity
🐸 1000PEPEUSDT.P: Prime Bounce Zone Unlocked
🚀 ETHUSDT.P: Set to Explode - Don't Miss This Game Changer
🤖 IQUSDT: Smart Plan
⚡️ PONDUSDT: A Trade Not Taken Is Better Than a Losing One
💼 STMXUSDT: 2 Buying Areas
🐢 TURBOUSDT: Buy Zones and Buyer Presence
🌍 ICPUSDT.P: Massive Upside Potential | Check the Trade Update For Seeing Results
🟠 IDEXUSDT: Spot Buy Area | %26 Profit if You Trade with MSB
📌 USUALUSDT: Buyers Are Active + %70 Profit in Total
🌟 FORTHUSDT: Sniper Entry +%26 Reaction
🐳 QKCUSDT: Sniper Entry +%57 Reaction
📊 BTC.D: Retest of Key Area Highly Likely
I stopped adding to the list because it's kinda tiring to add 5-10 charts in every move but you can check my profile and see that it goes on..

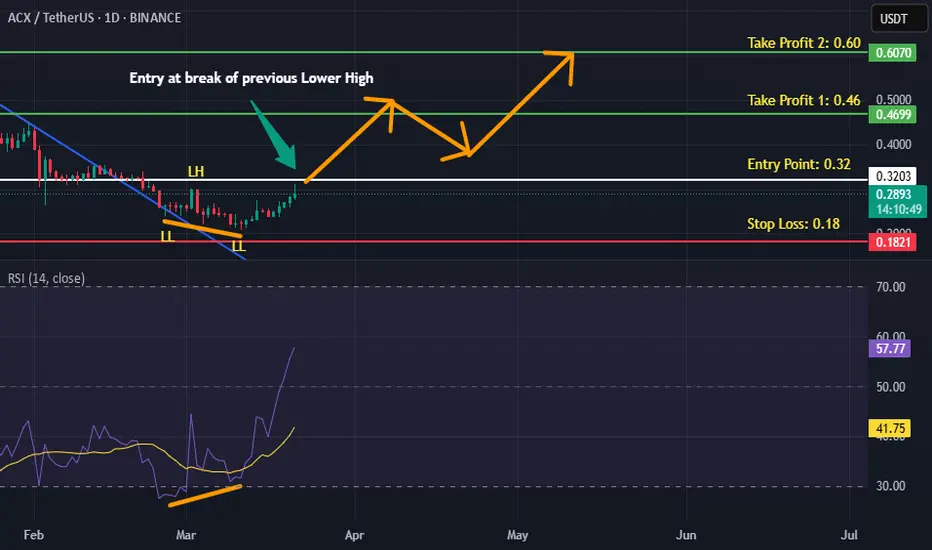
ACXUSDT is BullishPrice was in a downtrend, however it has given a breakout from the descending trendline and bulls seem to be in the driving seat now. If previous lower high is broken with good volume then we can expect a good returns as per Dow theory. Targets are mentioned on the chart.
ACXUSDT CHART ANALYSİS - EDUCATIONAL POSTDiscover what an NFT is and what all the hype is that's surrounding the space.
An NFT, or non-fungible token, is a unique, digital certificate stored on a blockchain. This guarantees the originality of any item, giving the owner exclusive rights to it. Such tokens cannot be discreetly tampered with, split, or replaced because of the nature of the blockchain structure and anonymous encryption technology.
Therefore, this system is best suited for securing rights to a unique object — a work of art, real estate, an artifact in a computer game, or something similar. This article will help you understand the peculiarities of the NFT concept and learn about the most expensive and unusual non-fungible tokens since their creation.

ACXUSDT Trading opportunityACXUSDT has just completed a potential wave 3 move and has entered corrective wave 4. We are monitoring the current price action for a potential buy-back opportunity as wave 4 unfolds, with the possibility of a strong move towards the projected final target of wave 5.
The current demand area presents a solid zone for long-term buy-and-hold positions.
Your insights and views on ACXUSDT are welcomed in the comments.

ACX/USDT potential symmetrical triangle breakout💡 The price is consolidating beautifully, and the breakout near point D shows promising bullish potential. Stay sharp and manage your risk carefully! 🔐
Let me know your thoughts or if you're riding this setup. 🚤 React 👍 and drop a comment! Let's win together! 💪
#ACXUSDT #CryptoTrading #SpotTrade #BreakoutSetup

ACXUSDT Analysis: Promising Demand ZonesThe marked blue boxes on the chart represent key demand zones that could provide excellent entry opportunities. These levels are carefully selected using advanced tools and techniques.
Key Highlights:
Demand Zones: The blue boxes are potential reaction areas where buyers may step in.
Market Context: Always consider broader market conditions before entering a trade.
Confirmation Indicators:
When trading the blue boxes, I rely on CDV, liquidity heatmap, volume profile, volume footprint , and upward market structure breaks in lower time frames to validate entries.
Learn My Techniques:
Want to master identifying these zones? DM me to learn how to use CDV, liquidity heatmaps, and other advanced trading tools.
Trade Wisely:
Remember, managing risk is as crucial as finding good setups. Stay cautious and trade confidently!
If you think this analysis helps you, please don't forget to boost and comment on this. These motivate me to share more insights with you!
I keep my charts clean and simple because I believe clarity leads to better decisions.
My approach is built on years of experience and a solid track record. I don’t claim to know it all, but I’m confident in my ability to spot high-probability setups.
If you would like to learn how to use the heatmap, cumulative volume delta and volume footprint techniques that I use below to determine very accurate demand regions, you can send me a private message. I help anyone who wants it completely free of charge.
My Previous Analysis (the list is long but I think it's kinda good : )
🎯 ZENUSDT.P: Patience & Profitability | %230 Reaction from the Sniper Entry
🐶 DOGEUSDT.P: Next Move
🎨 RENDERUSDT.P: Opportunity of the Month
💎 ETHUSDT.P: Where to Retrace
🟢 BNBUSDT.P: Potential Surge
📊 BTC Dominance: Reaction Zone
🌊 WAVESUSDT.P: Demand Zone Potential
🟣 UNIUSDT.P: Long-Term Trade
🔵 XRPUSDT.P: Entry Zones
🔗 LINKUSDT.P: Follow The River
📈 BTCUSDT.P: Two Key Demand Zones
🟩 POLUSDT: Bullish Momentum
🌟 PENDLEUSDT.P: Where Opportunity Meets Precision
🔥 BTCUSDT.P: Liquidation of Highly Leveraged Longs
🌊 SOLUSDT.P: SOL's Dip - Your Opportunity
🐸 1000PEPEUSDT.P: Prime Bounce Zone Unlocked
🚀 ETHUSDT.P: Set to Explode - Don't Miss This Game Changer
🤖 IQUSDT: Smart Plan
⚡️ PONDUSDT: A Trade Not Taken Is Better Than a Losing One
💼 STMXUSDT: 2 Buying Areas
🐢 TURBOUSDT: Buy Zones and Buyer Presence
🌍 ICPUSDT.P: Massive Upside Potential | Check the Trade Update For Seeing Results
🟠 IDEXUSDT: Spot Buy Area | %26 Profit if You Trade with MSB
📌 USUALUSDT: Buyers Are Active + %70 Profit in Total
🌟 FORTHUSDT: Sniper Entry +%26 Reaction
🐳 QKCUSDT: Sniper Entry +%57 Reaction
📊 BTC.D: Retest of Key Area Highly Likely
I stopped adding to the list because it's kinda tiring to add 5-10 charts in every move but you can check my profile and see that it goes on..

ACX COIN PRICE ANALYSIS AND NEXT POSSIBLE MOVES!! BME:ACX Coin Updates!!
• ACX Coin Look Strong as Complare to other Alts...
• Right Now price testing its feb key level... If its get rejected then in next few hours may be we see it price again b/w 0.69$-0.65$ area✅
• if price drop b/w 0.69$-0.65$ area or at 0.57$-0.54$ area then we will try to find potential trade setup!!
• On the other hand if you are holding it then just hold... When market will get stable it will pump hard as compare to ither alts✅
Warning : That's just my analysis DYOR Before follow me.

ACX - Binance pump - LONGSo ACX is on Binance now. The pump is normal. Everybody right now is taking profit. The 0.90$ is tested from there in current bullrun only up in my opinion. First will be 1.20$ then down then up again. Oppened long position at 0.92$ becasue it cannot fall more, there is no volume below 0.90$ so I belive market makers will hold this position and from here only up. Regards.

ACXUSDT 1WACX ~ 1W
#ACX This chart is very interesting to pay attention to. If this resistance block is successfully penetrated,. Then a new ATH is only a matter of time.
If you are interested in this coin,. It's best to wait for this resistance block to be successfully penetrated to buy gradually.
