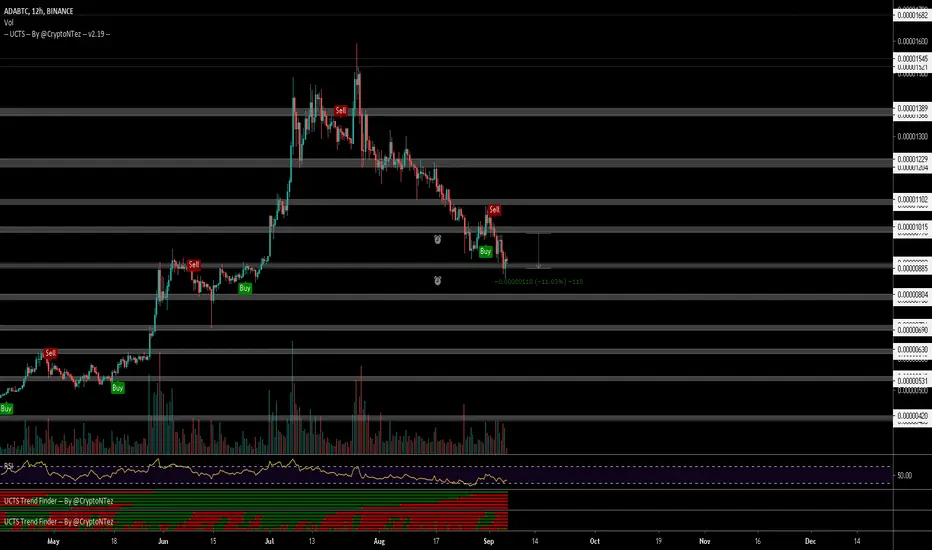
$ADA, 10% drop & now sitting above ~880sats support level...update on $ADA
10% drop & now sitting above ~880sats support level...
UCTS signaling sell signals across the board..
If BTC keeps pushing down, this will go down as well
Aim for next targets at ~800/690/630
#ADA
ADABTC trade ideas
ADA down to 900sats!?Having reached a peak of 1593sats during its recent Bullish run, ADA has been on a steady decline. The 1271sats Daily Resistance has held against multiple test and a clear bearish trend-line has been identified on the Daily TF. The Weekly TF also shows that the latest peak of 1593sats was only able to make a Lower High to that of the last peak of 1944sats made on April 1st 2019. I believe the Weekly Support of 1060sats will be lost and the Monthly Support of 900sats will be tested soon.

ADA/BTC 2D (Binance Spot) Parabolic curve on supportCardano is looking very promising for mid-term and bull trend should resume soon.
Also, 100EMA seems to be holding the price, as long as we are above it we should keep up.
You can operate it on Spot or Margin with low leverage (up to 5x).
Current Price= 0.00001030
Buy Entry= 0.00001040 - 0.00000966
Take Profit= 0.00001248 | 0.00001443| 0.00001782
Stop Loss= 0.00000807
Risk/Reward= 1:1.25 | 1:2.24 | 1:3.97
Expected Profit= +24.43% | +43.87% | +77.67%
Possible Loss= -19.54%
Fib. Retracement= 0.5 | 0.786 | 1.272
Margin Leverage= 1x | 3x | 5x
Estimated Gain-time= 2160h

ADA finds supportIf you like my TA or other ideas, please leave a like to show support. It helps me out a lot
-------------------------------------------------------------------
- ADA finds support from begin June
- Could stay within this daily range
- MACD crossover
- Bullish: breakout; TP: 1279 sats
- Bearish: breakdown; TP: 797 sats


Is the waiting over?Good day guys, I hope you're enjoying your sunday.
It has been a longtime since the last update mainly because nothing happened after the fake breakout of what appeared to be a bullish wedge first and a bull flag later. Now we have a better understanding of what we are watching here.
The support (blue line) seems to have been tested, even if we did not reached 907 sats we have hit 915 sats, close enough for a first attempt. On the usdt side we had a similar test on the support of 0.102$.
We should expect a test of the support of the potential wedge turned as a resistance now with the combination of the EMA 12 acting also as a resistance in the next 2 days. The likelihood of a rejection is more probable and would drive to a retest of the big support at 907 sats combined with the EMA 200. Ideals conditions to form a reversal candle next week on the weekly and closing the monthly in a good position to take over the resistance around 1260 sats.


Has ADABTC completed the perfect trade set up?Gradual retrace right down to the golden pocket. Final capitulation immediately before turning up. My only question is why I didn't place bids on the 70.5?
Classic example of watching the trade idea develop and waiting for the price to come to you. 3X showing massive oversell too.

ADABTC Is inside a descending channel 🦐ADABTC Is inside a descending channel, and the price created an inverse Adam and Eve on daily chart:
On the weekly chart, the price bounced on 0.618 Fibonacci Level
On the 4h chart, the price is inside a descending channel
The price must have a breakout towards up to continue the bullish momentum, IF the price will lose the weekly support, we can see a deep correction.
–––––
Follow the Shrimp 🦐
Keep in mind.
🟣 Purple structure -> Monthly structure.
🔴 Red structure -> Weekly structure.
🔵 Blue structure -> Daily structure.
🟡 Yellow structure -> 4h structure.
Here is the Plancton0618 technical analysis, please comment below if you have any question.
The ENTRY in the market will be taken only if the condition of Plancton0618 strategy will trigger.

ADA could go parabolicADA has had a decent retracement and we could be in the very beginning stages of a reversal. Already seeing some wild price action so load up whether on perps or spot.


Cardano (ADA) Falling Wedge, Bounce Coming?Cardano (ADABTC) is now breaking out of a falling wedge, a classic bullish pattern.
Prices can easily continue higher now that ADABTC is back above EMA10 and EMA50, daily candle closure is needed for confirmation.
On the retrace, support was found around the 0.618 Fib. retracement level, usually a very strong level for a reversal to take place.
We stay bullish above EMA100/EMA10.
Remember to build your own plan before you trade.
Do your own research.
Namaste.

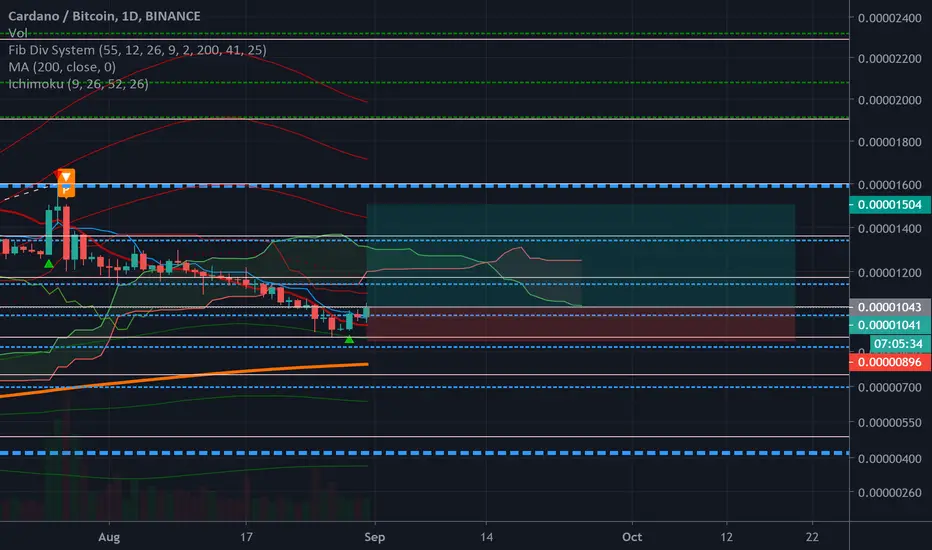
moving 200 & fib div & ichimokuHello friends
As you can see, the trend is reversing and moving towards its price peak.
My strategy is a moving average of 200 and Fibonacci and Ichimoku

ADABTC, Possible scenario!If the price will cross the Level I showed it can continue to move down till the next strong Mirror Level.
So, If you trade crypto, pay attention to Cardano these days.
The potential profit will be 3 times bigger than the risk.
Push like if you think this is a useful idea!
Before to trade my ideas make your own analysis.
Write your comments and questions here!
Thanks for your support!


ADABTC Breaker Block Re-Test Failure - Short to Daily DemandThe bullish momentum at the start of July '20, gave ADA the strength to smash through the weekly order block between 1000 and 1100 sats. This created the opportunity for a long entry in this area, if there was a successful re-test and hold. However, ADA has not been able to hold this significant level and has broken through to the downside with a solid close on the 3D candle that also broke through the ascending parallel channel.
We have now recovered slightly from this bearish move and are retesting the bottom of the order block at 1000sats. There is an opportunity for a short provided this level is confirmed as resistance. Target would be the daily demand block at around 800 sats.


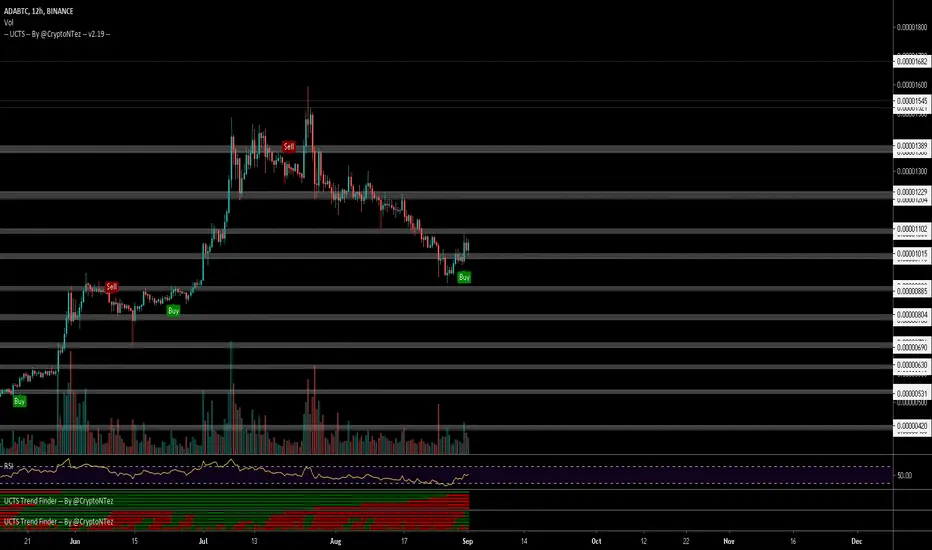
adaaccording to our analysis in august 12 ADA/BTC has reached to the target 2 . 900 sat is a very strong support and now it is expected a move for ADA up to 1135 sat in a few days coming.


ADA/BTC It has good growth potential in short termIt has good growth potential
Hi
in the chart
There is very strong support on line 880, the price may be pumped up to line 1200
Target : under 1200
Support: 880
Traders, if you like this idea or have your opinion about it, write in the comments. We will be happy
Things can change...
The markets are always changing and even with all these signals, the market changes tend to be strong and fast
Thank you for seeing idea . please support us
Good luck.
