ADA / ETH - last pair to breakADA already broke USD and BTC. On ETH, has broken downtrend, and sliced right through other resistance levels.
ADAETH trade ideas


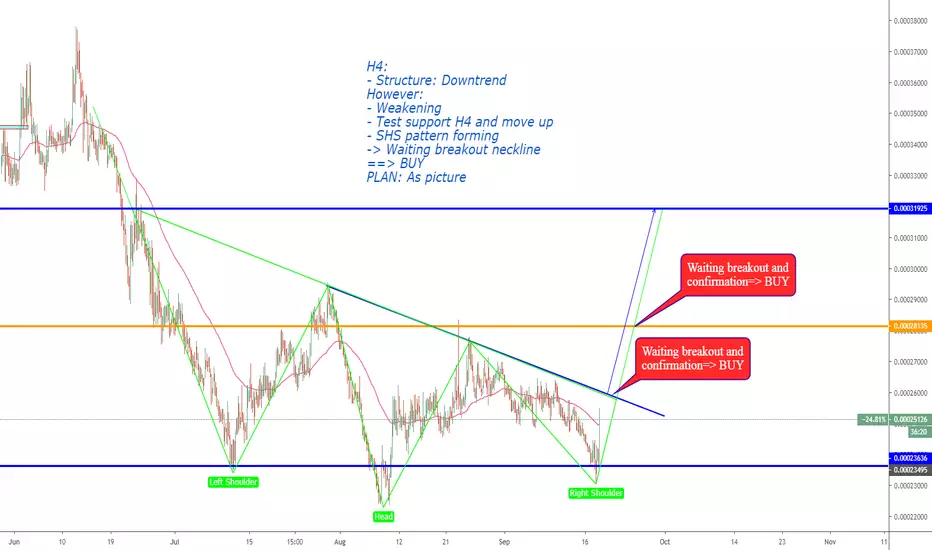
ADAETH, SHS pattern forming?!=> BUYADAETH, SHS pattern forming?!=> BUY
H4:
- Structure: Downtrend
However:
- Weakening
- Test support H4 and move up
- SHS pattern forming
-> Waiting breakout neckline
==> BUY
PLAN: As picture
ADAETH, SHS pattern forming?!=> BUYADAETH, SHS pattern forming?!=> BUY
H4:
- Structure: Downtrend
However:
- Weakening
- Test support H4 and move up
- SHS pattern forming
-> Waiting breakout neckline
==> BUY
PLAN: As picture

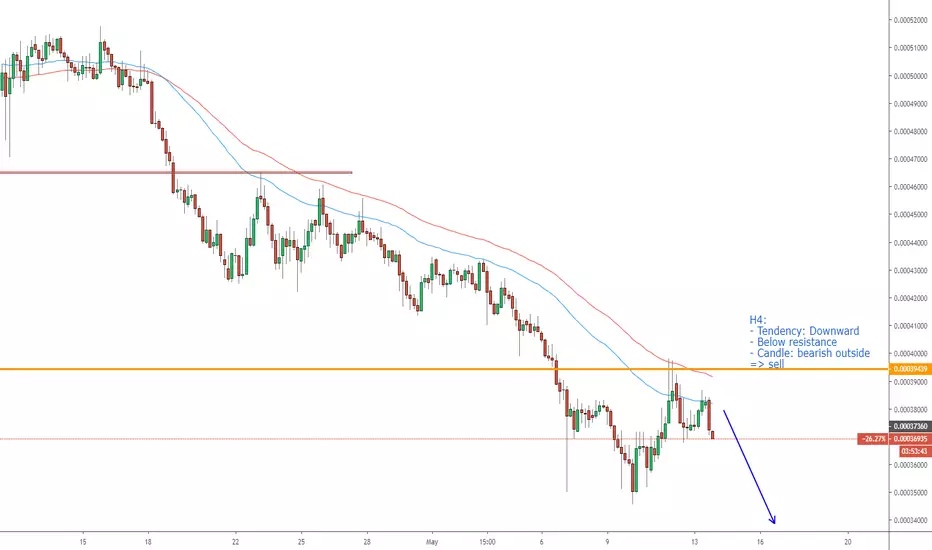
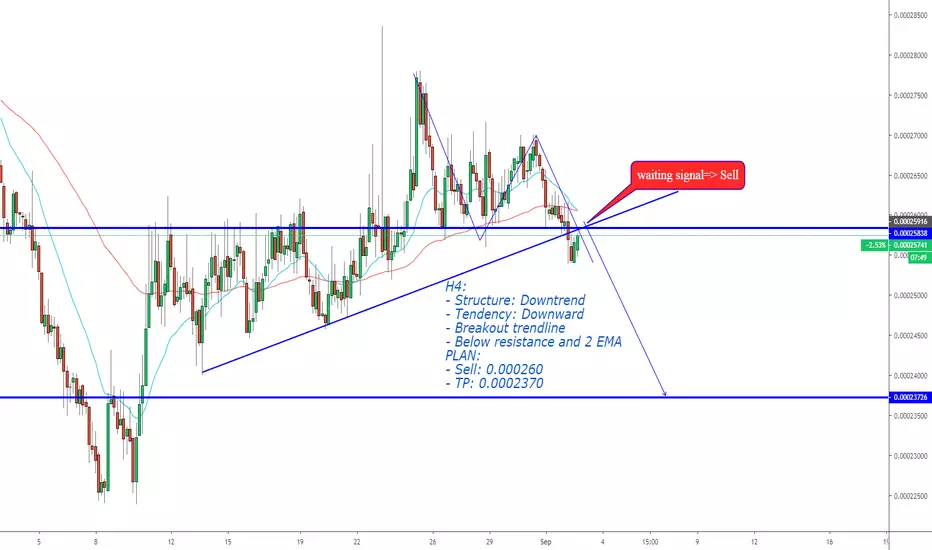
ADAETH, Sell on H4.ADAETH, Sell on H4.
H4:
- Structure: Downtrend
- Tendency: Downward
- Breakout trendline
- Below resistance and 2 EMA
PLAN:
- Sell: 0.000260
- TP: 0.0002370

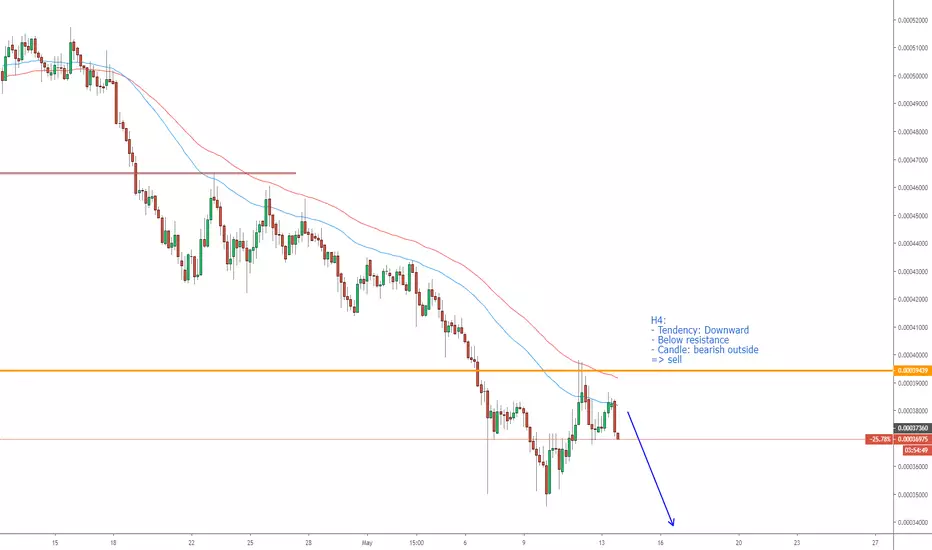
ADAETH, Sell on H4.ADAETH, Sell on H4.
H4:
- Structure: Downtrend
- Tendency: Downward
- Breakout trendline
- Below resistance and 2 EMA
PLAN:
- Sell: 0.000260
- TP: 0.0002370


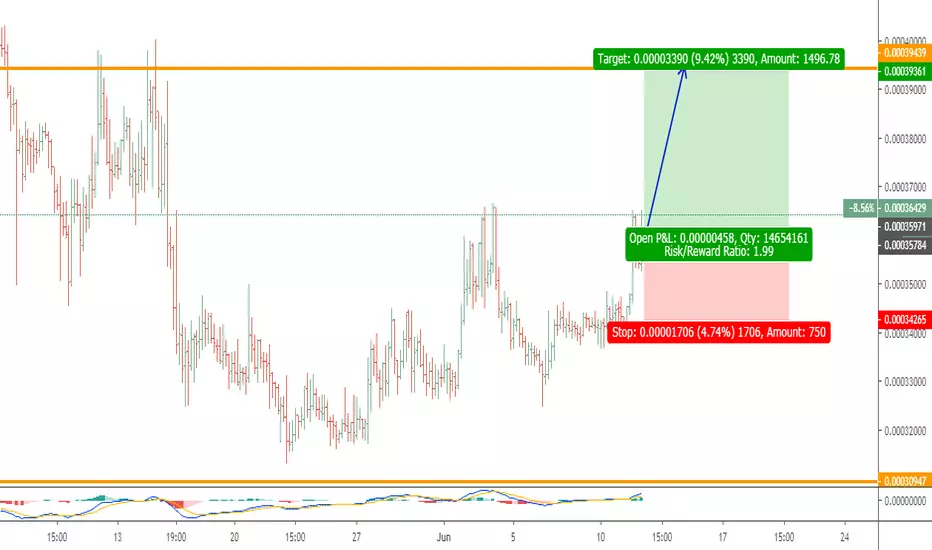
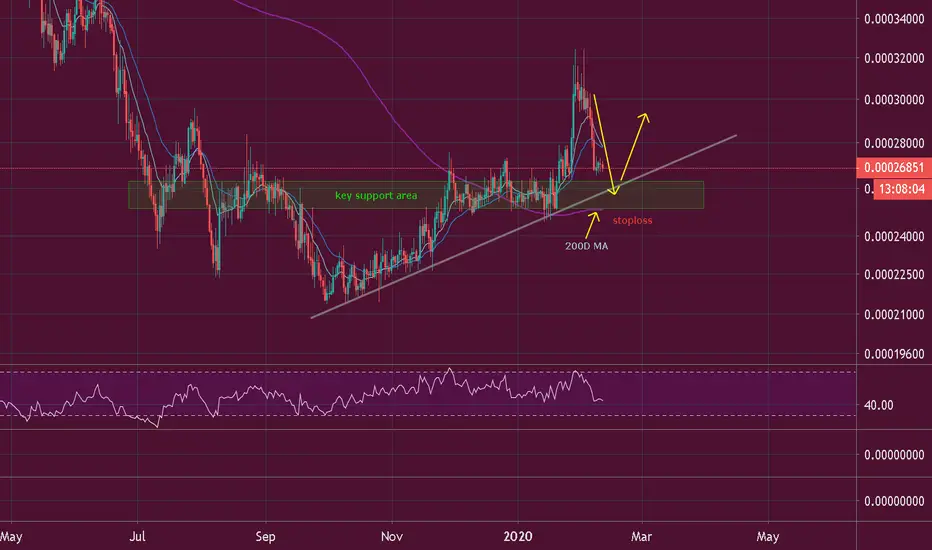
Cardano possible trade idea!Even though bearish divergence shown on chart, ADA may fall to lower to complete the chart pattern.
We will be waiting for it.
previous rise seems to be in 3 waves, if so, the low of 0.00027349 not the bottom.


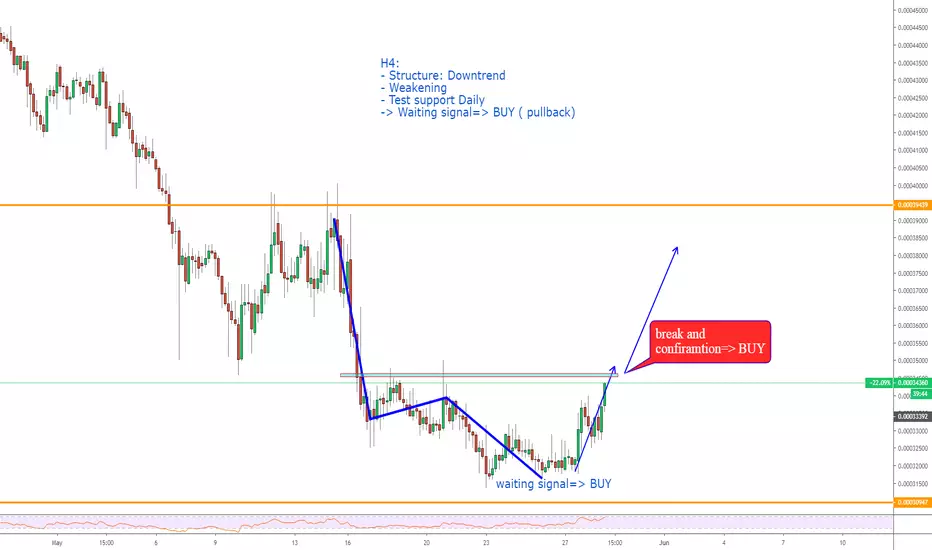
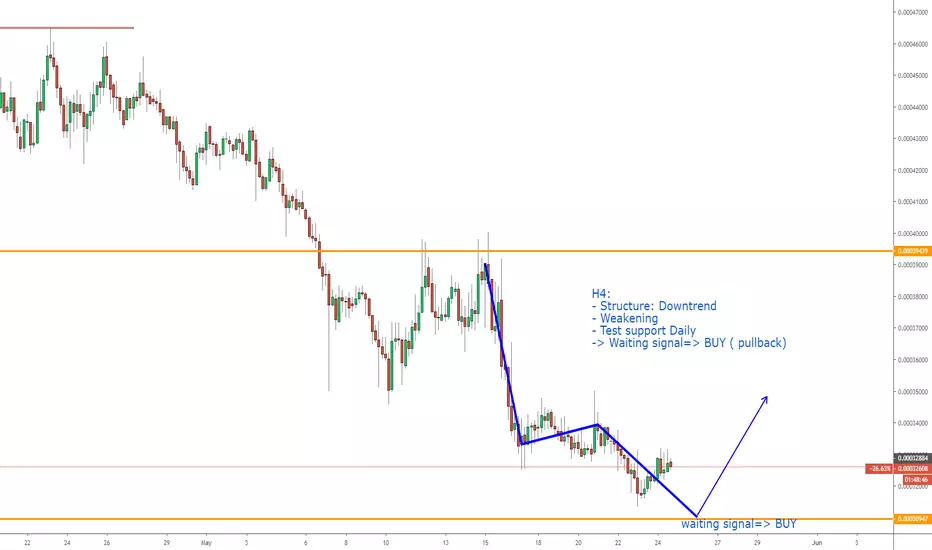
ADAETH, Pullback: BUYH4:
- Structure: Downtrend
- Weakening
- Test support Daily
-> Waiting signal=> BUY ( pullback)
monthly ADA two months selling then relief rally 4 times alreadyeom time to load up on ADA for the relief rally

monthly ADA two months selling then relief rally 4 times alreadybottom of the monthly range, EOM. Time to load up.