ADA - Cardano WishIf only life were this symetrical.
No reason it couldn't happen if the bulls came home to play.
ADAETH trade ideas


ADAETH TA SHORTTERM PLAYpossible scenario:
1. wave b of 2
2. subwave 2 of 3
RSI losing strength, favoring case 1
possible retracement back to 32600-32800, confirmed by breaking of 55 ema


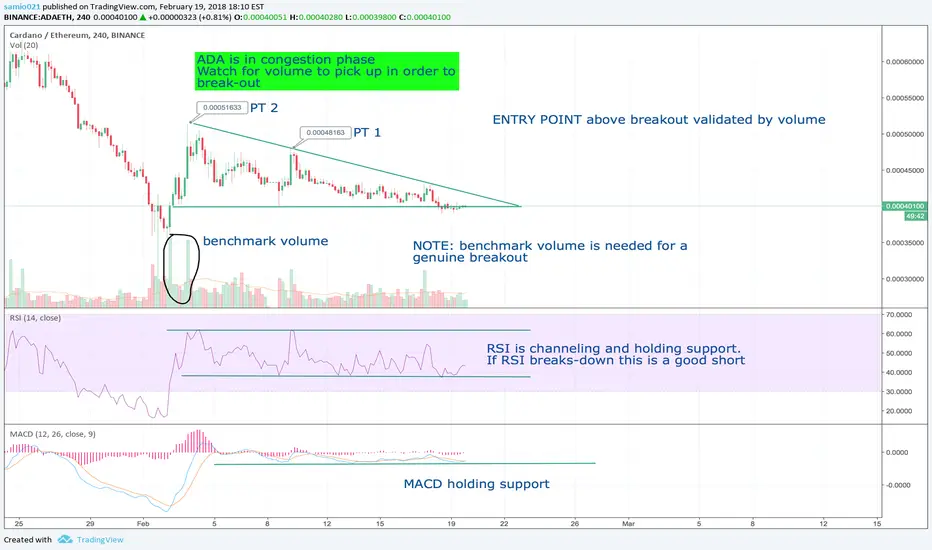
Cardano still searching for bottomSeems like Cardano is still looking for a comfortable bottom. It is continuing to trend down inside a larger descending wedge than originally thought. Though it broke out once, the attempt failed and resumed the respected wedge. We have busted through support 1, but have much stronger support 2 line along with a supporting trend from mid January to look at for our next support.

Has Cardano found bottom?Possible inverse head and shoulders forming. This could indicate that Cardano has found bottom. At any rate, this feels like a cheap buy for those looking to go long.

ADAETH Cardino slowly levelling then BullI bought into Cardino at a few spots recently in hopes of the bull as many are speculating. MACD @ 1D shows a very slow but constant rise towards 0 and this is reflected but the prices gradual levelling out. I feel there will be an initial spike once the bear gets ready for hibernation which will drop back to baseline or higher. If it drops below baseline maybe wait for more signals. After the first spike and retracting back to above baseline will trigger the full bull to come from the stables. Not a moon market yet but will be many waves to ride as it preps for lift off.
Watch for the first spike. Long now or soon, or after first retract from first spike.
This is my second crack at day trading. lets all become better off.

Support or not ?This is an interesting moment on this "support" line
ps :I have made some boughts at 0.41 recently

ADA 1D -----To the Moon-----COINBASE:BTCUSD
COINBASE:ETHUSD
AMEX:SPY
Fib Buy/sell
AdriaChain
adriachain.com
www.facebook.com
www.facebook.com
medium.com
t.me
t.me
discord.gg
Time2Pain
www.linkedin.com
www.tradingview.com
stocktwits.com
www.facebook.com
www.facebook.com
twitter.com
www.instagram.com
www.twitch.tv

ADA 1DCOINBASE:BTCUSD
COINBASE:ETHUSD
BINANCE:ADAETH
Fib Buy/sell
AdriaChain
adriachain.com
www.facebook.com
www.facebook.com
medium.com
t.me
t.me
discord.gg
Time2Pain
www.linkedin.com
www.tradingview.com
stocktwits.com
www.facebook.com
www.facebook.com
twitter.com
www.instagram.com
www.twitch.tv

$ADA $ADA.X - Carano Vs Ethereum, 1 Day BinancePeople are spending their Ether on Cardano it seems but at a low volume. The MACD shows it may cross so this is still a good indictor of a possible buy order, but it can turn false if volume doesnt pickup. RSI has fallen flat though this is still one to look at if people start pumping there Ether into the market.

$ADA $ADA.X $ADAETH - Cardano vs Ethereum, 1 Day BinanceCardano is down against Bitcoin but it is making headway against Ethereum. MACD is turning but still hasnt crossed the signal line and has pulled away from the lower Bollinger band. RSI is a little flat, though there may be a decent buy in coming is you have some ETH laying around in a few days. If MACD crosses and RSI moves up, may be a good time to get in if your looking for a buy in. This could be a false signal and if volume drops, it wont be. Keep your eye on this if your trading on Binance. As always i'm not a financial adviser so do your own research. This is my opinion.


ADA | Cardano |ADA/ETHADA/ETH
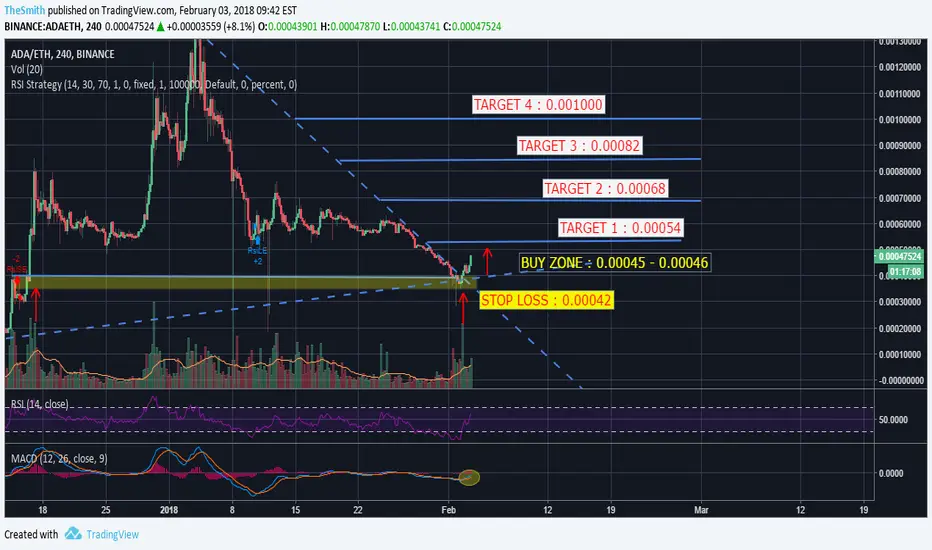
I think ADA will up with support Triangle Pattern And MACD
You can buy a fews and hold it .
Buy zone : 0.00045 - 0.00046
Profit Target :
(1) 0.00054
(2) 0.00068
(3) 0.00082
(4) 0.00100
Stop loss : 0.00042
GoodLuck Everyone
$ADA $ADAETH $ADA.X - Spending your Ether? Binance 1 DayIt seems everyone who profited on those Ethereum gains are spending there winnings. ADA is gaining some momentum, RSI is up and volume is up, but MACD is still in decline. Shows some strength but no serious reversal. The hour charts are positive results so this may be a decent buy for the next few hours. Watch the volume, once the buying stops price may fall flat or may see some short sells.

$ADA $ADA.X - Cardano on Binance 4 Hr Chart EthereumBINANCE:ADAETH
Cardano is moving slightly better against ETH. MACD looks like it may cross signaling a switch and the candle right now may signal a reversal thought RSI is still down, but the divergence is another indicator of a possible reversal. If we get the break, may see ADA break up to resistance near 54669. If buys stay we can see more gains here, though if resistance holds we may drop back. Another sign there could be a reversal is the pull away from the lower Bollinger line. Keep your eyes peeled.

ADA is on the fenceWe are currently long the position but are not adding to it. RSI gives positive indications. Fundamentals are promising and we believe 2018 will be a strong year for Caradano in general


ADAETH Short-termThe Elliot Wave pattern shows that, after the ABC correction (Pink), prices will rise again for a while following a 1,2,3,4,5 Elliot wave.
The possible bullish trend is also confirmed by the flag pattern (Teal) seen around the ABC correction. We know that the flag pattern is a continuous pattern. This indicates that after the graph breaks out of the flag, it will resume its previous pattern. Which in this case, was a bullish trend.
Feel free to critique this analysis, as I am still fairly new to this.
