ADA buy idea ADA lagging the BTC.
alt coins tend to follow BTC
trade idea here is that ADA will soon follow BTC
ADAUSD.P trade ideas

Cardano ($ADA) = Bullish Wedge FormationTarget= $0.906
Possible Entry Level= $0.771
Long term regardless without risk managment will carry momentum past: $0.806

ADAUSDT SHORT OUTLOOKHello Traders, this is outlook that i think might be work. All Entry, Stop Loss, and Take Profit its already showed up. All trade it is on yourself. DYOR.

ALT COIN LONG - ADAUSD Long setup pre altcoin run, lottery ticket #3
I don't have an extensive explanation, the chart does the talking. look for breakouts above key moving average past the recent pullback.

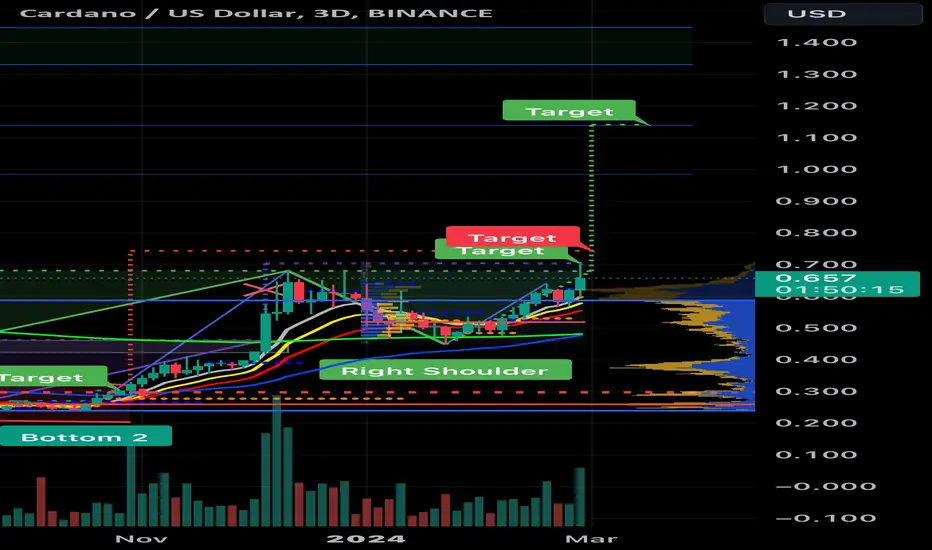
(ADA) Chart Analysis:Observing Inverse Head and ShoulderADA/USD displays a potential inverse head and shoulders pattern on the 3-day chart. If confirmed with a closing price above $0.68, technical analysis suggests a possible price target of $1.14.
Thinking of a sell maybe Just practicing so don’t mind me or the idea… thanks and trade respectfully.

LONG OPPORTUNITY IN CARDANOwe have confluence in the major support at 55, if this level is respected, we can see an impulse up to 80

Cardano's road to $ 1.00 - Ascending triangle patternAscending triangle pattern has emerged. This could trigger the road to $1 and beyond soon.
Buy after break of above line and retest.
Target: $ 1
SL: $ 0,685
Not financial advice. DYOR

Cardano.....A cup of tea in peaceWe repeat history exactly
The cup and handle pattern is exactly repeated
It stabilizes above the 200-week moving average
and flies to the moon

Get Ready to Ride the Cardano (ADA) Rocket to the Moon!Folks, if you're not hyped about Cardano (ADA) yet, you should be! This isn't just another cryptocurrency—it's a rocket ship headed straight for the moon! With revolutionary technology, exciting upgrades, and charts that look like a rollercoaster ride of awesomeness, ADA is poised for liftoff! Buckle up, hold onto your hats, and get ready for the ride of a lifetime with Cardano! 🚀🌕

ADA - Weekly Educational Bull Run Alt season chartingSimply creating charts of Alt coins for references, of how they will react to this upcoming Bull Run.

MY SELF EVALUTAIONI THINK CARDANO GO TO THE 1$ IN THE ASCEDNING CHANNEL. Moving towards the roof of the channel. Breaking heavy resistance and starting an upward rally

Short term target 1.28Breaking structure upwards. Holding breakout zone on multiple 3 day candles. Bitcoin is bullish so is everything else. Once 1.28 I’ll share next target

ada weekly ada weekly chart #ada if price action holds above the weekly, we could see next possible leg up

The bullish rally seems to have startedIt appears to be in an ascending channel.Price targets are included in the chart

Cardano | king of developer & decentralizedMany people try to daydream
But I am telling you the truth
We may be able to reach this price in super cycle conditions
Good luck
#ADA
#CARDANO

Cardano Can Retest December 2023 HighsCardano with ticker ADAUSD can be trading in a higher degree wave (5) that can retest the December 2023 highs.
Looking at the short-term hourly chart, we see it slowing down for subwave iv correction before a continuation higher for wave v of (5) towards 0.70 - 1.00 target area. Ideal support comes here around base channel resistance line and 0.58 - 0.56 area.

ADAUSD | Wave Analysis | Inverted Head & Shoulders Pattern +150%Confluent Wave Analysis with price action and chart pattern trading setup:
> The third wave correction after doubled zigzag ABC pattern forming a valid inverted head & shoulders pattern with barrier triangle ABCDE wave - with confirmation fake breakout D and E wave.
> Entry at B-D downtrend line breakout / WMA50 week
> Target 1 @ 161.8% Fibonanci extension +100% upside
> Target 2 @ 200% +150%
> Indicator: EWO - doubled bullish divergence in TFW

Ada forming a diagonal pattern in a larger wave degreeGreetings
Dear analysts and traders,
I hope you are doing well and are motivated for the week ahead. I wish you all the success in your business endeavors. Remember that success in trading lies in consistently defining and sticking to your rules.
As someone interested in the Elliott Wave Principle, I find it to be an invaluable tool for market analysis. I have developed my approach by combining this principle with my personal experience and by considering different scenarios that are likely to occur in the market. It should be noted that I do not like to be surprised in the market, and that's why I have different market prospects. I follow them to be sure and recognize the structure that is forming so that I can 100% recognize it.
I will share my analysis with you, but please note that I am not providing any buy or sell signals. My perspective on idea analysis is completely unbiased, so if the idea analysis meets your standards, you can use it as a guide to make an informed decision.
I have attached my previous analysis of the same market so that you can compare and see the differences. All the details of my analysis are clearly labeled, making it easy for you to understand. However, having a basic familiarity with the Elliott Wave Principle theory will help you understand the analytical idea more easily.
I have been studying the Elliott Wave Principle for almost three years now, and over time, my understanding of this knowledge and experience has grown. What I have achieved so far is the legacy of a genius called Ralph Nelson Eliot, and I am really happy with my progress. May peace be upon him.
Thank you for your support so far. I will always remember your kindness. Please share your comments and criticisms with me.
I hope my analysis will be useful to you in your business journey, and I wish you all the best.
Sincerely,
Mr. Nobody

Bullish month ADABullish month ADA?
Trading at $0.61
Stoch Rsi = Bullish
Rsi = Neutral > Bullish
Macd = Neutral > Bullish

Next potential target for ADAUSDNeeds to sty above both green trendlines to trigger the breakout *not financial advice*

Let's Grow UP Together "ADA"This point seems to be good..Of course with all that is happening lately!
Of course the price will go down a little more..
(If it goes down)
then it would be a good opportunity to make a good profit.
* TIPS
**watch out for big players**
***and Always ALWAYS risk management***

Cardano (ADA) Price Analysis: Bulls Eyeing $1.201 Target Amidst ADA is currently trading within an ascending channel, with the price recently testing the upper boundary.
A breakout above the channel resistance, supported by a decline in Bitcoin dominance, could propel ADA towards $1.201.
Key support levels lie at $0.618 and $0.578, which could act as launchpads for further upward momentum.
Technical Analysis:
Cardano (ADA) has been on a bullish run since the beginning of the year, gaining over 50% in value. The price is currently trading within an ascending channel, with the upper boundary acting as a strong resistance level.
Ascending Channel:
The ascending channel is characterized by two parallel trendlines, one sloping upwards and the other sloping downwards. The price action oscillates between these trendlines, creating a series of higher highs and higher lows.
Resistance and Support:
The upper boundary of the channel, currently at $0.825, is a key resistance level for ADA. A breakout above this level could signal further gains towards the next target of $1.201.
On the downside, the lower boundary of the channel, currently at $0.618, provides support to the price. A breach of this level could lead to a retracement towards the next support level at $0.578.
Bitcoin Dominance:
The recent decline in Bitcoin dominance has been a tailwind for altcoins, including ADA. A continued decline in Bitcoin dominance could provide further support to ADA's upward trajectory.
Conclusion:
The technical outlook for ADA remains bullish, with the price poised for a breakout towards $1.201. The ascending channel pattern, coupled with declining Bitcoin dominance, suggests that the bulls are in control.
However, investors should exercise caution and practice risk management, as the cryptocurrency market is known for its volatility.
Disclaimer:
This analysis is for informational purposes only and should not be construed as investment advice. Please do your own research before making any investment decisions.
