Cadrado (ADAUSD): Bearish Signal Explained
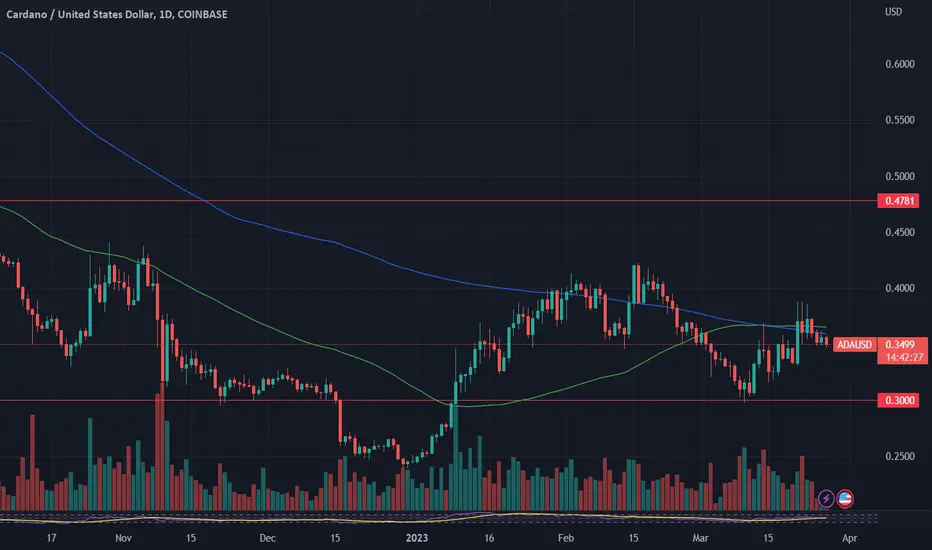
ADAUSD reached a solid horizontal daily structure resistance.
Approaching that, the price formed a double top pattern on 1H time frame.
Its neckline was broken then.
I will expect a retracement from the underlined blue zone.
Goals will be 0.365 / 0.355
❤️Please, support my work with like, thank you!❤️
ADAUSD.P trade ideas

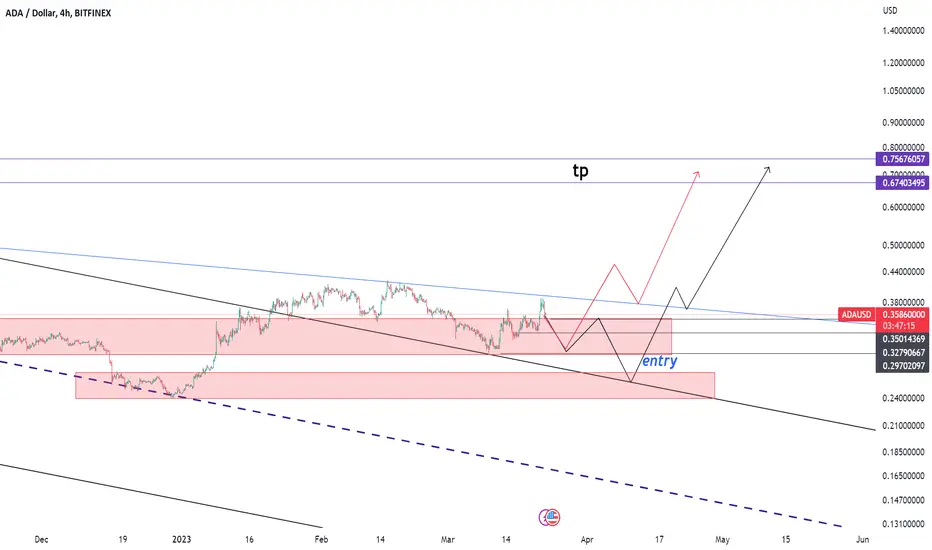
ADA Trendbreak and retest of the support levelsYou can See that ADA(Cardano) Broke the downwardtrend and retestet the so established Support Zone,after Passing this longterm baerish downtrend.
This is a confirmation, that a Trend change is coming in.
usually this Trendbreak is followed by a V-Shape Retracement to the 50-61. Fibonacci Levels, where i put the Lines.
I think we will reach the Target Zone pretty fast.

CARDANO BULLISH DIVERGENCE ABCD INCOMING, THE MOMENT IS HEREPulling back from pulling back off the pullbacks.
Short term - as we've pulled back from the recent short starting on the 22nd, we are going to enter a bearish divergence, via market sentiment and incoming Core CPE, we're looking more bullish then ever, but for the next 3 days, were seeing something bearish, but in long term bullish
Mid term - we are in a current pullback from March 10th, in the little buy boxes i have, the range is very inaccurate, the lower you go the riskier you get. given the more larger trend line that has existed as resistance, buying anywhere inside is safe. but currently, as we pull back, we are bound to hit that line again, and as everyone has anticipated for weeks and months, we are about to hit the jackpot and goto the moon!
Long term - using our Fibonacci Retracement Tool, we've previously retested this larger trend line, midway above the 786 line, i think once we confirm this 618 line, even if it breaks through the larger trend line and tests it, we should see massive, possibly and probably big gains!
chances of ADA going under 0.30 are improbable because that would in turn give a bearish divergence and idek what goes on there, but that would mean crypto goes down and theres no way thats possible anymore
4.

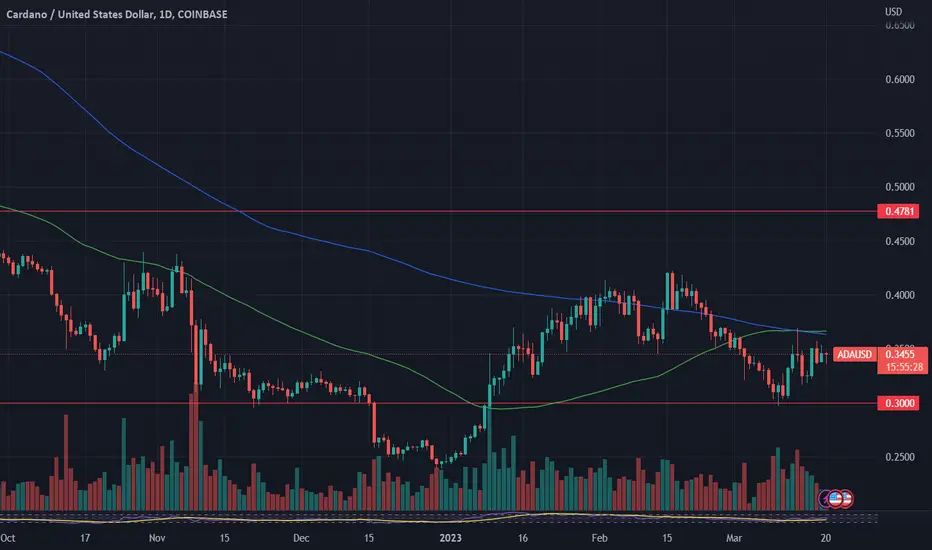
Cardano (ADA): is $0.4 next?A positive sentiment on the crypto market continued for a second consecutive week, which also supported the price of ADA. The coin started the previous week around $0.33 level, and during the week was gradually building its road to the higher grounds, till the level of $0.38. For some reason, the $0.40 resistance line is still a hard task for ADA at current turbulent times on financial markets. But, on the other hand, the increase in price shows that investors still have confidence in this coin.
During the week the RSI crossed the 50 line and moved to the highest level at 57. This could be treated as a positive signal, considering that the investors are still more oriented toward the upside, and overbought market side. Moving averages of 50 and 200 days for the last three weeks are moving side by side as one line, which is quite rarely seen on the charts. It is currently quite hard to say if the cross will occur or not.
ADA is gradually building its higher grounds, but still missing the $0.40 resistance line. If markets continue with a positive mood, this might be a target of ADA for the week ahead. On the opposite side, the coin could also modestly revert to $0.35 support, to test it for one more time.

ADA 15Min#ADA /USDT
Signal Type: Long
Leverage: Cross 20x
Entry Targets: 0.3563 ~ 0.3544
Take-Profit Targets:
1) 0.3625 ( 35%)
2) 0.3669 ( 60%)
3) 0.3700 ( 80%)
4) 0.3740 (100%)
5) 0.3800 (123%)
6) 0.4100 (300%) 🚀
Stop-Loss: 0.3460 (-56%)

Cardano ADA LONG, Bearish short term MASSIVE EXPLOSION TO 0.60$None of this is advice, this is what im looking at. could we maybe see that kiss at 0.31$ and see a massive upside? i know im buying the dip


ADA/USD ANALYSISEntry points in the transaction are specified
Enter with the right volume and stick to the goal

Buy this crypto Break and retest monthly time frame demand being form . Price is at a quarter point between 0.0 and 1.0 buying at the 0.25 minor quarter point. Rejection and buy

Cardano looking bullish on the monthlyCardano ADA looking bullish on the monthly as the monthly RSI is about to break out (crossing of RSI Moving Averages) as well as the price action.

Cardano (ADA): small potentialPrevious week was generally positive for the crypto market, regardless of the fact that very unfortunate events led to this surge in prices. Although the price of ADA did not make some extraordinary jump in value on the weekly level, still, it is positive to see that this coin has its own audience of investors, waiting for the moment to get back into this coin.
During the previous week ADA was moving in a range of $0.31 up to $0.36. Still, the coin is finishing the week around the $0.35 resistance line. The RSI was modestly pushed above level of 50, reaching the 55, indicating that the market is just gearing for the overbought side. Interesting development with MA50 and MA 200 is continuing for the last three weeks, as both lines move together as a one line, still missing to provide clear view, if the cross actually occurred or not.
With the start of the week ahead, ADA will continue to test the $0.35 resistance line. In case that there is market strength for a move to the higher grounds, then level of $0.37 might be a next target. However, in case of a short reversal, the coin might again look at the $0.32 level.
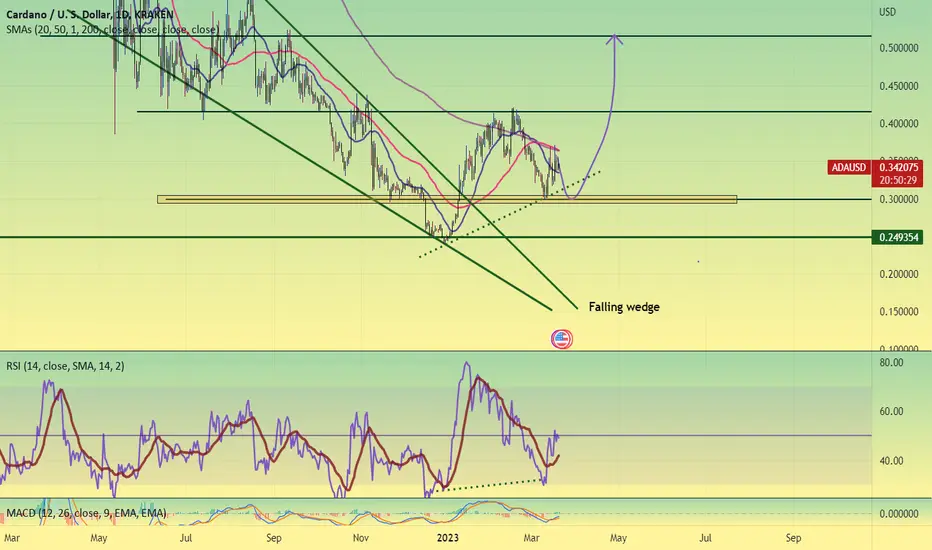
cardanohey everyone,
ada is picking up good volume and recently break out of the falling wedge, price may or may not retrace to 0.30 but that is the main support as of now...
price can only fall below 0.24 if overall crypto crashes... previous resistance was 0.40 so most likely it'll break this time if price is bullish and the next estimated
target is 0.50 to 0.60
good luck
Nesting periodThe price action suggests that we have possibility to see the nest, the 'basis' of a powerful jump. 1-2 1-2, 3 of a 3 of a 3 in progress!

Nesting... 3 of a 3 of a 3 in progress...It seems like the cardano building up a massive price basis on lower timeframes.

ADA LongBullish environment, BTC leading the way but alts should follow. ADA forming nice cup and handle to compelte a head and shoulders. break 36 and we should fly

ZEUS Bullish MACD Setup - High Accuracy of Winning TradesOur MACD Setup is created to reveal winning entry points for a trade with high accuracy.
In our MACD Setup we combine multiple conditions to recognize only strong entry points.
Multiple factors need to be met in confluence:
1. Recognize the Trend = Bullish / Bearish Trend (50 EMA is Above / Below 200 EMA)
2. There is a MACD Cross = Bullish / Bearish MACD Cross (MACD Cross is Below / Above Zero Horizontal Line)
3. Avoid False Signals in a Sideways Markets = MACD Cross far from horizontal zero “0” line
4. Filter only Strong Trend Situations = Candle Close above/below 200 EMA
5. Avoid Extreme Values in RSI = check if there is way to go before we get oversold/overbought
6. Our Algorithm Filters Signals in Side Trend and Low Volume Markets
Let´s explain the conditions step by step
1. Recognize the Trend
Exponential Moving Average (EMA) is one of the most effective trend identification indicator. Traders like it because of it its simplicity.
EMA is usually used in combination between 200 days (as a slow indicator) and 50 days (as fast indicator of the trend).
Bullish Trend = EMA 50 is Above EMA 200
Bearish Trend = EMA 50 is Below EMA 200
2. There is a MACD Cross
After we recognized the Trend (Bullish Trend in our case) we would like to trade with the trend so we are looking for Bullish MACD Cross.
Bullish MACD Cross is Below Zero Horizontal Line
3. Avoid False Signals in a Sideways Markets
So we found Bullish MACD Cross and now we want to be sure that the Cross far away from the Zero Horizontal Line.
Our algorithm filters crosses and shows only signals with decent distance form Zero Horizontal Line.
4. Filter only Strong Trend Situations
Once we have met the first three criteria (Bullish Trend and Bullish MACD Cross far from Zero Horizontal Line) we need confirmation that the market is still strong and is moving forward in an uptrend.
So we look at price action and there need to be Candle Close Above EMA 200 . Closing about EMA 200 indicates continuation of the trend.
5. Avoid Extreme Values in RSI
The other condition is based on RSI and we are looking only for situations where RSI is not overheated so there is a way for trend continuations.
In our case RSI was in the middle values so we can expect market to continue its uptrend.
6. Our Algorithm Filters Signals in Side Trend and Low Volume Markets
We have developed our own Algorithm which filters signals in low volume markets and side trend.

Cardano's Bear RunBull market followed by bear market.
Bear market followed by bull market.
Bull run followed by bear run.
Here I am mapping for you Cardano's (ADAUSD) bear run.
Namaste.

Is ada making an inverse head and shoulder pattern?
In my idea ADA is making an inverse head and shoulder pattern. Once the neckline breaks, the next stop could not 0.62 - 0.65 cents with some take profit steps on the way.

Support and Resistance Levels for ADAUSDThe trade plan is discussed in chart .You can either play in Range , buying at S1 Or Selling at R1. Incase it breaks S1 and S2 your Sell stop will trigger and if it breaks R1 and R2 then your buy stop triggers. Always use stop loss.


