ACCUMULATE ADA - 5daySeems time to accumulate CRYPTO:ADAUSD if you are in the know about Cardano.
- Fisher Transform Indication bands need to align themselves.
- Price will bounce around tightly packed moving averages between .32 cents and .44 cents.
- Price breakout to occur early Aug to early September.
- Volume structure also indicates this breakout.
- Historical volatility also on the decline which also reinforces this breakout period.
ACCUMULATE,
seanders
not financial advise
ADAUSD trade ideas

Cardano (ADAUSD) Possible Bearish Move.Cardano on a downtrend, with a possible continuation for sells, price heading to the sell zone after a BOS.
Remember: Risk Management Very Important.

A potential decend trade on ADAUSD..Based on Elliot wave analysis, i saw ADAUSD has completed its wave 2, right at 61.8 fibo level, or it can be possibly find as wave B of its A-B-C correction. Either way, it's time to go up..
Take a look on the chart to see my 1st and 2nd target.
Good luck!
CHEERS!

Cardano to $7Everything suggests it's likely to happen. Cardano is a leading & innovative Blockchain technology & it's about to get decentralised. Chang HardFork.

Cardano (ADAUSD) Possible Bearish Move.Cardano on a downtrend, with a possible continuation for sells, price heading to the sell zone after a BOS.
Remember: Risk Management Very Important.

Accumulation - 8hrDespite what price action represents, ADA has been accumulated over the last 10 months.
Trust where the money goes, regardless of what they say to bring price down

ADAUSD- Preparing for a long up viewADAUSD- Preparing for a long up view
-Demand zone support.
-Tweetzer candles confirm bottom.
-Inversed HnS scenerios.
.
Wait and see!
ADA Expanded Flat correction?I am short-term bearish on ADA because, in the 15-minute timeframe, I can see a bearish divergence on the RSI. I will wait to see how it plays out before entering into a long position.
I am sharing my thought process on these market moves and adjust my analysis as the market evolves. This is not meant to be followed by others, as I am prone to mistakes like anyone else. Instead, I welcome feedback that can help me question and refine my analysis.

ADA, CAN IT BE PART OF THE DIGITAL GOLDRUSH?ADA chart
RSI favorable on smaller charts, not so favorable on bigger charts.
Potential to see a dip and BIG run.
One support trend.
Buy zone marked
Price targets marked
Potential to see a wick down to 10 cents, but lots of potential to hold that sub 30 cent price.
I'd be patient, and see what happens before jumping in, but having said that, short term could rocket the price, however, it really needs to clear 63, in my opinion.
I think the potential is there to see a quick drop to price targets and a run to all time highs, which aligns with a lot of the crypto market.

(ADA) CARDANO Strong signal indicating the price of Cardano is potentially heading upward. Variable exponential moving lines measured to create two lines that option the risk to favor a simple and direct approach to seeing a simulated trend ahead of time.

Cardan (ADA) to take a breather before moving higherSome key things to look out for on #Cardano 's daily chart:
◦ Major gaps between the bodies of the candlesticks and the Tenkan-Sen. The two don't like to be far away from each other, they're like an unhealthy co-dependent couple.
◦ Senkou Span B is the strongest level of support/resistance within the Ichimoku system.
◦ The RSI and DTO are at historical resistance levels.
👉 It looks like things might hover around here for the next few days while the Tenkan-Sen catches up to where price is presently at.
👉 That will give some equilibrium to be re-established before CRYPTOCAP:ADA makes another drive higher.
If there is a pullback, it should be limited to the $0.39 - $0.40 value areas.
tinyurl.com

ADA prepre LONG position for waves 5ADA prepre LONG position for waves 5 and preprep next one position for long term LONG good LL. I prepre PPContracts. L.

Alternate Theory - 2026 BullI've actually had this theory for awhile, after watching Ben Cowen talk about lengthening cycles. Bull run of 2026 but this has a low percentage of actually happening in my opinion. We'll see when fed actually cut rates and by how much.
I'm just pulling Cardano, Solana, and Chainlink for examples because they fit nice on the chart. But BTC will drop down to 39K in the event.
It only makes sense either to make a bottom at this current position or to return to previous long-term lows. Solana will get hit the hardest, washing out all the garbage.

CardanoIf it were a h1 chart - I would jump in immediately)
But... Given the fact, that fractals are the same for Weekly and even Minutes charts, this structure makes a lot of sense to assume that ADA is going to deliver a fantastic growth.
Impluse, followed by a three-waves correction (WXY/ x2 ZZ).
Fits nicely within a channel, respecting its median at key points.
Will see. Hoping this time it flies, with the rest of the market

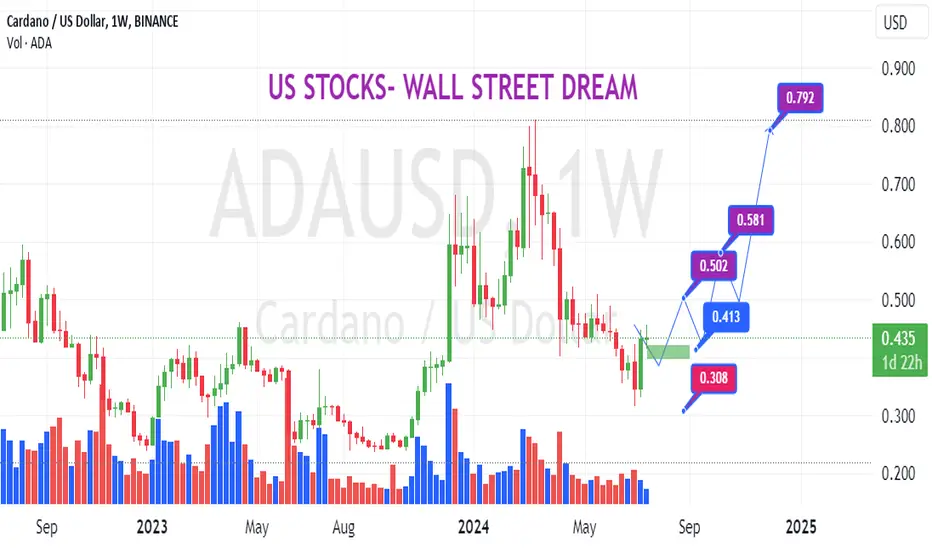
Cardano: Ready for Take-OffWe consider the magenta-colored wave (ii) interim correction to be complete and expect an impulsive rise to above the resistance at $0.81.

ADA Bull Run Insights: Historical Patterns and Future ProjectionIn this detailed analysis of Cardano (ADAUSD), we examine the current support level at $0.333, which is proving to be a significant point for potential gains. Should this support hold, ADA could see a substantial increase. However, if it breaks, the next strong support is around $0.24, where a bounce is highly anticipated due to upcoming positive events and the nearing approval of Ethereum ETFs. These events could trigger a rally in altcoins, likely to be observed in Q4 2024. Historically, bull runs have been characterized by high volatility and substantial price rises, which we expect to see again.
For the upcoming bull run, Cardano's target is projected to be at least $7, based on historical performance and calculations. If ADA flips the $7 resistance by February 2025, we could see a maximum target of $9.11. Cardano, listed during the September 2017 alt season, yielded a 7322% return and an impressive 15556% return during the 2021 bull run. For 2025, we are anticipating a return of approximately 3750%. ADA is currently forming an uptrend with its maximum resistance projected at $9.11. Historically, bull markets have seen unexpected price pumps, and we can expect similar volatility this time. It is crucial to monitor S&R zones to keep trades active and plan to exit long positions around March or August 2025.
For more detailed analysis and future trading ideas, follow us on TradingView. Share this idea with your friends and family to maximize profits. Please like, comment, and engage with our posts for more insights. Thanks!

ADA/USD: capitulation to the 0.10-0.13 areathe correction in ADA/USD has completed a 5 wave structure to the downside, the start of a zig-zag pattern
it is followed by what appears to be an expanded flat
based on Elliott wave theory, there will be 5 more waves to the downside
there is a high risk of capitulation given current sentiment
most likely region of support is the 0.10-0.13 region

Cardano Is approaching the downtrendHey Traders, in today's trading session we are monitoring ADAUSDT for a selling opportunity around 0.410 zone, Cardano is trading in a downtrend and currently is in a correction phase in which it is approaching the trend at 0.410 support and resistance area.
Trade safe, Joe.

Everything Suggests 33c Cardano ADACardano broke down from it's consolidation structure and is now headed to the next level at 33c.
33c is:
- The next major level of support
- The 1.618 of a bullish butterfly (although not perfect)
- The exact measured move of the triangle
We had a bullish bias towards this consolidation structure, as we did for many of the altcoins, however that has now changed and we flipped bearish on the market short - mid term.
We managed to get out of the posted positions early before having to take significant losses.
Now the game plan is to short assets like cardano until they reach the next level or a bullish structure develops. The bearish bias will remain until this changes and we will constantly update. We will also not own or buy any of these assets until then.
As of right now we are short from 42.3c and will update with continuation patterns. We expect this to last a month or two from now before getting a clearer long term picture.

Cardano - Bullish OverviewMassive support level is coming at 0.3720. An upside reversal is highly likely at this point. We're flipping over and establishing a bullish campaign with the primary profit target at 0.4950

elliptical rhyming
Elliptical rhyming based on long-term observation, this idea builds on economic cycles and considers technological improvements and adoption of Cardano at the same pace.

Cardano will have a nice runADA will create the right shoulder of a bigger H&S on higher timeframes and will reach 14-25$ in wave 3.
And it will top out probably on a Monday... ;)

ADA Price Action#ADA has a bearish price action( Classic & ICT). Depend on #BTC price action as a catalyzer, I anticipate a correction to $ 0.24 before the next bullish movement.
