ADA/USD: Wave 2 correction or something more sinister going on?For what it was looking like a very bullish 1/2, 1/2 setup last week, now has invalidated after price broke down below $0.45 today. However, it is still within the parameters of an expanded B wave and now a C wave for minor wave 2. The wave 3 of 3 of C has been incredibly strong as it should, and we should see a relief rally for wave 4 shortly. An incredible re-buying opportunity will present itself at the golden zone $0.35-$0.34 area but it must be with some caution. If price falls below $0.3, then the bearish scenario of this entire rally since last Oct being a 3 waves move becomes more probable and a more price breakdown may ensue to continue the intermediate Y wave toward $0.15. For now, I am sticking with the bull case and have some fiat ready to convert.
ADAUSD trade ideas

ADA → Cardano to $0.40? or $1.40? Get your Longs Ready!ADA completed its 230% price increase since October 2023 and now appears to be finding some resistance. Should we short here?
How do we trade this? 🤔
Shorting is not ideal on the Daily timeframe. Since October 2023, ADA has put in three legs in a bull trend, a double-top reversal pattern that has come off of an ascending wedge (bearish pattern). We're now finding resistance below the Daily 30EMA with a gap down to the Daily 200EMA. This analysis screams a two-legged pullback to the 200EMA, likely in alignment with the Bitcoin halving that's about to happen in April 2024.
Short on the 1HR timeframe, but get your equity ready for a long position when ADA comes into contact with the $0.53-$0.57 price area. Look for a strong bull candle closing on or near its high off of the Daily 200EMA, this is our signal bar and a reasonable one to enter on with a 1:2 Risk/Reward Ratio, aiming for a conservative target of $0.775.
A confirmation bar should take us somewhere in the $0.60-$0.65 range. If we see this, given the crypto market's similar sentiment after the halving, it's reasonable to enter at a 1:2 risk reward aiming for the $1.20 area. It's reasonable to take half profits at 1:1 Risk/Reward and swing the latter half of your position to 1:2, 1:3, or even 1:4 Risk/Reward on this timeframe, depending on how the price action plays out.
This analysis is in alignment with my recent ADA Lifetime Analysis as seen here:
💡 Trade Idea 💡
Long Entry: $0.55
🟥 Stop Loss: $0.4375
✅ Take Profit #1: $0.663
✅ Take Profit #2: $0.775
⚖️ Risk/Reward Ratio: 1:2
🔑 Key Takeaways 🔑
1. Three legs in a bull trend
2. Double top reversal pattern which has come off of an ascending wedge (bearish pattern)
3. Finding resistance below the Daily 30EMA with a gap down to the Daily 200EMA.
4. Look for a 2-legged pullback to the 200EMA, likely in alignment with the Bitcoin halving that's about to happen in April 2024.
5. RSI is at 48.00 and Above the Moving Average, supporting the idea of a pullback to the 30.00 area below the Moving Average.
💰 Trading Tip 💰
It's reasonable to take half profits at the first resistance target in a long trade or the first support target in a short trade. Using a 1:1 Risk/Reward Ratio for your first target, you can move your stop loss up to your entry price, locking in profits. This allows you to watch the rest of the trade execute without worrying about losing money, which helps improve trading psychology and the equity in your account.
⚠️ Risk Warning! ⚠️
Past performance is not necessarily indicative of future results. You are solely responsible for your trades. Trade at your own risk!
Like 👍 and Follow to learn more about:
1. Reading Price Action
2. Chart Analysis
3. Trade Management
4. Trading Psychology

ADA Crashed! I ran out of money!!!My alerts where going crazy!! Why is the whole market crashing? I have to buy quick!! I usually Buy $300 each trade, but topping up my account takes 3 days and we don't have time! I just bought $50 worth of ADA for a minimum 20% gain in a few days!!

Bullish scenario 1.2 and 1.2! or sideways pattern for wave 2Esteemed analysts and traders,
I hope this correspondence finds you in good health and high spirits, prepared to tackle the upcoming week with renewed energy. I extend my best wishes for your continued success in all your business endeavors. It is worth noting that success in trading is largely dependent on the consistent definition and adherence to one's own rules.
As a supporter of the Elliott Wave Principle, I consider this methodology an invaluable tool for market analysis. After three years of personal experience, I have developed my approach by combining this principle with meticulous consideration of different market scenarios. I strive to avoid market surprises by maintaining a range of market prospects, which enables me to recognize the market structure forming with 100% accuracy.
I am pleased to share my analysis with you, with the caveat that I do not provide buy or sell signals. My perspective on idea analysis is entirely impartial, and if my analysis meets your standards, it may serve as a guide to making an informed decision.
For your reference and comparison, I have attached my previous analysis of the same market. All the details of my analysis are clearly labeled for ease of comprehension. Nonetheless, familiarity with the Elliott Wave Principle theory would facilitate an understanding of the analytical idea.
My study of the Elliott Wave Principle took nearly three years, during which my understanding and experience with this invaluable tool have grown. My progress thus far is a testament to the legacy of Ralph Nelson Eliot, whose genius has provided the foundation for my achievements. May he rest in peace.
I express my gratitude for your continued support and kindness, and welcome your comments and critiques.
May my analysis be a valuable asset to your business journey, and I remain sincerely yours,
Mr. Nobody

Five wave ups and now a sideways correction patternEsteemed analysts and traders,
I hope this correspondence finds you in good health and high spirits, prepared to tackle the upcoming week with renewed energy. I extend my best wishes for your continued success in all your business endeavors. It is worth noting that success in trading is largely dependent on the consistent definition and adherence to one's own rules.
As a supporter of the Elliott Wave Principle, I consider this methodology an invaluable tool for market analysis. After three years of personal experience, I have developed my approach by combining this principle with meticulous consideration of different market scenarios. I strive to avoid market surprises by maintaining a range of market prospects, which enables me to recognize the market structure forming with 100% accuracy.
I am pleased to share my analysis with you, with the caveat that I do not provide buy or sell signals. My perspective on idea analysis is entirely impartial, and if my analysis meets your standards, it may serve as a guide to making an informed decision.
For your reference and comparison, I have attached my previous analysis of the same market. All the details of my analysis are clearly labeled for ease of comprehension. Nonetheless, familiarity with the Elliott Wave Principle theory would facilitate an understanding of the analytical idea.
My study of the Elliott Wave Principle took nearly three years, during which my understanding and experience with this invaluable tool have grown. My progress thus far is a testament to the legacy of Ralph Nelson Eliot, whose genius has provided the foundation for my achievements. May he rest in peace.
I express my gratitude for your continued support and kindness, and welcome your comments and critiques.
May my analysis be a valuable asset to your business journey, and I remain sincerely yours,
Mr. Nobody

ADA Drops to Last Place in the Top 10 CryptocurrenciesADA Drops to Last Place in the Top 10 Cryptocurrencies
ADA, the native blockchain token of the Cardano network, has dropped to 10th place among the cryptocurrencies with the largest capitalization. Today, according to CoinMarketCap, the capitalization of Cardano (ADA) is USD 20.7 billion.
On the one hand, this happened due to the success of such competitors as:
→ Dogecoin (DOGE) with a capitalization of USD 27.1 billion, approximately +108% since the beginning of the year;
→ Toncoin (TON) with a capitalization of USD 23.7 billion, approximately +193% since the beginning of the year.
On the other hand, the ADA/USD rate behaves weaker than other cryptocurrencies. Year to date, it has dropped by several percent since January 1, 2024. And this is against the background of a bull market, which should greatly confuse investors.
Will Cardano (ADA) be able to strengthen its position in the top 10 cryptocurrencies?
Bulls' hopes may be tied to the approaching Chang update (expected in the second quarter of 2024), which will implement the concept of a self-governing community on the blockchain by introducing delegate representatives (DReps) and community voting to approve the first draft of the Cardano Constitution.
Technical analysis of the ADA/USD chart today shows more bearish signals:
→ the price of ADA/USD moves within the ascending channel;
→ the important level USD 0.6800 again acts as resistance (as shown by the arrows);
→ the price tried to push off from the lower border of the channel, but was unable to gain a foothold above the psychological level of USD 0.6000.
The level of USD 0.5700, reinforced by the lower border of the channel, acts as the most important support in such a situation - its breakdown will open the way to the psychological level of 0.5000 and the minimum of the year in the area of 0.4500.
Given the failure of the ADA/USD price to follow trends in the cryptocurrency bull market in early 2024, such a scenario looks likely.
*At FXOpen UK and FXOpen AU, Cryptocurrency CFDs are only available for trading by those clients categorised as Professional clients under FCA Rules and Professional clients under ASIC Rules respectively. They are not available for trading by Retail clients.
This article represents the opinion of the Companies operating under the FXOpen brand only. It is not to be construed as an offer, solicitation, or recommendation with respect to products and services provided by the Companies operating under the FXOpen brand, nor is it to be considered financial advice.

ADAUSD SHORT TERM CHANNEL - HIT 0.90 USD Found channel support. Expect to go up and hit USD 0.90 next.

ADA - break or bounce?With a strong upward momentum, will it continue to go up and break this consolidation or will it bounces off and goes down?

CARDANO - A POSSIBLE PATTERN (FEB 2024)CARDANO - A POSSIBLE PATTERN (FEB 2024)
Anticipating significant gains for Cardano holders in the upcoming bullish market, I also foresee the possibility of this trend continuing in the long run.

Cardano Bullish SpringCardano Bullish Spring?
Current price: $0,57
Coinmarketcap ranking: 9
Chart:
Falling wedge with potential to rise above previous high $0.80?
Bullish or Bearish
Stoch Rsi = Bullish
Rsi = Neutral > Bullish
Macd = Neutral > Bullish

ADAUSD: A BOUNCE OF SUPPORT, A FOUR HOUR REJECTION CANDLEADAUSD bounced of a trend line support and a rejection candle was formed on a four hour time frame. the market looks bullish right now and i am already in on a buy with the swing high above it as my target profit

Cardana ADA bullishI am not a financial advisor. This is not meant to be and does not constitute financial, investment, trading, or any other types of advice or recommendation.

ADA/USD Hitting Targets and Riding the RollercoasterAlright, fellow traders, let's dive into the wild world of ADA/USD trading with a splash of humor! So, last time we checked, we were hitting those TP targets like a boss – just in time for the previous bull cycle to say "See ya later!" and take a nosedive below $1.00. Classic crypto, am I right?
But fear not, my friends, because after some serious structure review and fib level analysis (because who doesn't love a good fib?), we stumbled upon another harmonics pattern. And guess what? It's pointing us straight down to our middle leg, converging with some juicy fib levels and previous structure at that sweet ~$0.40 level. Keep those lower timeframes in check though, because we need that confirmation that it's playing nice as support.
Now, let's talk targets. We're eyeing that $1.00 mark, and if we break through and treat it like the VIP it is, well, hello there, previous ATH! Feeling ambitious? How about shooting for the stars with that 127 fib level, sitting pretty at ~$6.00. Aim high, my friends – the sky's the limit!
Oh, and before I forget, let's give a shoutout to those ADA fundamentals. Because let's be real, in the crazy world of crypto, they matter more than you think.
Remember, it's all about probability – no trading advice here, just a friendly reminder to play it safe and embrace that dollar-cost averaging life. And hey, maybe investing is the way to go – less stress, more chill.
Here's to riding the ADA wave with a smile on our faces and a whole lot of memes in our hearts. Good luck out there, traders!
Keywords: ADA/USD, trading analysis, crypto humor, hitting targets, bull cycle, harmonics pattern, fib levels, support levels, resistance levels, trading advice, dollar-cost averaging, investing, ADA fundamentals, ambitious targets,


ADA Long - H1 TimeframeThe downtrend on the hourly timeframe has been broken, and based on the drawn ascending channel, it is expected to rise to 0.715.

ADA buy idea ADA lagging the BTC.
alt coins tend to follow BTC
trade idea here is that ADA will soon follow BTC

Cardano ($ADA) = Bullish Wedge FormationTarget= $0.906
Possible Entry Level= $0.771
Long term regardless without risk managment will carry momentum past: $0.806

ADAUSDT SHORT OUTLOOKHello Traders, this is outlook that i think might be work. All Entry, Stop Loss, and Take Profit its already showed up. All trade it is on yourself. DYOR.

ALT COIN LONG - ADAUSD Long setup pre altcoin run, lottery ticket #3
I don't have an extensive explanation, the chart does the talking. look for breakouts above key moving average past the recent pullback.

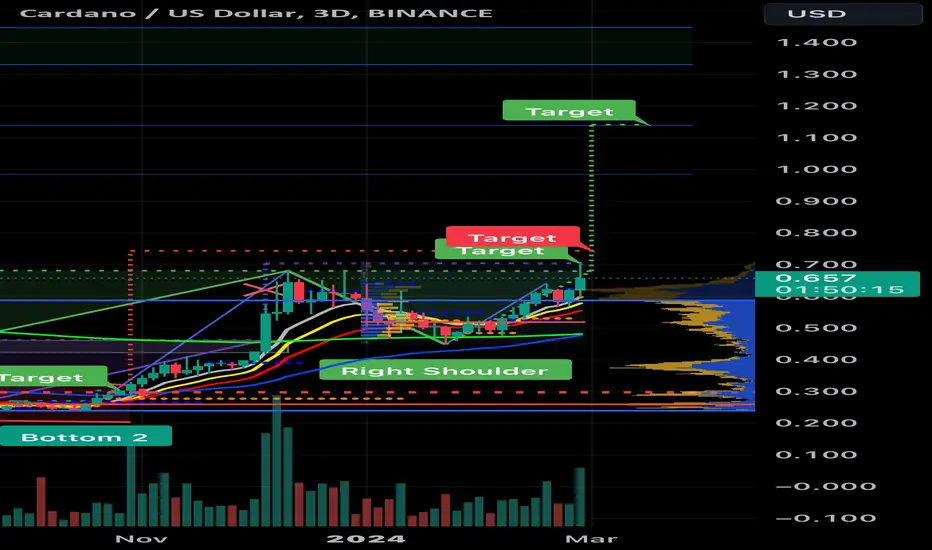
(ADA) Chart Analysis:Observing Inverse Head and ShoulderADA/USD displays a potential inverse head and shoulders pattern on the 3-day chart. If confirmed with a closing price above $0.68, technical analysis suggests a possible price target of $1.14.
Thinking of a sell maybe Just practicing so don’t mind me or the idea… thanks and trade respectfully.

LONG OPPORTUNITY IN CARDANOwe have confluence in the major support at 55, if this level is respected, we can see an impulse up to 80

Cardano's road to $ 1.00 - Ascending triangle patternAscending triangle pattern has emerged. This could trigger the road to $1 and beyond soon.
Buy after break of above line and retest.
Target: $ 1
SL: $ 0,685
Not financial advice. DYOR
