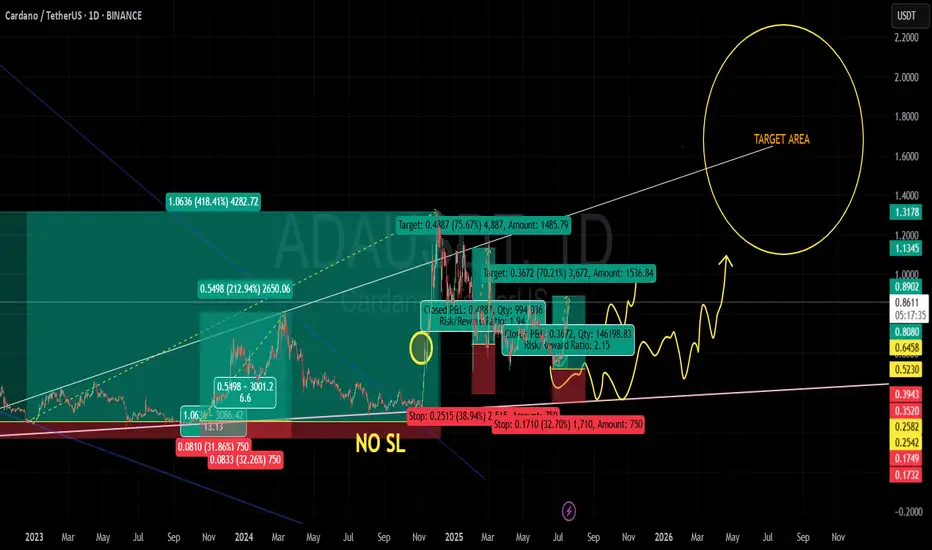
ADA MY LOVE ✅ Profitable Trades Counted (Spot Swing):
418%
213%
75%
70%
💰 Approximate Cumulative Gain (Compounded Not Calculated)
= 776%+ gain from multiple swing trades
🧠 Your POV (as seen on chart)
“NO SL” indicates confidence in ADA’s long-term support zones.
trusted strong support accumulation areas (red zone) and rode through volatility.
Strong belief in continuation: yellow squiggly lines show an expectation of consolidation followed by breakout above $1.
📢 Note: “There are also multiple futures scalp trades not shown here.” – this shows you are aggressively compounding gains via different strategies.
🧠 My Technical POV on ADA (Bullish Outlook)
✅ Key Observations:
Price Recovery from macro bottom zone (~0.25–0.26).
Multiple Breakouts from falling trendlines.
Clean support-resistance flip around 0.52, 0.64, 0.81 zones.
Current price: ~$0.86, holding above mid-term trend support.
🎯 Future Key Levels:
Short-Term Targets: 0.89 (breakout level), then 1.1345
Mid-Term Targets: 1.3178, 1.60
Long-Term Potential: 2$ ,3$,5$ if BTC & ETH sustain bullish cycle
📈 Momentum:
Consolidation above 0.80 zone would likely trigger another explosive move
ADA remains undervalued compared to its 2021 ATH, making it a high R/R swing opportunity
ADAUSDT.3L trade ideas
$adaabove 200 ema on daily
range low
deivation likely
entered now let see if we get a wick below before up saving some to bid there
time for it to ressurect
Cardano sellll shorts All markets have TB in August.
Cardano sellll short
Tp1:0.50
Tp2:0.44
Tp3:0.29
Tp4:0.16😄😄😄😄😄

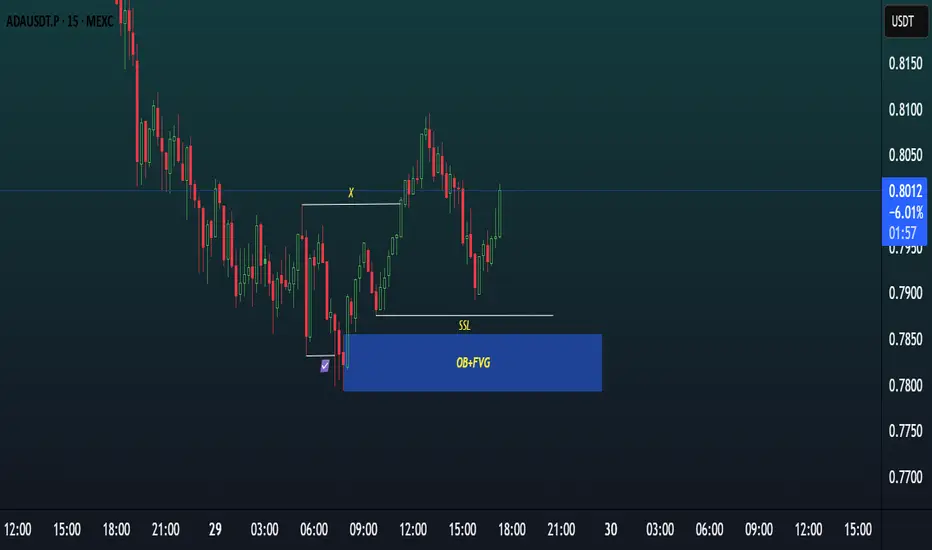
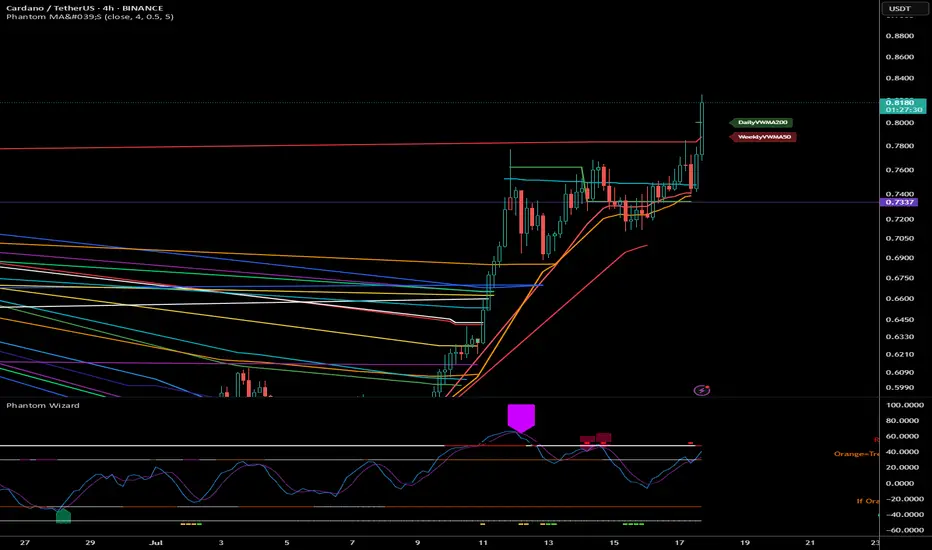
ADA SCALP TRADE IDEA WITH EXPLAINATION.1. Market Structure & Break of Structure (BoS):
The chart shows a bullish Break of Structure (BoS) marked by “X”, where price broke above previous highs with strong momentum, confirming a shift in structure from bearish to bullish.
This BoS indicates institutional buying interest and a potential continuation of the bullish trend after a retracement.
2. Retracement & Current Price Action:
After forming a short-term high around 0.8080, price began to pull back, forming lower highs and lower lows.
The current price is consolidating around 0.7948, signaling indecision or temporary relief before further movement.
3. Liquidity Engineering – Sell-Side Liquidity (SSL):
There is a cluster of equal lows (SSL) just above the 0.7870–0.7880 zone.
This liquidity has not been swept yet, and it’s likely that smart money will drive price below it to trigger stop losses and induce sellers, creating the fuel for a bullish reversal.
4. Key Demand Zone – OB + FVG:
Below SSL lies a powerful confluence zone:
A Bullish Order Block (OB), which represents the last down candle before the bullish move that broke structure.
An overlapping Fair Value Gap (FVG), indicating an imbalance that price has not yet filled.
This OB + FVG zone is marked in blue, approximately between 0.7850–0.7880, and serves as the primary Point of Interest (POI) for a high-probability long entry.
5. Anticipated Move:
Expected scenario:
Price is likely to sweep the SSL, tap into the OB + FVG zone, and then show bullish confirmation (such as a bullish engulfing or change of character).
If confirmed, we can look for a long position from the demand zone.
6. Entry Plan (SMC-based):
Entry: Inside the OB + FVG zone (0.7850–0.7880), after bullish confirmation.
Stop Loss: Below the OB zone (around 0.7830).
Target 1: Recent high near 0.8080.
Target 2: Extended TP near 0.8150 for a 1:2 or 1:2.5 RR.
✅
Summary:
ADA/USDT has broken structure to the upside, but price is currently in retracement. With SSL liquidity still intact and a clean OB + FVG demand zone below, we expect a sweep of lows followed by a bullish reversal. A high-probability long setup may form once price reacts from the demand zone with clear confirmation.
ADAUSDT.P m15 : a Short Position fot TP3The price, on its weekly upward path, reacted bearishly to the daily zone and seems likely to take out key lows to collect liquidity (whether for a future decline or rise).
Our trade will be activated after the liquidity Grab, based on trend and horizontal levels

ADA/USDT Trade Idea – 15m (Following V–Trend Setup)Bias: LONG
🔍 Trade Breakdown:
V-Structure Identified:
Market formed a clear V-reversal structure, shifting from a bearish downtrend into a bullish uptrend. This is a key part of my setup — I look for these V-shaped reversals as confirmation of potential long entries.
Trendline Break + Structure Shift:
The red descending trendline was broken with strong bullish candles. Price also broke above a key structure level, confirming the bullish trend shift.
Risk Management Zone (RM):
Price pulled back into my Risk Management Zone (RM) — a demand zone marked by previous consolidation and imbalance. I do not enter on impulse, instead I wait for price to return to this zone for a safer entry.
NO FOMO Zone:
Highlighted in red — I avoid entering if price doesn't respect this zone. It helps me stay disciplined and avoid emotional trades.
Entry & Target:
Entry: Within RM zone (~0.8780–0.8845)
Stop Loss: Below RM zone (~0.8739)
Target: 0.9266
This gives a solid risk-to-reward setup in alignment with the trend.
✅ Strategy Checklist:
V-shaped recovery ✅
Structure break ✅
Pullback into RM ✅
No FOMO entry ✅
RR > 1:3 ✅
📌 Let the market come to you. Stay disciplined, trust the setup.
#ADAUSDT #CryptoTrading #VTrend #SmartMoney #PriceAction #NoFOMO #15mSetup #TradingView

Cardano Update · What Happens Now?I am going to assume that you read the XRP update I just published. While these are different pairs, my updates and publications are all related because I look at the entire market—for you—as a unit.
The situation with Cardano is different to XRP. Why? Because XRP already broke its previous bullish wave high while Cardano hasn't. This first tells us that Cardano has more room for growth and has less risk from a buyers standpoint. It can also be seen as Cardano being weaker or lagging behind in someway but I wouldn't give credit to this interpretation. The truth is that the market moves in unison but not at the exact same time.
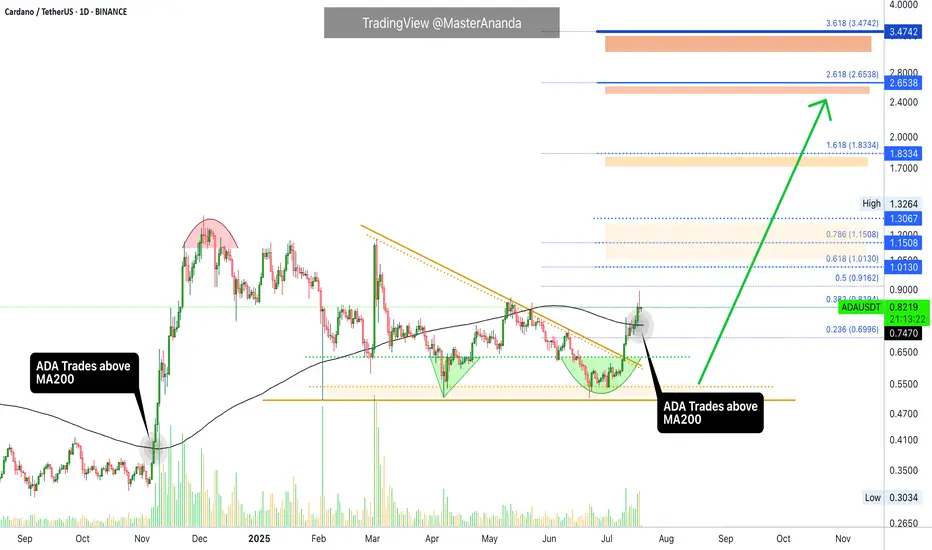
May's high, reached first from the 7-April bottom, has been challenged but confirmed as resistance. This won't last long. It has been confirmed as resistance and we can easily see it by yesterday's red candle. This is normal. If you look at 14-July and 12-July, these days were also red yet Cardano continued growing. You can expect the same.
We can have one day red, two red days, three red days and nothing changes. The market is set to grow, is growing and will continue to grow in the coming weeks and months. Long-term growth and even beyond months. There is the possibility of growth extending to years similar to Bitcoin.
When a huge wave develops, we get a half year strong correction, a major higher low compared to the start of the phase followed by additional growth.
Let's get back to today and what is happening now.
ADAUSDT managed to break above MA200 16-July, just three days ago. This confirms a long-term growth process; it is now confirmed. This means that Cardano is on track to grow for 3-6 months minimum.
What we are seeing now is only the start of a major advance and the continuation—on a long-term basis—of the move that started in late 2024.
You can rest easy, sleep easy while you watch your profits grow. Cardano will continue growing, it will do great; you have my word.
Thank you for reading.
If you enjoy the content leave a comment just for this one, I will be sharing updates for you now, today, yesterday, tomorrow and for years to come.
Namaste.
ADA/USDT | BIG Bullish Move Ahead! (READ THE CAPTION)By analyzing the Cardano chart on the 3-day timeframe, we can see that, as expected, the price continued its rally, reaching $0.89 before collecting liquidity above the $0.86 level and then facing a correction. Currently trading around $0.81, we expect the bullish trend to continue after this minor pullback. Key demand zones are at $0.78, $0.69, and $0.61. Based on the previous analysis, the next short- to mid-term bullish targets are $0.93, $1.05, and $1.33.
Please support me with your likes and comments to motivate me to share more analysis with you and share your opinion about the possible trend of this chart with me !
Best Regards , Arman Shaban

Major Move Ahead for ADA – Breakout or Breakdown?
🔍 ADA/USDT Analysis – Dual Scenario Setup (BUY & SELL)
Currently, ADA is ranging between major supply and demand zones. Two clear scenarios are in play depending on how price reacts to key levels:
📈 Bullish Scenario (Long):
Entry: On breakout and confirmation above $0.6027
Target: $0.869 (major resistance zone)
Stop Loss: Below $0.523
Trigger: Break of descending trendline and solid structure above $0.6027
📉 Bearish Scenario (Short):
Entry: Around $0.5120 (rejection from supply zone)
Target: $0.315 (strong demand zone)
Stop Loss: Above $0.6027
Trigger: Failed breakout and rejection from $0.5120 level, with confirmation below it
📌 Based on the descending channel structure, this might have been the final leg of the downtrend, and a reversal to the upside could be underway. However, for confirmation, we prefer to wait for stronger price action signals before fully committing.
🛑 Always use risk management. Market remains bearish until proven otherwise.

ADAUSDT 1$ is not any more resistance for it, soon above itAs we mentioned before 0.5$ was strong enough to pump the price:
and soon our first target which was 2x and is 1$ will hit and even after that price can see more gain and 1$ or 0.80$ which is current price can be strong supports in future.
DISCLAIMER: ((trade based on your own decision))
<<press like👍 if you enjoy💚
Cardano (ADA): Good Trades That Can Be Taken | Waiting Is KeyWe are seeing the volatility kicking in on ADA, which could send us into a new BOS or MSB so we are waiting for confirmation, and as soon as we get it, we will be opening a position!
More in-depth info is in the video—enjoy!
Swallow Academy

From Liquidation to Withdrawal, It’s the MapDo you remember your first heavy loss? That exact moment when you realized trading isn’t just about patterns and candles?
This analysis is for you if you’re looking for a path to escape that liquidation pit and actually make your first real withdrawal.
No hype, no signals just a practical roadmap built on experience and mistakes.
Hello✌
Spend 3 minutes ⏰ reading this educational material.
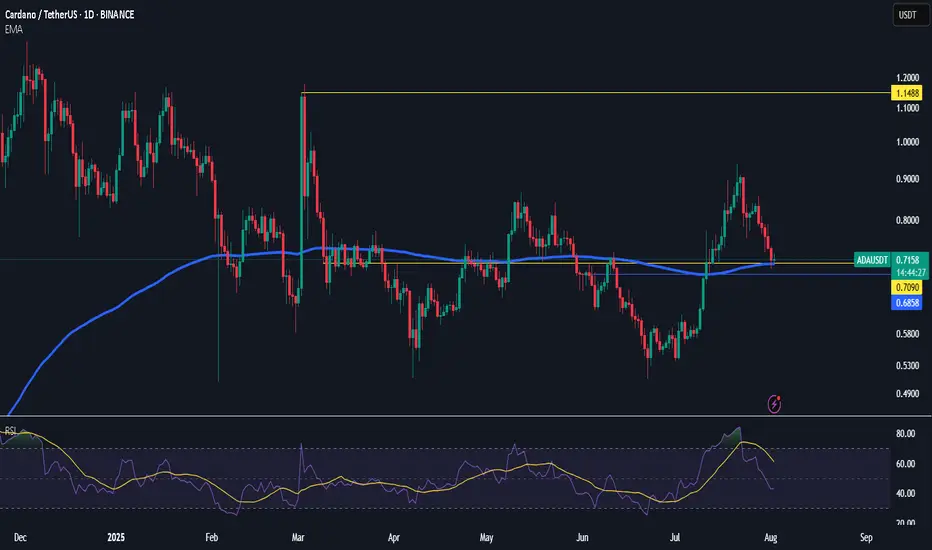
🎯 Analytical Insight on Cardano:
BINANCE:ADAUSDT is testing a crucial daily support near the 0.38 Fibonacci retracement level, setting up for a potential 16% upside toward the key psychological and monthly resistance at $1. If this level holds, ADA could confirm bullish momentum and target higher levels soon. 📊🚀
Now , let's dive into the educational section,
🧭 It All Starts With the Tools
Before anything else, you need a compass and in trading, that compass is made of tools you can actually use on TradingView.
Here are some tools that serious traders never ignore, especially when analyzing crowd behavior and institutional traps:
Volume Profile (Fixed Range)
Shows you where money is actually concentrated, not just where price is. High-volume nodes often become breakout or breakdown zones in days ahead.
Liquidity Zones – Custom Indicators
Search for "liquidity" or "order block" in the Indicators section. There are tons of free community scripts that help you spot stop-loss clusters the exact places where the market loves to hunt.
Relative Volume (RVOL)
Tells you how strong the current market move is compared to its average volume. Is this a real breakout, or just noise? RVOL helps answer that.
Session Volume & Time-Based Boxes
Use drawing tools to box London, New York, or Asia sessions. This lets you track where real money enters. Time matters volume without time is meaningless.
Got the tools? Great. But now what? Let’s walk the path...
🚪 The Entry Point: First Liquidation
Almost every trader starts here: a signal, a rushed entry, a tight stop... then liquidation or a brutal margin call.
But that exact moment? It’s not your failure. It’s the beginning of your real journey.
Ask yourself:
Why did I take that trade?
What tool was available but ignored?
Was my position size reasonable or emotional?
Analyze this moment deeper than you analyze Bitcoin’s chart.
🔁 Repeat or Reroute?
This is the loop most traders never escape.
They stay stuck between losses because they don’t reflect, don’t learn, and don’t adjust.
What you should do instead:
Start a trade journal raw and honest.
Use TradingView as your lab, not just a chart. Practice, backtest, fail, and fix.
🧠 Turning Point: Where Your Mind Starts Trading
Once you stop chasing profit and start chasing clarity, things shift.
You begin spotting real triggers, real volume, and real market intent.
Here’s where tools become meaningful:
Use OBV to confirm volume alignment
Let RSI tell you about weakness before reversal
Follow EMA50/EMA200 to map trend structure
Not because someone told you to but because now you know why and when to use them.
🤑 The First Real Withdrawal Isn’t From Your Wallet
The first "withdrawal" isn’t a bank transfer.
It’s when you can walk away from the market without FOMO, without guilt, and without overtrading.
You now:
Accept risk, every single trade
Respect the market, not fear it
Have patience not because you're lazy, but because you understand timing
That’s the real payout.
📌 Final Thoughts
The path to becoming a trader starts with loss, grows with tools, and ends with discipline.
TradingView isn’t just for charts it’s your practice field.
Before chasing the next win, start by understanding your last mistake.
✨ Need a little love!
We pour love into every post your support keeps us inspired! 💛 Don’t be shy, we’d love to hear from you on comments. Big thanks , Mad Whale 🐋
📜Please make sure to do your own research before investing, and review the disclaimer provided at the end of each post.

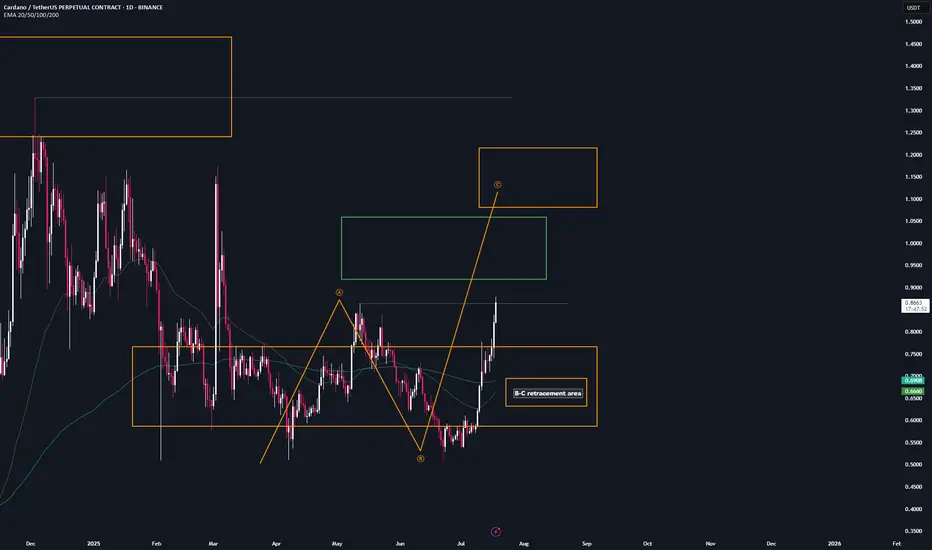
ADA | Trade setup📌 After the breakout from the last high at $0.86, a bullish sequence (orange) has now been activated.
📊 These setups typically occur no more than twice per year on any given altcoin, so I’ll be aggressively buying each level at the B-C retracement area.
Trademanagement:
- I'm placing long orders at each level. ((If the price continues climbing, I’ll adjust the trend reversal level (green) accordingly and update my limit orders.)
- Once the trade reaches a 2 R/R, I’ll move the stop-loss to break-even.
- From a 3 R/R onward, I’ll start locking in profits.
✅ I welcome every correction from here on —
but I won’t enter any new positions at these top levels.
Stay safe & lets make money
Is #ADA Ready For a Major Move or a Trap is Ahead? Watch this Yello, Paradisers! Is this breakout on #Cardano the start of a major upside move or just another bull trap waiting to flush out impatient traders? Let’s break down the latest #ADAUSDT setup:
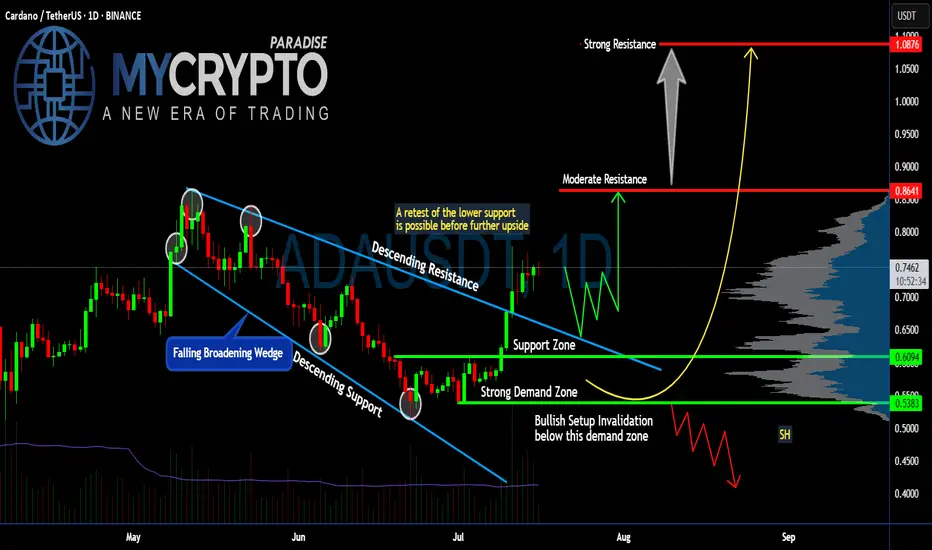
💎After weeks inside a falling broadening wedge, #ADA finally broke above the descending resistance, signaling a potential trend reversal. The breakout above $0.70 has pushed the price toward the current $0.74 zone. The soaring volume and a positive broader market outlook reinforce our bullish bias. While this looks bullish, the key question is whether #ADAUSD will hold above its reclaimed support or retest lower levels first.
💎The structure is straightforward: #ADA reclaimed the support zone around $0.70 after bouncing strongly from the demand zone near $0.61–$0.60. This demand zone remains the critical area to watch—any healthy retest here would provide a high-probability continuation setup for bulls.
💎If buyers maintain control, the first target sits at the moderate resistance of $0.86. That’s where the next notable selling pressure is expected. But the real battle will take place near the strong resistance at $1.08—a zone where major distribution and profit-taking could occur.
💎However, the bullish setup becomes invalid if #ADAUSD loses the $0.61–$0.60 demand zone. A confirmed close below $0.538 would flip the structure bearish, signaling a potential continuation to lower lows.
Stay patient, Paradisers. Let the breakout confirm, and only then do we strike with conviction.
MyCryptoParadise
iFeel the success🌴
Cardano: Still Boring or Finally Ready to Move?🧐🔁 Cardano: Still Boring or Finally Ready to Move? 🚦📈
Welcome to the Altcoin Series, kicking off this weekend with none other than Cardano (ADA).
Later on I will explain why i will be 'Divorcing Alts' and just trade them, but that time will be at the cycle end, not now.
It’s Saturday, July 12th — a classic retail weekend after a solid macro pump. Salaries are hitting accounts, the charts are alive again, and it's time to look at structure over sentiment.
🔍 A Personal Note on ADA
I was fortunate to exit near the top during the Cardano Summit in Athens (2021) — not just due to chart structure, but after meeting with developers and understanding how deeply Haskell shapes this ecosystem. And what a challenge that seemed!
Haskell, while academically impressive, has proven difficult to scale, and in practice, it's slowed down development. Expectations were sky-high, but reality hit hard. And let’s be honest — Cardano has been boring for years.
But that boredom may be hiding something...
I’ve still been 'going Long' under key levels, because when you zoom out — Cardano is still U.S.-centric , regulation-aware, and deeply rooted . In a time when the U.S. might look to lead crypto adoption, especially with figures like Trump signaling support , Cardano could become part of that narrative.
⚙️ Technical Setup
The recent pump from Nov–Dec 2024 was rejected right at $1.193 — our second test of that critical resistance. But now, we’re staring down a potential third test, with Test #3 marked on the chart near $1.15, and this time, the context is shifting.
✅ TOTAL3 structure is bullish
✅ Retail energy is back
✅ Altcoin momentum is quietly building
🔑 Key Levels
Support Zone:
🟢 $0.70–$0.71 — the current base to hold
Target Zones:
🔹 $1.15–$1.19 — Third test of resistance
🔹 $1.47
🔹 $1.89
🔹 $3.02
🔹 Top Extension Target: $3.65
A break above that descending level could turn this "boring" coin into one of the cleanest long continuation setups of the cycle.
📌 We trade technicals, not hope:
✅ Buy over support
✅ Exit under resistance
✅ Control risk, always
So… will Cardano keep boring us? Or is it finally time for a show?
One Love,
The FXPROFESSOR 💙

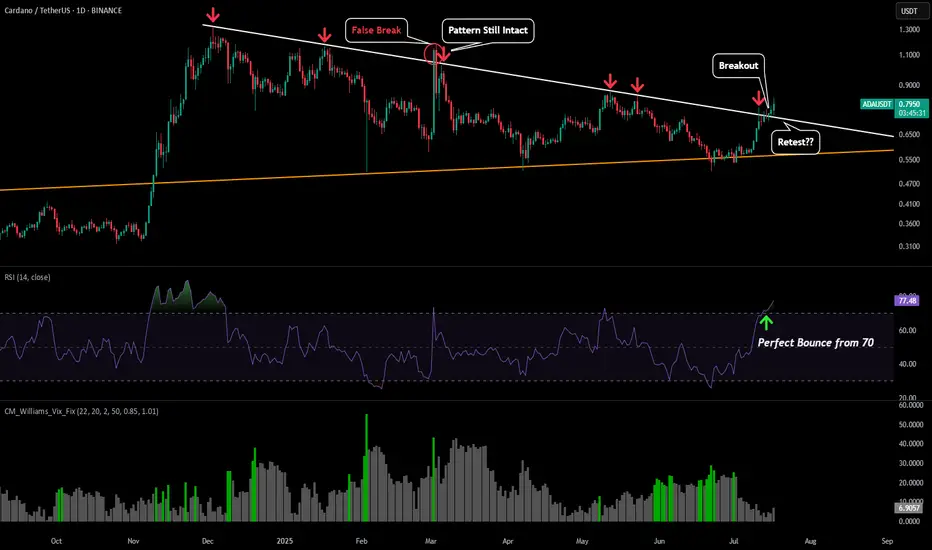
ADA - Monitor BreakoutWe have already seen ADA breakout of its symmetrical triangle, but if BTC does have a downswing we could see ADA retest the triangle as support to provide entries.
Retest would most likely align somewhere between $0.72-$0.74.
However the 1D RSI is showing tremendous strength with the bounce from the 70 level, so if there is no retest and price continues to breakout, our primary target would be around $1.14.
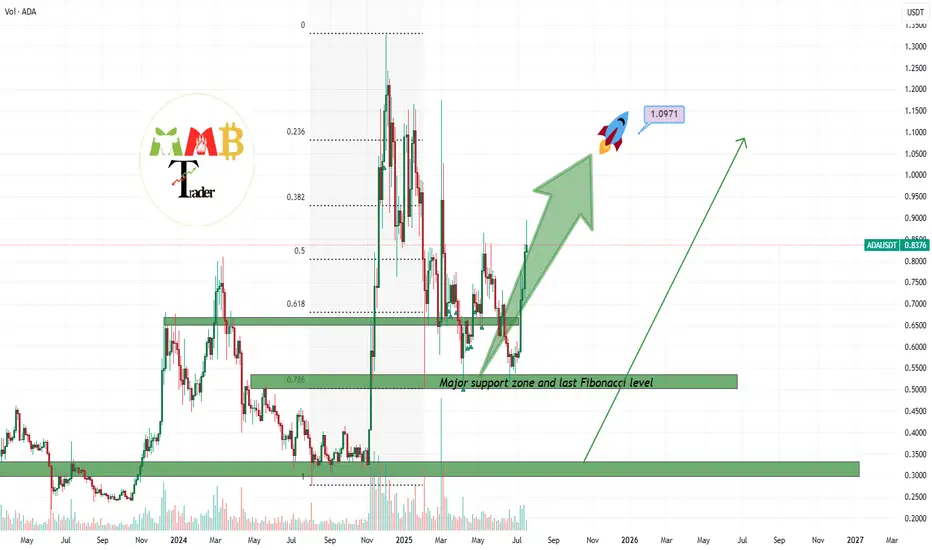
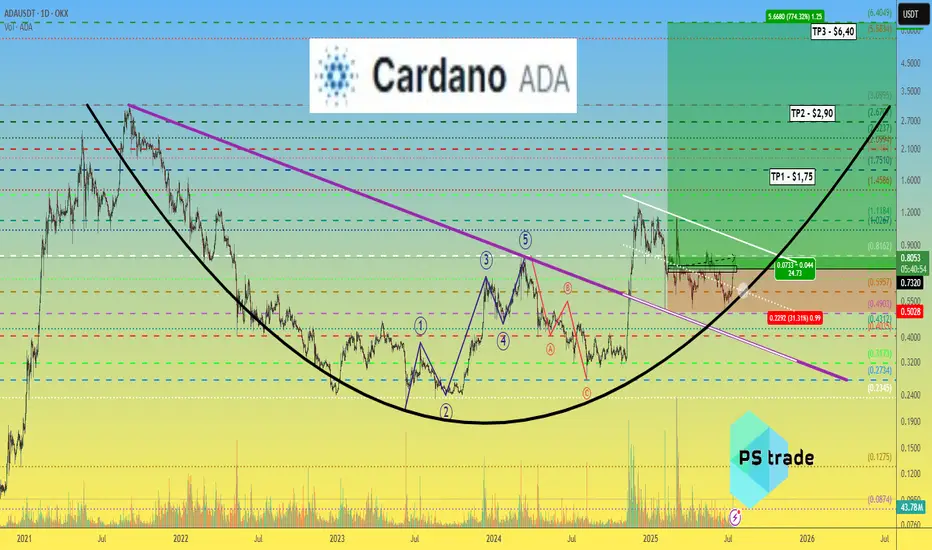
Cardano ADA price analysis🪙 Five months ago, we published a medium-term trade for CRYPTOCAP:ADA , and the price still remains in the buying zone.
With the current growth, the price of OKX:ADAUSDT remains in consolidation, and when the correction begins, it would be very good if it stayed above $0.60.
😈 If you still have faith in the prospects of the #Cardano project, you can continue to hold or even buy #ADA during the correction.
Well, theoretically possible targets for the #ADAusd price are:
TP1 - $1.75
TP2 - $2.90
TP3 - $6.40
_____________________
Did you like our analysis? Leave a comment, like, and follow to get more
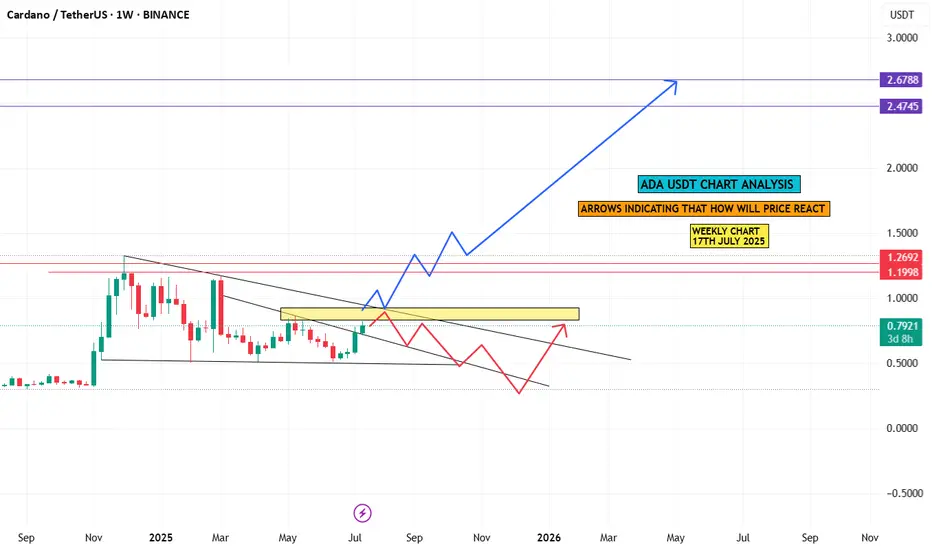
ada chart analysiscardano weekly chart analysis n arrows indicating that how will price react in upcoming
days or months,
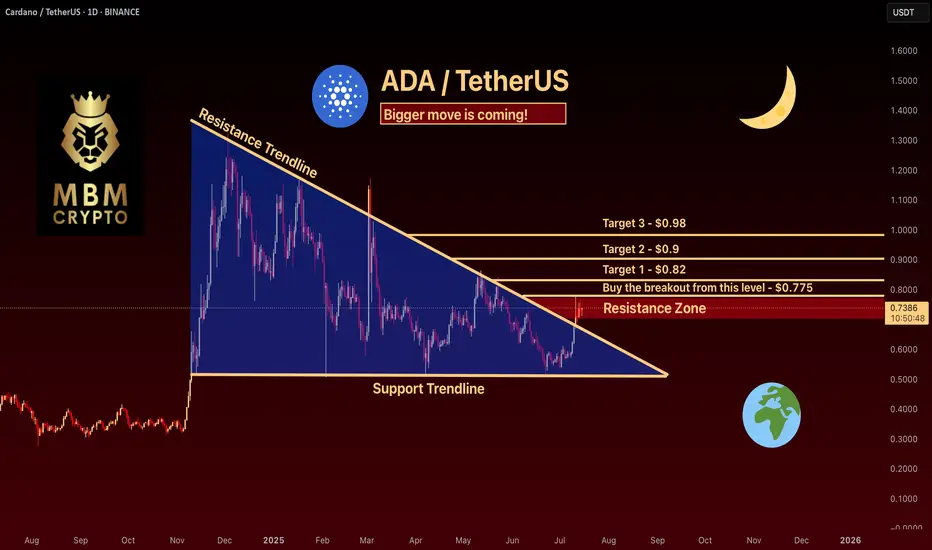
ADA: Keep an eye on this setup!If you're looking to trade ADA at the moment, here's a quick setup that you might find helpful!
The idea is: Buy when the price breaks above $0.775 and take profits at the levels shown in the chart.
Targets:
1. $0.82
2. $0.9
3. $0.98
-------------------------------------------
About our trades:
Our success rate is notably high, with 10 out of 11 posted trade setups achieving at least their first target upon a breakout price breach (The most on TW!). Our TradingView page serves as a testament to this claim, and we invite you to verify it!
ADA/USDT : +50% in 21 Days, More Rise Ahead? (READ THE CAPTION)Over 50% growth in just 21 days — Cardano’s explosive rally continues, and the $0.76 target has now been hit! Since our last analysis, ADA has kept pushing higher, successfully reaching the next key level and bringing the total return from this move above 50%. Currently trading around $0.73, with strong bullish momentum still in play, I expect it won’t be long before we head toward the next targets. Upcoming levels to watch: $0.93, $1.05, and $1.33 — we’re getting closer to that 100% gain!
Please support me with your likes and comments to motivate me to share more analysis with you and share your opinion about the possible trend of this chart with me !
Best Regards , Arman Shaban

ADA all the way Cardano's Ascent: A Technical Outlook for Q3-Q4 2025
Breaking Through Resistance: Cardano's Path to $1.00 and Beyond
Following a period of extended consolidation, Cardano (ADA) has demonstrated a significant shift in character, breaking out decisively from a key resistance zone. Currently trading near $0.82 as of July 18, 2025, ADA has entered a new phase of bullish momentum. This analysis will dissect the technical landscape to project its potential trajectory through the end of the year, identifying critical price levels and probable targets.
Current Market Context
After consolidating in a range between $0.70 and $0.77 for several weeks, ADA has executed a powerful breakout, surging over 15% in the last few days to establish a multi-month high at $0.825. This move signals a clear victory for buyers and a potential end to the preceding sideways market structure. The immediate challenge for bulls is to defend this breakout level and convert prior resistance into firm support, setting the stage for the next major leg higher.
RSI Analysis: Emerging Strength with Room to Run
The recent price surge has propelled the daily Relative Strength Index (RSI) into overbought territory, currently reading above 70. While this often signals a short-term exhaustion and suggests a minor pullback or consolidation is likely, the underlying momentum on higher timeframes remains constructive.
The weekly RSI is trending sharply upwards from the neutral 50-level but remains well below the extreme overbought readings (80+) that have historically marked major cycle tops for ADA. This divergence between short-term overbought conditions and long-term momentum capacity is a classic sign of a healthy, strengthening trend. It indicates that while a brief pause is probable, the primary path of least resistance remains upward for the coming months.
Price Action & Volume Analysis: The Anatomy of a Breakout
The price action leading up to this point exhibits classic signs of accumulation followed by a markup phase:
Accumulation Phase: The trading range between $0.70 and $0.77 showed contracting volatility and was likely a period of "cause-building," where informed market participants accumulated positions.
Sign of Strength (SOS): The recent impulsive move from $0.77 to over $0.82 represents a clear SOS. This breakout was likely accompanied by a significant increase in volume, confirming the market's conviction and overwhelming sellers who were active at the resistance level.
A successful retest of the breakout zone at $0.75 - $0.77 on diminishing volume would be the strongest possible confirmation of a new, sustainable uptrend.
Supply and Demand Zone Analysis: Charting the Path Forward
The recent breakout has fundamentally altered the market structure, turning a key supply zone into a new floor of demand.
Major Demand Zone (New Support): A critical demand zone has now been established between $0.75 - $0.77. This area, formerly resistance, is now the most important level for bulls to defend to maintain the bullish structure.
Secondary Support Cluster: Should the primary zone fail, the next significant support lies at $0.68 - $0.70, the floor of the previous accumulation range.
Overhead Supply Zones: Unlike an asset at all-time highs, ADA faces historical resistance. The next major supply zones are located near $0.95 and, more significantly, the psychological and technical barrier at $1.10 - $1.15.
Fibonacci Extension Framework: Projecting Bullish Targets
Using the recent swing low of the accumulation phase (approx. $0.70) and the recent swing high ($0.825), we can project logical price targets for the current impulse wave:
The 127.2% extension projects a target of approximately $0.88.
The 161.8% extension, a common target for strong trends, points toward $0.92.
A more extended move to the 200% extension suggests a potential test of $0.97, aligning closely with the psychological $1.00 level.
These Fibonacci-derived targets provide a clear roadmap for the potential upside if the current bullish momentum is sustained.
Price Projection Timeline
Late July - August 2025:
Expect a period of consolidation or a healthy pullback. The overbought daily RSI suggests the market needs to pause. A retest of the $0.77 support level would be a prime opportunity for trend-continuation entries. A successful defence of this zone is critical.
September - October 2025:
Following the consolidation, the trend is expected to resume, targeting the Fibonacci extension levels of $0.88 - $0.92. This move would represent the confirmation of the new uptrend and would likely attract a second wave of buyers.
November - December 2025:
Should the Q4 market environment remain favourable, a push toward the major psychological and technical resistance at $1.00 - $1.15 is highly probable. This would represent a significant milestone and could trigger a more substantial corrective phase as long-term holders take profits.
Support Zones:
Primary: $0.75 - $0.77 (The breakout point; must hold)
Secondary: $0.68 - $0.70 (Floor of the previous range)
Resistance & Target Zones:
Immediate: $0.825 (Recent high)
Target 1: $0.88 - $0.92 (Fibonacci cluster)
Target 2: $0.97 - $1.00 (Fibonacci & psychological level)
Major Resistance: $1.10 - $1.15 (Historical supply zone)
Conclusion: The Road to One Dollar
The technical evidence strongly suggests that Cardano has initiated a new bullish impulse wave. The breakout from its multi-week consolidation range is a significant technical event that has shifted the market bias firmly in favour of the bulls. While a short-term pullback to retest the breakout level around $0.77 is a high probability, this would likely serve as a healthy reset before the next major advance.
Based on the confluence of price action, momentum analysis, and Fibonacci projections, a move toward the $0.95 - $1.15 range is a realistic objective for Cardano by the end of 2025.
ADA | Trade-updateWe’re in full profit on our CRYPTOCAP:ADA trade.
I took the final profits at the target zone (yellow); just a small portion is still running.
Gave yall that one for free — 68 R/R, lol.
Your win rate doesn’t need to be high — 30–40% with solid R/R is enough to be profitable.
Have a blessed day!

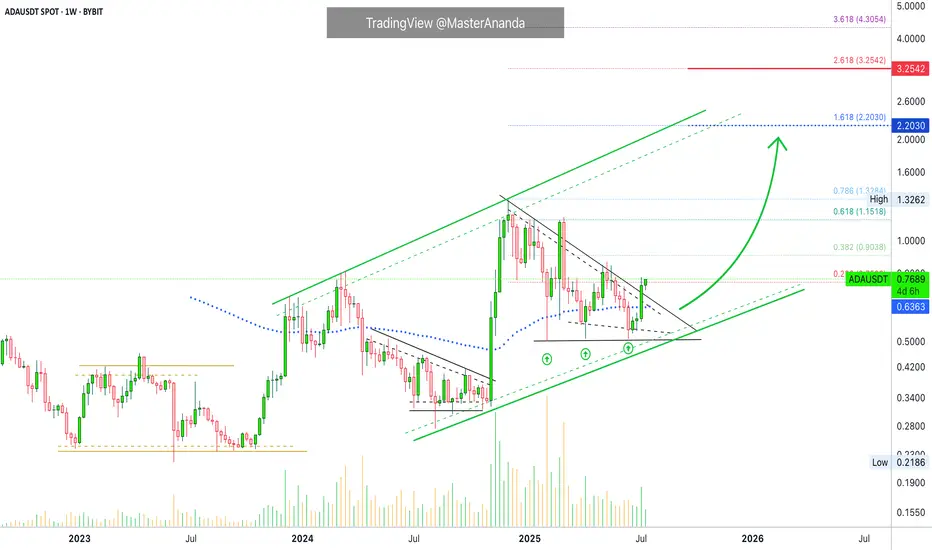
$2.2 Followed by $3.25 · Cardano Trend-Based Fib ExtensionCardano is a on a clear, and very strong, ascending channel rising since June 2023. We are clear, safe and confident about the bigger-broader market trend. An uptrend within a long-term bullish cycle.
After the peak in early December 2024 Cardano struggled to stay above EMA89—the blue dotted line on the chart—but this isn't the case anymore. After a triple-bottom, shy higher lows, last week ADAUSDT managed to break decisively above this level with a full green candle. This confirms the resumption of the late 2024 bullish wave.
Last week resistance was found at 0.236 Fib. extension. The weekly session closed right below it and this is shown as a thin tiny red dotted line on the chart. The current week is halfway through and ADAUSDT is now trading above this level. The bullish signal comes from the fact that the action is happening at the top of the candle; this is the fourth consecutive green week; the bullish bias is fully confirmed.
That is all there is. I just wanted to share a small update in support of our bullish bias based on chart data. You can rest easy knowing that the market will continue to grow.
Next target is $2.20 for 188%. Followed by $3.25 for 325%.
We use leverage on the big projects so the potential for profits can be multiplied by 5, 6, 7, 8, or 10X. The risk is higher of course, but so is the potential for reward. High risk vs a high potential for reward. You can always approach the pair spot if uncertain. If you lack experience but still want to join the ride, enjoy the rise, make money and have fun, you can buy spot, that is, buy and hold. The market will give you money if you are patient enough. This is the period where everything grows. Thanks a lot for your continued support. If you enjoyed the content consider hitting follow.
Namaste.