ADA - Bearish Rejection from Fair Value Gap (FVG)?This 4-hour chart of ADA/USDT shows price making a strong recovery after a significant drop. However, it is now approaching a key resistance area—a Fair Value Gap (FVG) near the 0.618-0.65 Fibonacci retracement levels.
Here’s the potential setup:
🔹 FVG Resistance: Price is entering a liquidity zone where sellers might step in.
🔹 Possible Double Top Formation: A rejection at this level could lead to a bearish reversal, forming a distribution pattern before dropping.
🔹 Bearish Continuation? If the FVG acts as resistance, ADA could resume its downtrend, targeting lower support zones.
Will this resistance hold, or will ADA break through and continue higher? Drop your thoughts below! 🔥📉
ADAUSDT trade ideas

Cardano - Bullish Breakout! Can Bulls Finally Take Control? Cardano (ADA) has recently broken out of a prolonged bearish trend on the 4-hour chart, signaling a potential shift in market sentiment. This breakout suggests that bullish momentum could be building, paving the way for a move higher. The price action indicates that ADA may now target areas of confluence, where technical factors align to create significant levels of interest. The breakout itself is a strong indication that buyers are gaining control, pushing the price above previous resistance levels. This shift in momentum could be the start of a more substantial rally, especially if ADA continues to attract buyers as it moves higher.
The breakout from the bearish trend also marks a change in the broader market structure. Previously, ADA was confined within a downward trend, but now it appears to be transitioning into a more bullish phase. This transition is crucial for traders, as it presents opportunities for both short-term gains and longer-term investment strategies. As ADA moves higher, it will be important to monitor how it interacts with key technical levels, as these will provide insight into whether the breakout is sustainable or if it will be met with resistance.
Short-Term Target: Golden Pocket and Fair Value Gap
The next logical target for ADA is the golden pocket zone (0.618–0.65 Fibonacci retracement level), which coincides with a Fair Value Gap (FVG). This confluence creates a magnet for price action due to several reasons. The golden pocket is a key area where reversals or consolidations often occur after significant moves. It acts as a strong resistance level and is widely monitored by traders because it represents a point where price action tends to stabilize or reverse. Historically, the golden pocket has been a reliable indicator of potential price reversals, making it a critical area to watch for traders looking to capitalize on ADA's current momentum.
The Fair Value Gap (FVG) represents an imbalance in price caused by rapid movement, leaving untraded zones behind. Price tends to revisit these areas to "fill" the gap, making this level crucial for predicting future movements. Gaps like these often get revisited before the market decides on a new trend direction, which means that ADA's approach to this zone could be pivotal in determining its next major move. Additionally, liquidity is likely concentrated around this area, as stop-loss orders from short positions could be triggered here, leading to increased volatility. If ADA reaches this level, traders should closely monitor how price reacts. A strong rejection could signal a move back down, while a clean breakthrough could indicate further upside potential.
Potential Rejection and Support Levels
While the breakout is promising, there remains a high probability of resistance at the golden pocket and FVG zone. If ADA faces rejection here, it could retrace toward key support levels. The primary support zone, which has held firm during recent consolidation phases, will be crucial in determining whether ADA can maintain its bullish momentum. A retest of this area would provide another opportunity for buyers to step in, potentially leading to a continuation of the current trend.
In the event of a rejection, ADA might initially pull back to test its recent breakout levels. If this support holds, it would reinforce the idea that the breakout is legitimate and that ADA is poised for further gains. However, failure to hold these levels could open the door for ADA to drop toward secondary support zones. These areas, typically marked by previous lows or significant trading volumes, would be critical in preventing a deeper correction. If ADA fails to find support at these levels, it could signal a broader reversal in the market, potentially leading to a retest of lower support zones.
Final Thoughts
Cardano’s breakout from its bearish trend presents an exciting opportunity for traders. The golden pocket and FVG alignment around the target zone make it a critical area to watch. Traders should remain cautious as price approaches this resistance level, looking for signs of rejection or continued strength. Monitoring the price action closely will be essential in determining whether ADA has the momentum to push through resistance or if it will be forced back into a consolidation phase.
For now, the key levels to monitor include the resistance at the golden pocket/FVG zone and the support at recent breakout levels. A decisive breakout above resistance could signal further upside potential, while failure might keep ADA within its broader range structure. As ADA navigates these technical levels, traders should be prepared for increased volatility and potential trading opportunities. Whether ADA continues its ascent or faces a pullback, the current market conditions offer a compelling setup for traders looking to capitalize on the cryptocurrency's movements.
__________________________________________
Thanks for your support!
If you found this idea helpful or learned something new, drop a like 👍 and leave a comment, I’d love to hear your thoughts! 🚀
Make sure to follow me for more price action insights, free indicators, and trading strategies. Let’s grow and trade smarter together! 📈

Price drops down from key support/resistanceUsing the Smoothed Heikin Ashi candles (HODL Flip V2) indicator by R.S. with settings of 6:6 for the input settings ADAUST was already an active short bias using a 1D chart. This is my first step before I look for short-only opportunities to trade in smaller timeframes like the 1H or 4H
To be honest, I was busy and placed a very small short yesterday and then got quite busy with other stuff. I noticed the price had moved up against me so I added to my short to average my entry higher, place a SL and went to bed. Today I happened to check the 4H chart and see the price had moved up bounced off resistance and was heading down in my favor now.
Suffice it to say, but this was a major support/resistance I can see has been respected over the last 18 days+
Therefore, even if the price forms an inverse head and shoulders and moves back up ultimately, I think a quick 2.6% move for a short will happen first as a worst case scenario.
Or, we get some more world news that spooks markets again and we get some wind behind all markets falling like April 2 and we get the best trade of the month;-)

ADA/USDTThere is a removal of the weekly liquidity minimum, within the framework of range expansion, the target is the weekly high. A purchase can be considered in the highlighted zone, but only if the conditions are met.
Growth targets:
Target 1 = 0.74
Target 2 = 0.77

ADAUSDT: Trend in daily time framePlease pay special attention to the accurate trend, and very accurate colored levels
Be careful, because the setup is very very sensitive
Don't get a position without SL.
BEST
MT

The last bullish chance of CARDANO in mid term!As you can see, the price has now formed an ascending wedge, which is promising. The price could rise to $1 after breaking this wedge...
Give me some energy !!
✨We spend hours finding potential opportunities and writing useful ideas, we would be happy if you support us.
Best regards CobraVanguard.💚
_ _ _ _ __ _ _ _ _ _ _ _ _ _ _ _ _ _ _ _ _ _ _ _ _ _ _ _ _ _ _ _
✅Thank you, and for more ideas, hit ❤️Like❤️ and 🌟Follow🌟!
⚠️Things can change...
The markets are always changing and even with all these signals, the market changes tend to be strong and fast!!

ADA - Next Trade Setups to WatchADA’s been stuck in this sideways grind for a while, and the volume’s basically ghosting us. So, where’s it at, and where’s the next move? Let’s dig in.
ADA’s sitting at $0.6615 right now, trading below the yearly open at $0.8451 and the range’s sweet spot, the POC, at $0.7325. That tells me it’s leaning a bit bearish, but not exactly screaming panic, more like it’s just chilling in this 57 day range. It tapped the monthly open at $0.6328 recently, bounced a little, but without volume showing up, it’s like nobody’s ready to commit yet.
Key Levels
Resistance Zones (Short Opportunities)
1.) Range POC: $0.7325, this is the most traded price within the 57 day range, acting as a magnet for price. A rejection here could signal a short setup.
2.) Yearly Open ($0.8451): a psychological and structural level that could cap upside if momentum remains weak. Trading below this level keeps the yearly bias bearish. A break above with volume would flip the narrative.
Support Zones (Long Opportunities)
1.) Monthly Open: $0.6328, already saw a little bounce here with that swing failure move, perfect setup for a long trade if you were quick on the draw.
2.) Yearly Open 2024 + 21 Monthly EMA: $0.594 - $0.5928, strong confluence with the prior yearly open and a key moving average. This zone aligns closely with the swing low at $0.5801, forming a robust support cluster between $0.5801 - $0.594.
3.) 21 SMA: $0.53, a deeper support level if the above zone fails. This would indicate a more significant breakdown, but it’s a potential accumulation area for longer-term traders.
Market Structure Analysis
Bearish Bias Above Swing Low: Trading below the yearly open and POC suggests sellers are in control unless price reclaims $0.7325 with conviction.
Range-Bound Behaviour: The 57 day range indicates consolidation. Volume is the missing catalyst, watch for a spike to confirm direction.
Swing Low as Key Pivot: The $0.5801 level is critical. A hold here maintains the range; a break below shifts focus to $0.53 and signals capitulation.
High-Probability Trade Setups
Long Setups
1.) Long Setup #1 at Swing Low ($0.5801 - $0.594 Zone)
Entry Trigger: Look for a swing failure pattern (SFP) where price dips below $0.5801, reclaims it, and shows rejection of lower prices (e.g., a bullish candle with a wick below).
Stop Loss (SL): Place just below the swing low
Take Profit (TP): $0.70 (near-term resistance)
Stretch Target: $0.8451 (yearly open), though this requires stronger momentum.
Confirmation: Higher-than-average volume on the reclaim + bullish price action (e.g., engulfing candle).
2.) Long Setup #2: $0.4735 Sniper Entry
Entry Trigger: If ADA takes a bigger tumble, $0.4735 is your sniper’s nest, think of it as catching the knife with style. Could be a wick that snaps back.
This is a deeper, high-reward play. Price has to fall by a lot from here, but if it hits, the R:R is amazing, and it’s below most traders radar. Patience is the name of the game.
Short Setup
At POC ($0.7325) or Yearly Open ($0.8451)
Strategic Outlook
Current Stance: If not in a trade, the $0.5801 level is the highest-probability long setup due to confluence and R:R. The SFP at $0.6328 today was a missed opportunity, but a deeper pullback sets up an even better entry.
Breakout Watch: A decisive close above $0.7325 (POC) with volume shifts focus to $0.8451. Conversely, a break below $0.5801 targets $0.53.
Patience is Key: Low volume suggests waiting for a clear catalyst (e.g., news, BTC move) to drive ADA out of this range.
Wrapping It Up
The $0.5801 swing low long with SL below and TP at $0.7 - $0.8451 is the standout trade right now—low risk, high reward, and backed by confluence. Monitor volume closely, as it’s the linchpin for any breakout or reversal. If ADA holds this support and volume picks up, the retest of $0.8451 becomes plausible.
If you found this helpful, please leave a like and a comment. Happy trading!

Ada is far from deadLooking at strictly block orders and rsi the 4 day timer shows ADA landing on top of its new buy zone.
.658 was the discounted by zone and it has bumped from there.
The battlegrounds (buyers vs sellers) will be around the price point of : .7120 and .7180
This could be a potential exit for buyers right now at those ranges. If it can break rhe 7180 zone we could see numbers raise as high as : .7650 and .7750


LONG ADA Good news back ground ( Trump anounced about including ADA to pool of purchased coins )
target 1.11 for testing previous high

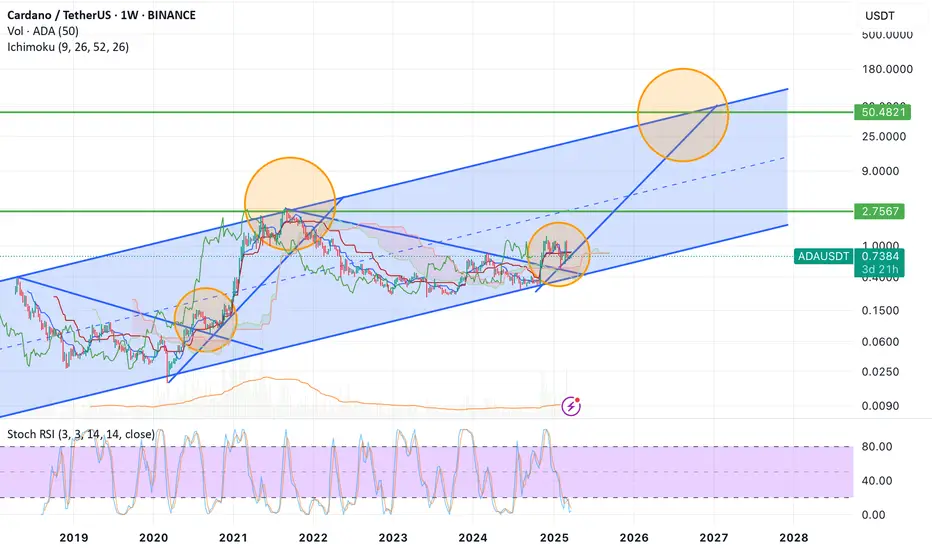
Cardano Technical AnalyzeTrend: Similar to the other pairs, ADA is also in an ascending channel (orange lines).
Support: The green support around 0.23–0.30 is important, and it could act as a solid foundation for the next move.
Resistance: Resistance at 3.03–3.40 is significant, and breaking it could signal a significant bullish move.
Volume: The volume is relatively low, indicating caution in the market. A breakout or breakdown could bring in more volume.
Price Action: Monitor for price action around the green support. A bounce would be bullish, but a breakdown could target lower levels at 0.15.

ADA Ready for PUMP or what ?The ADA will increase SEVEN cents and reach to the top of the wedge in the coming DAYS.
Give me some energy !!
✨We spend hours finding potential opportunities and writing useful ideas, we would be happy if you support us.
Best regards CobraVanguard.💚
_ _ _ _ __ _ _ _ _ _ _ _ _ _ _ _ _ _ _ _ _ _ _ _ _ _ _ _ _ _ _ _
✅Thank you, and for more ideas, hit ❤️Like❤️ and 🌟Follow🌟!
⚠️Things can change...
The markets are always changing and even with all these signals, the market changes tend to be strong and fast!!

ADAUSDT from 0.50$ support heavy pump will lead ---> +200%As we can see price is now near strong support of 0.65$ and soon it can break to the downside and we are looking for more fall and correction to the 0.50$ support zone and after that start of next bull market and new high here for ADAUSDT.
DISCLAIMER: ((trade based on your own decision))
<<press like👍 if you enjoy💚

ADA/USDTI have marked the area of interest, after which I will consider buying the coin, but only if the conditions are met.
growth targets
Target 1 = 0.7744
Target 2 = 0.8176
Target 3 = 1.040

ADAUST 40-50$ by End of Q3 2025?!It can be, if it follows the pattern in the ascending channel! #ADAUSDT @adausdt
Cardano $ADA Buy Setup support by a strong daily demand levelCardano CRYPTOCAP:ADA Buy Setup support by a strong daily demand level at 0.6593. The daily candle from the 3rd of March printed the strongest rally in Cardano's history. The crypto has been rallying ever since.

ADA may be looking for a reversal. ADA retraced to the golden pocket and is fighting to stay above the 200D-ema. Momentum and trend oscillator show bullish divergence. The volume gap below is still present however support here is possible as the price structure rounds off.
Full TA: Link in the BIO

Is this your last chance to fill your ADA bag ? let's see...Hello Traders 🐺
Honestly, I’m still surprised by how many people buy at the top during extreme greed—and then panic sell when we’re clearly in the accumulation zone! 😬
Don’t get me wrong—there’s a huge difference between accumulation and distribution phases. But right now, my friends, we are deep in accumulation territory. Want to know why? Let’s talk: 👇
Why ADA Looks Like a Steal Right Now
In my opinion, ADA is extremely undervalued at the moment. Just last week, we were trading around $1.20 per coin, and now we’re sitting at $0.75 — that’s a ~40-45% correction. 📉
And let’s be real — it’s not normal to see this kind of drop in the middle of a bull market, especially for a project like ADA, which is reportedly even part of the USA crypto strategic reserves! 🔥
This is not the time to sell, it’s the time to accumulate before the next major leg up.
🚀 Altcoin Season Is Near
I’ve been saying this for over two months now:
Altseason is coming, and time is ticking. Don’t miss the train, my friends… ⏰🚂
Thanks for your amazing support as always 🙏
🐺 Discipline is rarely enjoyable, but almost always profitable 🐺
🐺 KIU_COIN 🐺

ADAUSDTIn a bullish trend with no divergence or reversal pattern and a clear bullish flag continuation.

ADA Ready for PUMP or what ?Currently, ADA is forming an ascending triangle, indicating a potential price increase. It is anticipated that the price could rise, aligning with the projected price movement (AB=CD).
However, it is crucial to wait for the triangle to break before taking any action.
Give me some energy !!
✨We spend hours finding potential opportunities and writing useful ideas, we would be happy if you support us.
Best regards CobraVanguard.💚
_ _ _ _ __ _ _ _ _ _ _ _ _ _ _ _ _ _ _ _ _ _ _ _ _ _ _ _ _ _ _ _
✅Thank you, and for more ideas, hit ❤️Like❤️ and 🌟Follow🌟!
⚠️Things can change...
The markets are always changing and even with all these signals, the market changes tend to be strong and fast!!

ADAUSDT Flashing Bearish Signals – Is a Drop Incoming?Yello, Paradisers! Are we about to see a strong rejection on ADAUSDT? Let’s break it down.
💎ADAUSDT has filled the Fair Value Gap (FVG) and formed a double top with bearish divergence. Notably, the right top is slightly above the left, signaling a liquidity grab. Following this, we’ve seen a Change of Character (CHoCH) to the bearish side, increasing the probability of a downside move.
💎If ADAUSDT retraces from this level, it will strengthen a high-probability bearish setup from the 1-hour FVG, where the 0.5 Fibonacci level aligns—offering an attractive risk-to-reward (RR) opportunity for shorts.
💎However, if price breaks and closes above the 0.786 Fibonacci level, our bearish outlook will be invalidated. In that case, it would be best to step back and wait for stronger confirmation before taking action.
🎖 Patience and discipline win the game, Paradisers! Don’t chase—wait for the best setups and protect your capital like a pro.
MyCryptoParadise
iFeel the success🌴

Cardano Rangebound – Is a Breakout or Breakdown Imminent?📉 ADA is Rangebound! I’m watching closely—if price breaks out of this consolidation, it could set up a strong trading opportunity.
🎯 In this video, we analyze the market structure and price action, breaking down a possible trade setup—if the right conditions align.
🚨 Stay sharp, manage risk—this is not financial advice! 🚀🔥

ADAUSD NEXT MOVESell after bearish candle stick pattern, buy after bullish candle stick pattern....
Best bullish pattern , engulfing candle or green hammer
Best bearish pattern , engulfing candle or red shooting star
NOTE: IF YOU CAN'T SEE ANY OF TOP PATTERN IN THE ZONE DO NOT ENTER
Stop lost before pattern
R/R %1/%3
Trade in 5 Min Timeframe, use signals for scalping
