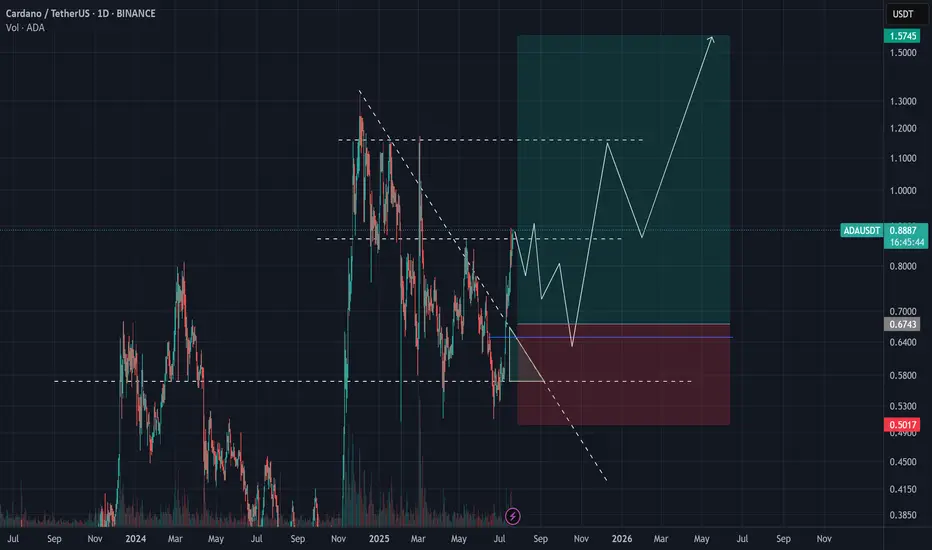
ADAUSDT BUY LONG ADAUSDT BUY LONG Weekly BISI
BullRun will starts it will going to moon for 4-5 month in daily tf .
Valid Mss with ValidOBI our buying zone .54 $ - .72 $ target atleast 7 - 10 $
holding for 3-5 month from buying , deeply buying from this weekly bisi , IF Market will more
correction then more opportunity to buy in deep , patiently wait for Enjoyable Returns
Just Hold & Enjoyyyyyyyyyyyyyyyyyyyy
~ KGB Priyabrta Behera ~
ICT Trader & Advance Mapping SMC Trader
ADAUSDT trade ideas
ADA Spot Entry – Pullback Opportunity AheadADA has reached a major resistance zone, and with the broader market appearing overbought, a healthy pullback looks likely. We’re watching for a dip into the next key support area to accumulate for spot holdings.
📌 Trade Setup:
• Entry Zone: $0.75 – $0.77
• Take Profit Targets:
o 🥇 $1.00 – $1.15
o 🥈 $1.50 – $1.60
• Stop Loss: Just below $0.72
ADA/USDT | Multi-Month Breakout Brewing — a 10x play ?Cardano is quietly mirroring its previous macro cycle — but this time, the structure looks tighter, cleaner, and potentially more explosive.
The multi-month chart reveals a consistent uptrend forming off the 2022 lows, contained within a well-respected ascending channel. The price action shows strong similarities to the 2018–2020 accumulation phase, followed by the breakout that led ADA to its all-time high in 2021.
The current price structure is forming higher highs and higher lows within a channel — a strong bullish continuation pattern.
Volume has been increasing steadily during the up-moves, signaling real demand building underneath.
Fibonacci Extensions from the previous cycle highs and lows show key long-term resistance zones:
1.618 – $4.91
2.618 – $7.79
4.236 – $12.47
These levels could act as major psychological targets if the trend continues to evolve similarly to the last cycle.
⏳ Current Price (~$0.64) is still significantly below previous all-time highs and long-term extension zones — offering a potentially favorable risk/reward setup for patient investors.
⚠️ As always, nothing moves in a straight line — but if you're a macro-mind investor, you’ll start to notice more straight lines than most. Zooming out often reveals the patterns that noise hides.

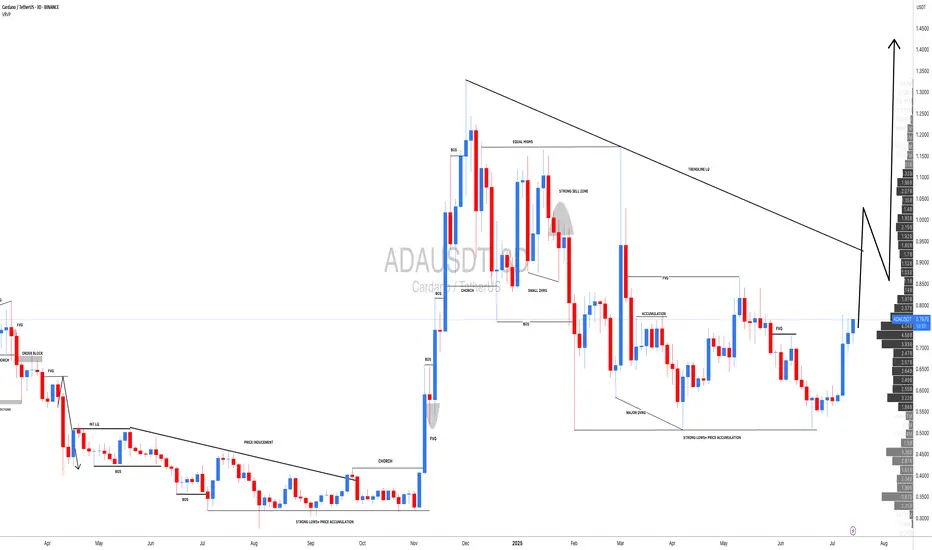
ADA/USDT | BIG Bullish Move Ahead! (READ THE CAPTION)By analyzing the Cardano chart on the 3-day timeframe, we can see that, as expected, the price continued its rally, reaching $0.89 before collecting liquidity above the $0.86 level and then facing a correction. Currently trading around $0.81, we expect the bullish trend to continue after this minor pullback. Key demand zones are at $0.78, $0.69, and $0.61. Based on the previous analysis, the next short- to mid-term bullish targets are $0.93, $1.05, and $1.33.
Please support me with your likes and comments to motivate me to share more analysis with you and share your opinion about the possible trend of this chart with me !
Best Regards , Arman Shaban

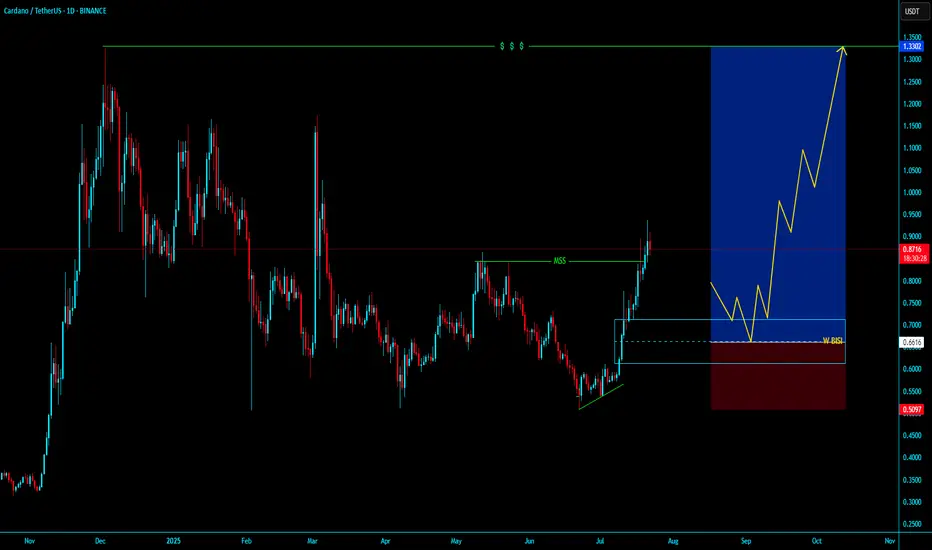
Cardano (ADA) Analysis – July 20, 2025The breakout above the $0.80 level was a major technical milestone for Cardano.
✅ The price not only breached the resistance, but also confirmed it with a strong daily close — clearly signaling that sellers have lost control of the market.
Now, we’re likely to see buyers step in and take over the trend.
🕒 For a more optimal and lower-risk entry, I suggest watching the $0.64 area.
There’s a strong possibility that liquidity around this zone could push the price aggressively toward $2.20, backed by solid bullish momentum.
🎯 This setup offers a promising upside — stay alert for confirmation signals.
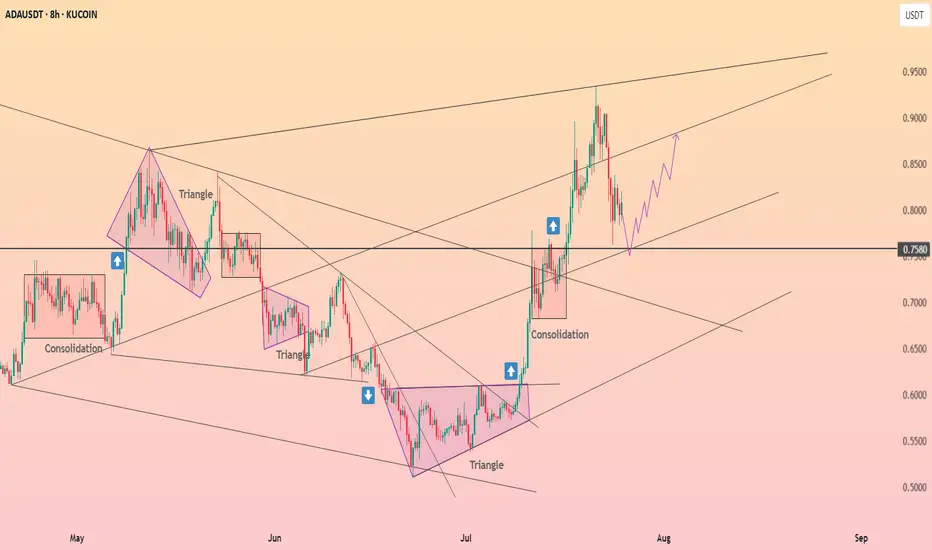
Cardano (ADA) Just Flipped Bullish — Next Stop: $0.9373?ADAUSDT is currently displaying a strong bullish structure on the 4-hour chart, bouncing from a critical support zone near $0.7774–$0.7315. After a healthy retracement, the pair appears to be regaining momentum, forming a potential higher low, which aligns with the continuation of the broader uptrend that started earlier this month.
Recent price action confirms that buyers are stepping in at key zones previously marked by blue “B” labels, and sell-side pressure seems to be weakening after the last swing top around $0.9373. The support zones, marked with dotted green lines, have held well, and the current structure suggests a rebound toward the previous high.
The most recent small leg up shows the formation of a bullish engulfing setup near $0.78, which could serve as a launch point toward the higher resistance. The candlesticks are also showing longer lower wicks — a sign that buyers are defending lower levels aggressively. With price currently floating near $0.81, there’s a good upside window available.
Here’s the trading setup based on the chart:
• Entry: Around $0.8106 (current price zone)
• Take Profit (TP): $0.9373 (previous swing high — +18.23%)
• Stop Loss (SL): $0.7315 (invalidates higher low structure — -7.73%)
• Risk-Reward Ratio: 2.36R (favorable for swing positioning)
If ADA can reclaim the $0.85 zone with strong candle closures, it would signal bullish continuation. Momentum indicators like RSI or MACD (not shown) would likely confirm the shift, especially if divergence was forming on recent dips.
Until ADA breaks below $0.7315, the bullish bias remains intact. The formation of higher lows and increasing buying interest at dynamic supports adds weight to the long setup. Price reclaiming the $0.85 zone may trigger a fast rally to $0.93, and possibly beyond if market-wide sentiment remains risk-on.

Cardano held above $0.76 ┆ HolderStatBINANCE:ADAUSDT is compressing under $0.44 with support from $0.418. Breakout from wedge structure may target $0.462. If $0.418 breaks, downside risk opens to $0.40. Watch for volatility.
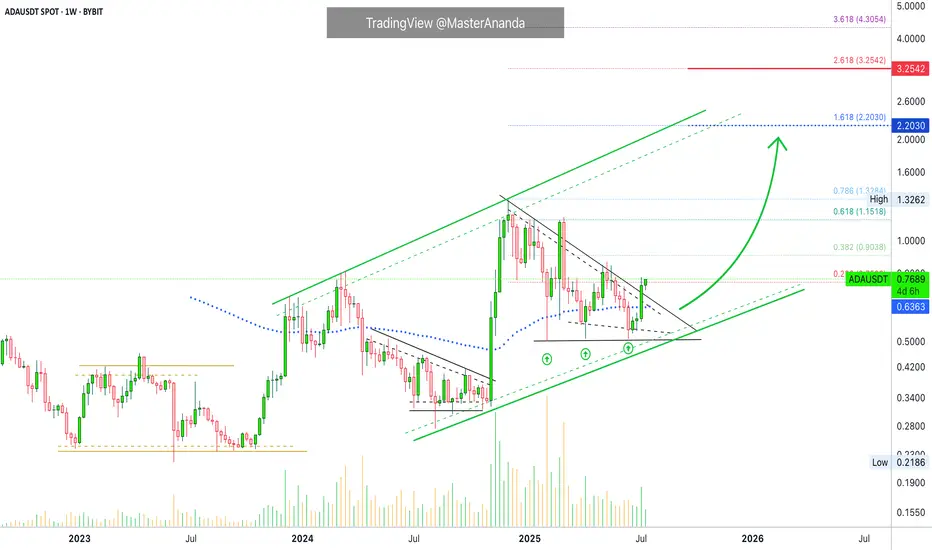
$2.2 Followed by $3.25 · Cardano Trend-Based Fib ExtensionCardano is a on a clear, and very strong, ascending channel rising since June 2023. We are clear, safe and confident about the bigger-broader market trend. An uptrend within a long-term bullish cycle.
After the peak in early December 2024 Cardano struggled to stay above EMA89—the blue dotted line on the chart—but this isn't the case anymore. After a triple-bottom, shy higher lows, last week ADAUSDT managed to break decisively above this level with a full green candle. This confirms the resumption of the late 2024 bullish wave.
Last week resistance was found at 0.236 Fib. extension. The weekly session closed right below it and this is shown as a thin tiny red dotted line on the chart. The current week is halfway through and ADAUSDT is now trading above this level. The bullish signal comes from the fact that the action is happening at the top of the candle; this is the fourth consecutive green week; the bullish bias is fully confirmed.
That is all there is. I just wanted to share a small update in support of our bullish bias based on chart data. You can rest easy knowing that the market will continue to grow.
Next target is $2.20 for 188%. Followed by $3.25 for 325%.
We use leverage on the big projects so the potential for profits can be multiplied by 5, 6, 7, 8, or 10X. The risk is higher of course, but so is the potential for reward. High risk vs a high potential for reward. You can always approach the pair spot if uncertain. If you lack experience but still want to join the ride, enjoy the rise, make money and have fun, you can buy spot, that is, buy and hold. The market will give you money if you are patient enough. This is the period where everything grows. Thanks a lot for your continued support. If you enjoyed the content consider hitting follow.
Namaste.
ADA potential breakoutADA is near a breakout point on the daily timeframe. If we break out the triangle I have 2 targets.
Target 1: $1.135
Target 2: $1.325
Best of luck to all.

accordion to the moonhows and whys of the trade of way out of your IQ level,I'm an Iranian and i'm not going to make you muricans rich while you bomb my country. if it does break above it first high that it will form it becomes really high probability and that's why i published this.

ADA / USDT lying on support ,ready to bounce and break trendlineADA/USDT broke above horizontal resistance and is now retesting from the trendline above. If it holds this support and bounces, a strong move toward $1.00, $1.20, and even $1.40 could follow. One to watch closely in the coming days.

DeGRAM | ADAUSD holding above the support level📊 Technical Analysis
● Mid-July breakout from the 10-week falling wedge cleared the long-term resistance line; price retested that line & the 0.756 support band (prior range high) and printed a higher-low on the rising channel’s lower rail.
● The new up-sloper guides bulls toward the channel crest / horizontal target at 0.880, while the 0.775–0.780 zone now acts as a launch pad for the next leg.
💡 Fundamental Analysis
● Buzz around August’s Chang governance hard-fork and a 12 % m/m jump in Cardano TVL signal improving network demand, backing the technical upside.
✨ Summary
Buy 0.775-0.790; hold above 0.756 eyes 0.86 ▶ 0.88. Bull view void on a 16 h close below 0.72.
-------------------
Share your opinion in the comments and support the idea with a like. Thanks for your support

Major Move Ahead for ADA – Breakout or Breakdown?
🔍 ADA/USDT Analysis – Dual Scenario Setup (BUY & SELL)
Currently, ADA is ranging between major supply and demand zones. Two clear scenarios are in play depending on how price reacts to key levels:
📈 Bullish Scenario (Long):
Entry: On breakout and confirmation above $0.6027
Target: $0.869 (major resistance zone)
Stop Loss: Below $0.523
Trigger: Break of descending trendline and solid structure above $0.6027
📉 Bearish Scenario (Short):
Entry: Around $0.5120 (rejection from supply zone)
Target: $0.315 (strong demand zone)
Stop Loss: Above $0.6027
Trigger: Failed breakout and rejection from $0.5120 level, with confirmation below it
📌 Based on the descending channel structure, this might have been the final leg of the downtrend, and a reversal to the upside could be underway. However, for confirmation, we prefer to wait for stronger price action signals before fully committing.
🛑 Always use risk management. Market remains bearish until proven otherwise.

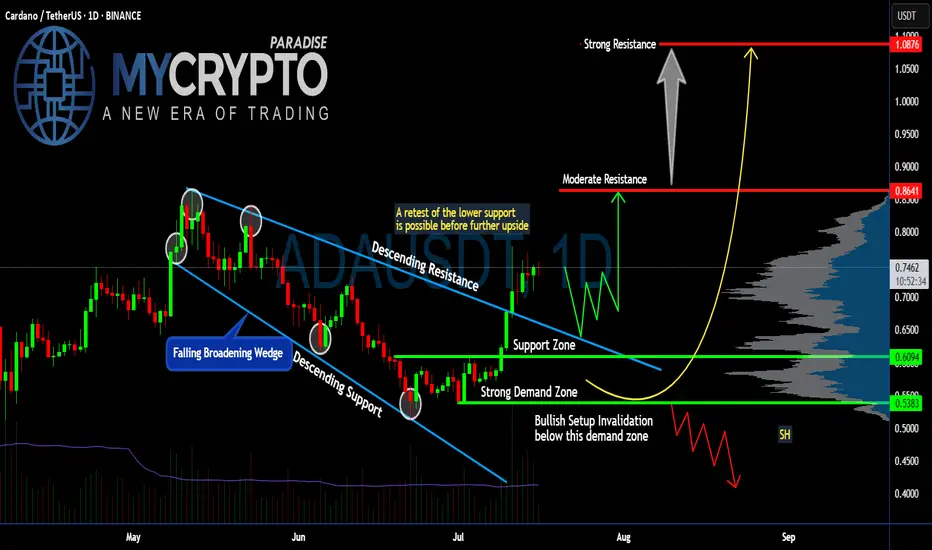
Is #ADA Ready For a Major Move or a Trap is Ahead? Watch this Yello, Paradisers! Is this breakout on #Cardano the start of a major upside move or just another bull trap waiting to flush out impatient traders? Let’s break down the latest #ADAUSDT setup:
💎After weeks inside a falling broadening wedge, #ADA finally broke above the descending resistance, signaling a potential trend reversal. The breakout above $0.70 has pushed the price toward the current $0.74 zone. The soaring volume and a positive broader market outlook reinforce our bullish bias. While this looks bullish, the key question is whether #ADAUSD will hold above its reclaimed support or retest lower levels first.
💎The structure is straightforward: #ADA reclaimed the support zone around $0.70 after bouncing strongly from the demand zone near $0.61–$0.60. This demand zone remains the critical area to watch—any healthy retest here would provide a high-probability continuation setup for bulls.
💎If buyers maintain control, the first target sits at the moderate resistance of $0.86. That’s where the next notable selling pressure is expected. But the real battle will take place near the strong resistance at $1.08—a zone where major distribution and profit-taking could occur.
💎However, the bullish setup becomes invalid if #ADAUSD loses the $0.61–$0.60 demand zone. A confirmed close below $0.538 would flip the structure bearish, signaling a potential continuation to lower lows.
Stay patient, Paradisers. Let the breakout confirm, and only then do we strike with conviction.
MyCryptoParadise
iFeel the success🌴
Cardano: Still Boring or Finally Ready to Move?🧐🔁 Cardano: Still Boring or Finally Ready to Move? 🚦📈
Welcome to the Altcoin Series, kicking off this weekend with none other than Cardano (ADA).
Later on I will explain why i will be 'Divorcing Alts' and just trade them, but that time will be at the cycle end, not now.
It’s Saturday, July 12th — a classic retail weekend after a solid macro pump. Salaries are hitting accounts, the charts are alive again, and it's time to look at structure over sentiment.
🔍 A Personal Note on ADA
I was fortunate to exit near the top during the Cardano Summit in Athens (2021) — not just due to chart structure, but after meeting with developers and understanding how deeply Haskell shapes this ecosystem. And what a challenge that seemed!
Haskell, while academically impressive, has proven difficult to scale, and in practice, it's slowed down development. Expectations were sky-high, but reality hit hard. And let’s be honest — Cardano has been boring for years.
But that boredom may be hiding something...
I’ve still been 'going Long' under key levels, because when you zoom out — Cardano is still U.S.-centric , regulation-aware, and deeply rooted . In a time when the U.S. might look to lead crypto adoption, especially with figures like Trump signaling support , Cardano could become part of that narrative.
⚙️ Technical Setup
The recent pump from Nov–Dec 2024 was rejected right at $1.193 — our second test of that critical resistance. But now, we’re staring down a potential third test, with Test #3 marked on the chart near $1.15, and this time, the context is shifting.
✅ TOTAL3 structure is bullish
✅ Retail energy is back
✅ Altcoin momentum is quietly building
🔑 Key Levels
Support Zone:
🟢 $0.70–$0.71 — the current base to hold
Target Zones:
🔹 $1.15–$1.19 — Third test of resistance
🔹 $1.47
🔹 $1.89
🔹 $3.02
🔹 Top Extension Target: $3.65
A break above that descending level could turn this "boring" coin into one of the cleanest long continuation setups of the cycle.
📌 We trade technicals, not hope:
✅ Buy over support
✅ Exit under resistance
✅ Control risk, always
So… will Cardano keep boring us? Or is it finally time for a show?
One Love,
The FXPROFESSOR 💙

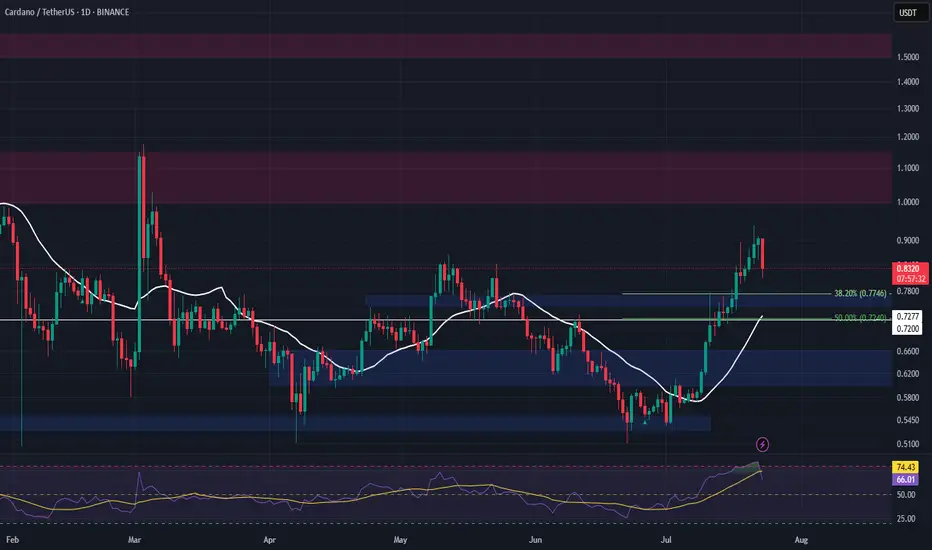
Inside day breakoutYesterday was an inside day. On the daily chart it is breaking out, pulled back to 50% and supported by 200ma + 20ma. Ascending triangle supported by 20ma above 200ma into the Asian session. Looking to hold till close

ADAUSDT: $1.50 Year End Target, Is It Possible? The price has remained steadily bullish, but we haven’t seen a strong bullish impulse in the daily timeframe yet. This suggests that we’ll likely reach the $1.50 price range. Please wait for the price to break out and then enter a trade when it shows confirmation. You can use smaller timeframes while taking any entry. Good luck and trade safely!
Like and comment for more!
Team Setupsfx_
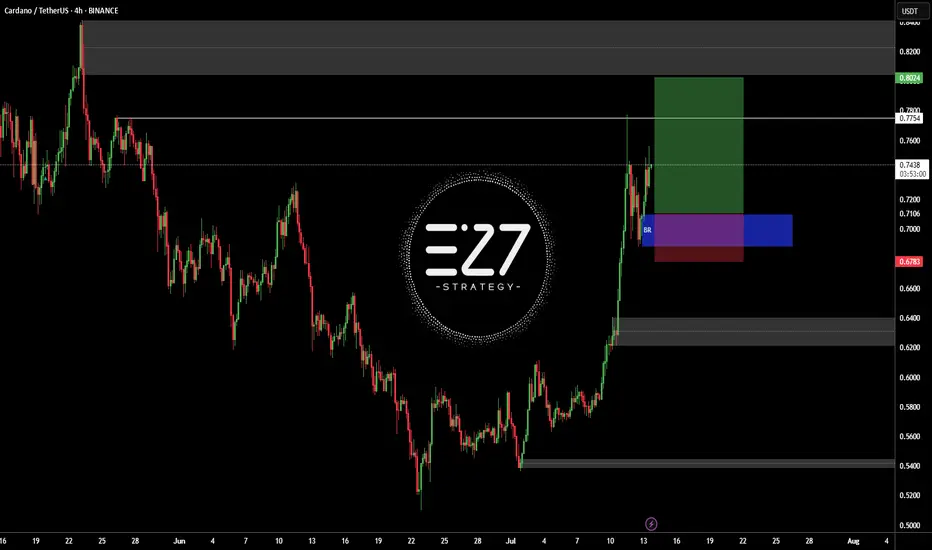
ADAUSDTBINANCE:ADAUSDT in up-trend and my open position buy in latest sowing low.
Best entry: 0.6952 - 0.7259
Target: 0.7754 - 0.8024
Stop loss: 0.678
Please control RISK management
ADA - Beginning of something crazy- ADA is looking forward to the successfully breakout of the trendline resistance.
- A clean breakout from this resistance must to fuel the bullish trend.
- I'm expecting a target of 3$ from this trend.
Entry Price: 0.72
Stop Loss: 0.4838
TP1: 0.8602
TP2: 1.0342
TP3: 1.3379
TP4: 2.0144
TP5: 2.4818
TP6: 3.0329
Stay tuned for more updates
Cheers
GreenCrypto

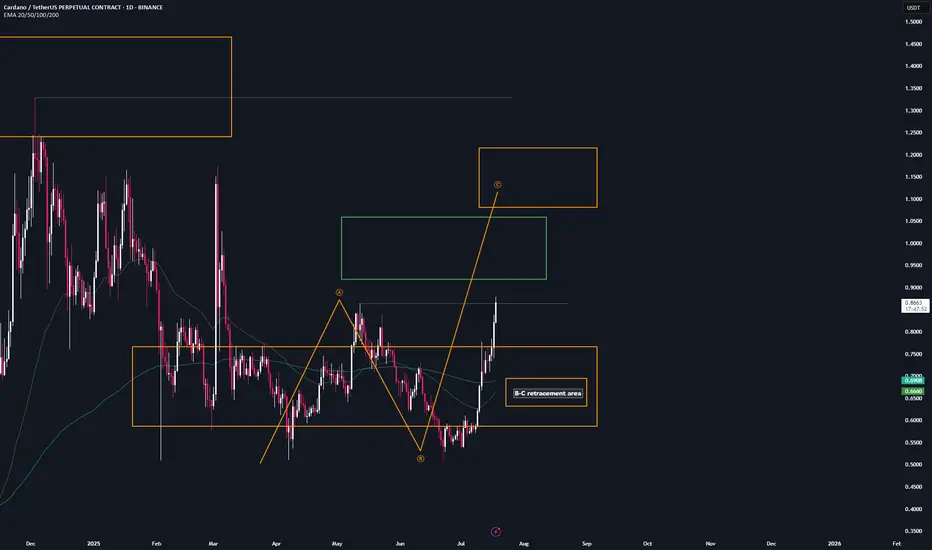
ADA | Trade setup📌 After the breakout from the last high at $0.86, a bullish sequence (orange) has now been activated.
📊 These setups typically occur no more than twice per year on any given altcoin, so I’ll be aggressively buying each level at the B-C retracement area.
Trademanagement:
- I'm placing long orders at each level. ((If the price continues climbing, I’ll adjust the trend reversal level (green) accordingly and update my limit orders.)
- Once the trade reaches a 2 R/R, I’ll move the stop-loss to break-even.
- From a 3 R/R onward, I’ll start locking in profits.
✅ I welcome every correction from here on —
but I won’t enter any new positions at these top levels.
Stay safe & lets make money
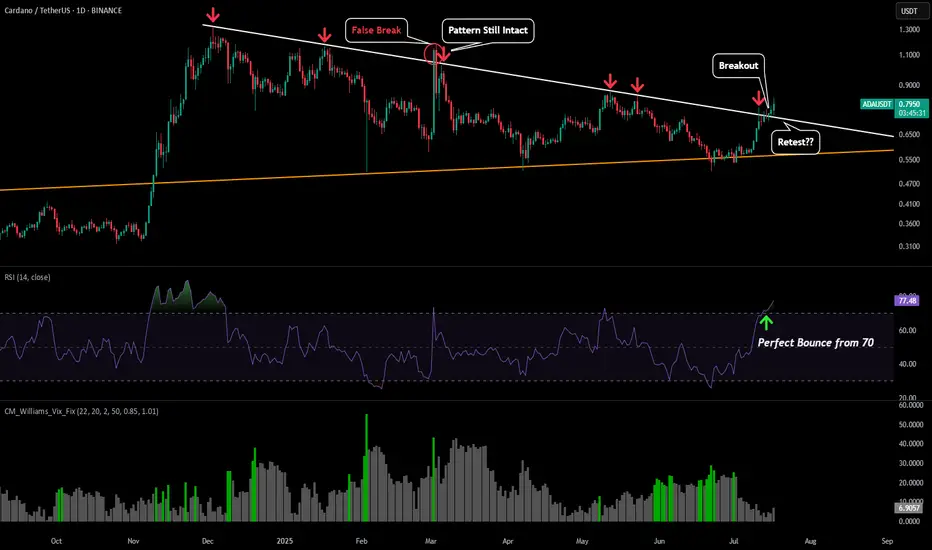
ADA - Monitor BreakoutWe have already seen ADA breakout of its symmetrical triangle, but if BTC does have a downswing we could see ADA retest the triangle as support to provide entries.
Retest would most likely align somewhere between $0.72-$0.74.
However the 1D RSI is showing tremendous strength with the bounce from the 70 level, so if there is no retest and price continues to breakout, our primary target would be around $1.14.
ADA/USDT : +50% in 21 Days, More Rise Ahead? (READ THE CAPTION)Over 50% growth in just 21 days — Cardano’s explosive rally continues, and the $0.76 target has now been hit! Since our last analysis, ADA has kept pushing higher, successfully reaching the next key level and bringing the total return from this move above 50%. Currently trading around $0.73, with strong bullish momentum still in play, I expect it won’t be long before we head toward the next targets. Upcoming levels to watch: $0.93, $1.05, and $1.33 — we’re getting closer to that 100% gain!
Please support me with your likes and comments to motivate me to share more analysis with you and share your opinion about the possible trend of this chart with me !
Best Regards , Arman Shaban

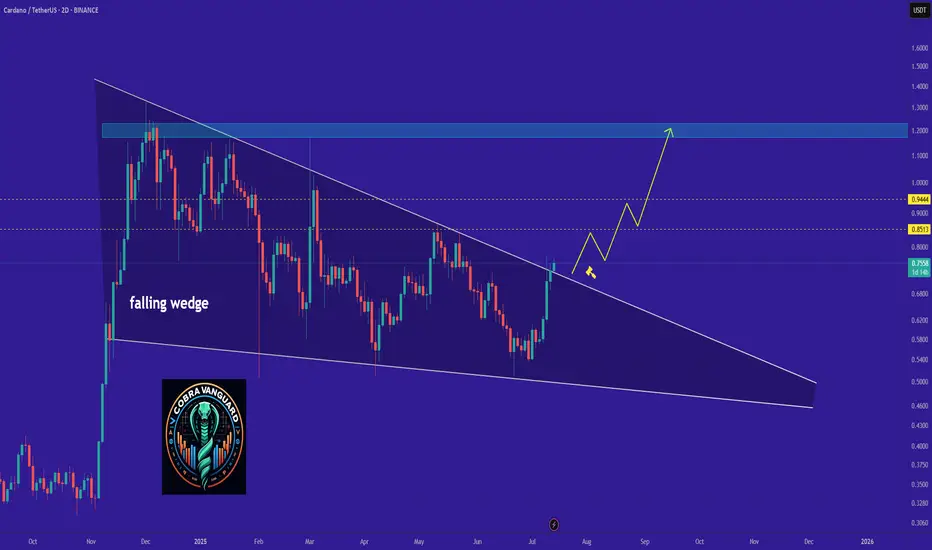
ADA - Time to buy again!The price has broken the wedge pattern, which means it can easily reach its previous high or even go higher.
Best regards CobraVanguard.💚