ADA / Bulish or Bearish
Hello everyone,
Here’s my analysis of ADA/USDT.
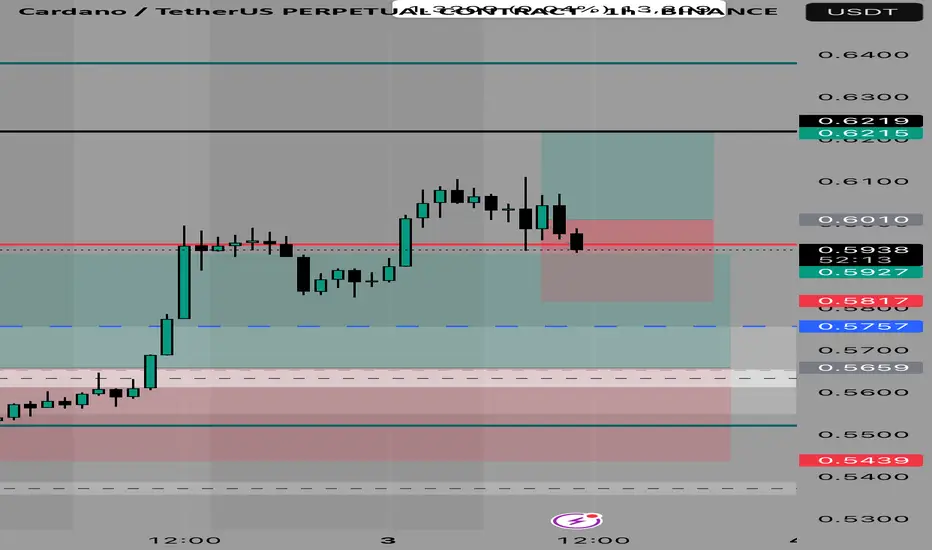
Cardano dropped back below the key level of 0.7446 after a failed breakout. Based on the current market conditions, we can consider three potential scenarios:
1️⃣ Range Scenario:
Price may consolidate between 0.7446 – 0.7041 for up to two weeks.
2️⃣ Bullish Scenario:
A new bullish move depends on a breakout of one of the following levels:
A. Riskier long position: Breakout above 0.7446
B. Safer long position: Breakout above 0.7600
🟡 Note: In scenario B, the stop-loss will naturally be wider.
3️⃣ Bearish Scenario:
A breakdown below 0.6892 could occur — but this does not immediately suggest a short setup.
❗️In that case, we must re-analyze TOTAL, TOTAL2, USDT.D, and BTC.
✅ If the overall market is bearish, a short could be valid.
🟡 Otherwise, it may simply be a deeper correction rather than a trend reversal.
---
🙏 Thanks for reading!
If you found this analysis helpful, hit the 🚀 icon to support the content.
#Cardano #ADAUSDT #CryptoAnalysis #TechnicalAnalysis #Altcoins #TradingStrategy #MarketOutlook #SwingTrade #CryptoTA #BitcoinDominance #TotalMarketCap #USDTdominance #PriceAction
ADAUSDT trade ideas

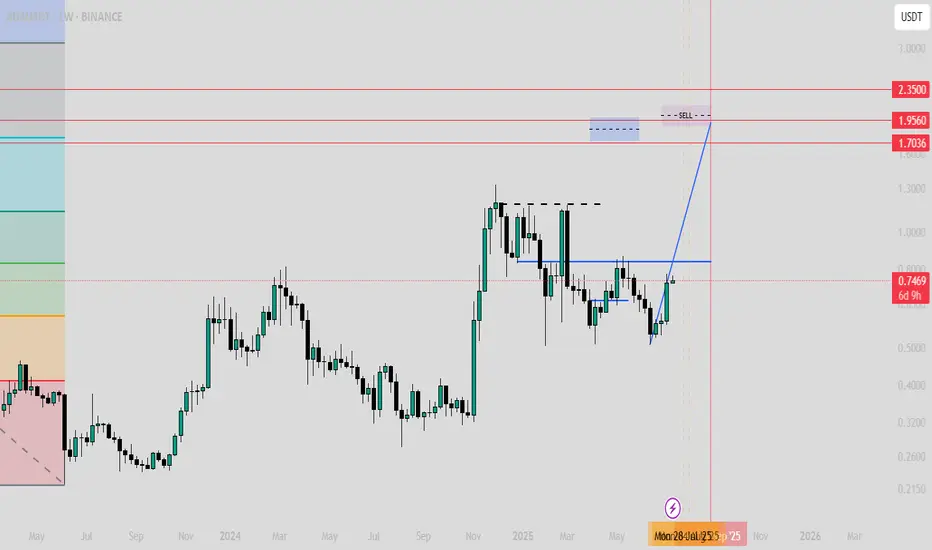
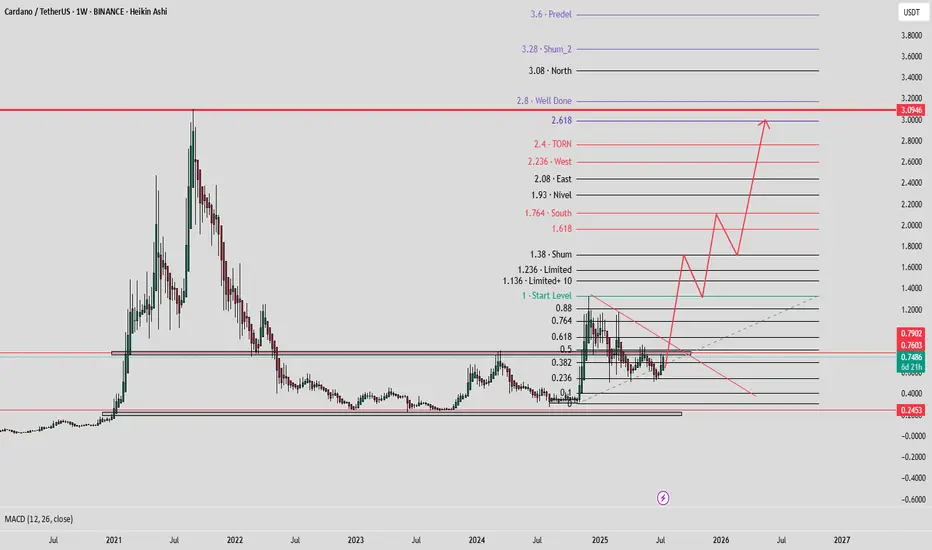
$ADA or Cardano analysis (Target is between 1.8 to 2.1)CRYPTOCAP:ADA or Cardano analysis (Target is between 1.8 to 2.1)
this zone is based on few factors such as historical price behavior and fibbo targets
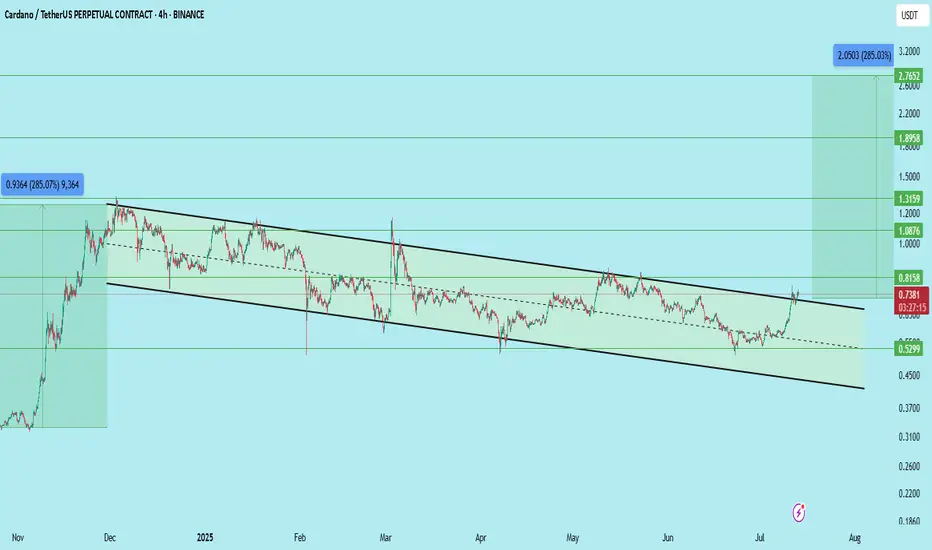
ADA/USDT – Bullish Breakout & Retest ConfirmedCardano (ADA) has broken out of a long-standing descending channel and successfully retested the breakout level, showing signs of strong continuation.
Key Observations:
Price broke above the upper trendline of the multi-month falling channel
Retest of breakout zone around 0.74 held firmly
Momentum building after reclaiming key resistance at 0.8158
Entry: Current zone around 0.74–0.75 (post-retest)
Targets:
0.8158
1.0876
1.3159
1.8958
Final target: 2.7652
Stop Loss: Below 0.70 (based on retest invalidation)
This setup has a macro upside potential of over 285% based on the channel breakout projection.
As long as ADA holds above the breakout zone, this structure remains valid and could lead to a sustained rally.
DYOR | Not Financial Advice
ADA all the way Cardano's Ascent: A Technical Outlook for Q3-Q4 2025
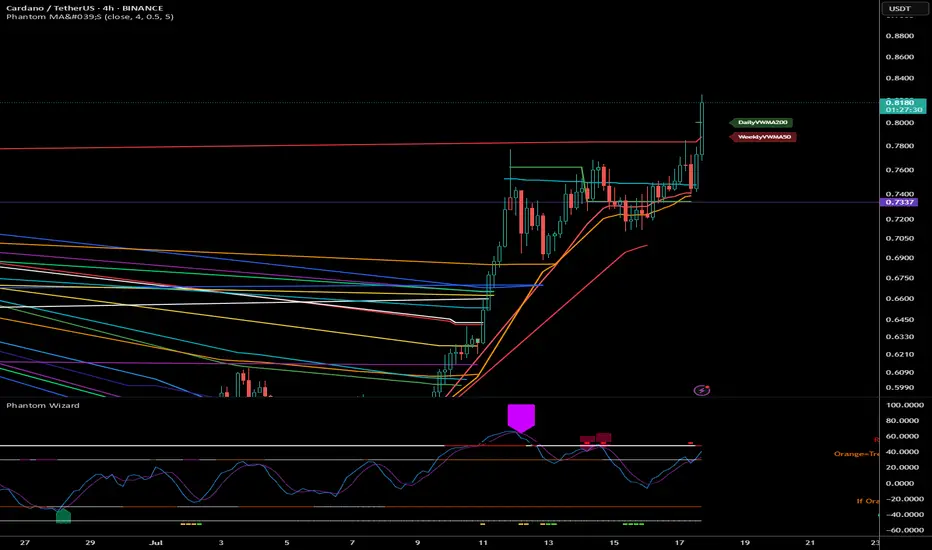
Breaking Through Resistance: Cardano's Path to $1.00 and Beyond
Following a period of extended consolidation, Cardano (ADA) has demonstrated a significant shift in character, breaking out decisively from a key resistance zone. Currently trading near $0.82 as of July 18, 2025, ADA has entered a new phase of bullish momentum. This analysis will dissect the technical landscape to project its potential trajectory through the end of the year, identifying critical price levels and probable targets.
Current Market Context
After consolidating in a range between $0.70 and $0.77 for several weeks, ADA has executed a powerful breakout, surging over 15% in the last few days to establish a multi-month high at $0.825. This move signals a clear victory for buyers and a potential end to the preceding sideways market structure. The immediate challenge for bulls is to defend this breakout level and convert prior resistance into firm support, setting the stage for the next major leg higher.
RSI Analysis: Emerging Strength with Room to Run
The recent price surge has propelled the daily Relative Strength Index (RSI) into overbought territory, currently reading above 70. While this often signals a short-term exhaustion and suggests a minor pullback or consolidation is likely, the underlying momentum on higher timeframes remains constructive.
The weekly RSI is trending sharply upwards from the neutral 50-level but remains well below the extreme overbought readings (80+) that have historically marked major cycle tops for ADA. This divergence between short-term overbought conditions and long-term momentum capacity is a classic sign of a healthy, strengthening trend. It indicates that while a brief pause is probable, the primary path of least resistance remains upward for the coming months.
Price Action & Volume Analysis: The Anatomy of a Breakout
The price action leading up to this point exhibits classic signs of accumulation followed by a markup phase:
Accumulation Phase: The trading range between $0.70 and $0.77 showed contracting volatility and was likely a period of "cause-building," where informed market participants accumulated positions.
Sign of Strength (SOS): The recent impulsive move from $0.77 to over $0.82 represents a clear SOS. This breakout was likely accompanied by a significant increase in volume, confirming the market's conviction and overwhelming sellers who were active at the resistance level.
A successful retest of the breakout zone at $0.75 - $0.77 on diminishing volume would be the strongest possible confirmation of a new, sustainable uptrend.
Supply and Demand Zone Analysis: Charting the Path Forward
The recent breakout has fundamentally altered the market structure, turning a key supply zone into a new floor of demand.
Major Demand Zone (New Support): A critical demand zone has now been established between $0.75 - $0.77. This area, formerly resistance, is now the most important level for bulls to defend to maintain the bullish structure.
Secondary Support Cluster: Should the primary zone fail, the next significant support lies at $0.68 - $0.70, the floor of the previous accumulation range.
Overhead Supply Zones: Unlike an asset at all-time highs, ADA faces historical resistance. The next major supply zones are located near $0.95 and, more significantly, the psychological and technical barrier at $1.10 - $1.15.
Fibonacci Extension Framework: Projecting Bullish Targets
Using the recent swing low of the accumulation phase (approx. $0.70) and the recent swing high ($0.825), we can project logical price targets for the current impulse wave:
The 127.2% extension projects a target of approximately $0.88.
The 161.8% extension, a common target for strong trends, points toward $0.92.
A more extended move to the 200% extension suggests a potential test of $0.97, aligning closely with the psychological $1.00 level.
These Fibonacci-derived targets provide a clear roadmap for the potential upside if the current bullish momentum is sustained.
Price Projection Timeline
Late July - August 2025:
Expect a period of consolidation or a healthy pullback. The overbought daily RSI suggests the market needs to pause. A retest of the $0.77 support level would be a prime opportunity for trend-continuation entries. A successful defence of this zone is critical.
September - October 2025:
Following the consolidation, the trend is expected to resume, targeting the Fibonacci extension levels of $0.88 - $0.92. This move would represent the confirmation of the new uptrend and would likely attract a second wave of buyers.
November - December 2025:
Should the Q4 market environment remain favourable, a push toward the major psychological and technical resistance at $1.00 - $1.15 is highly probable. This would represent a significant milestone and could trigger a more substantial corrective phase as long-term holders take profits.
Support Zones:
Primary: $0.75 - $0.77 (The breakout point; must hold)
Secondary: $0.68 - $0.70 (Floor of the previous range)
Resistance & Target Zones:
Immediate: $0.825 (Recent high)
Target 1: $0.88 - $0.92 (Fibonacci cluster)
Target 2: $0.97 - $1.00 (Fibonacci & psychological level)
Major Resistance: $1.10 - $1.15 (Historical supply zone)
Conclusion: The Road to One Dollar
The technical evidence strongly suggests that Cardano has initiated a new bullish impulse wave. The breakout from its multi-week consolidation range is a significant technical event that has shifted the market bias firmly in favour of the bulls. While a short-term pullback to retest the breakout level around $0.77 is a high probability, this would likely serve as a healthy reset before the next major advance.
Based on the confluence of price action, momentum analysis, and Fibonacci projections, a move toward the $0.95 - $1.15 range is a realistic objective for Cardano by the end of 2025.
ADA LONG TRADE ADA has broken out of its long-term wedge pattern and looks poised for a move higher. With such a strong risk-to-reward setup, the trade makes sense even without a large position—especially important given the uncertainty around current tariff discussions.

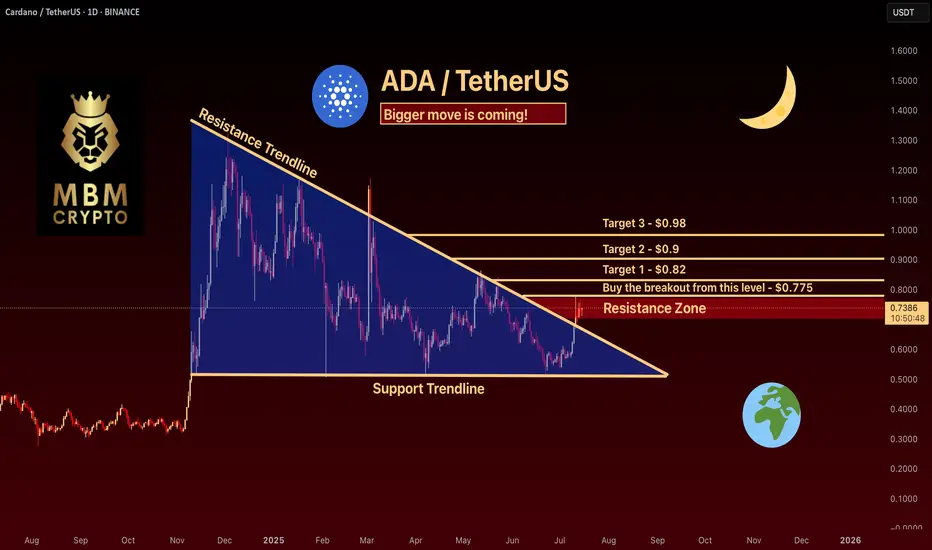
ADA: Keep an eye on this setup!If you're looking to trade ADA at the moment, here's a quick setup that you might find helpful!
The idea is: Buy when the price breaks above $0.775 and take profits at the levels shown in the chart.
Targets:
1. $0.82
2. $0.9
3. $0.98
-------------------------------------------
About our trades:
Our success rate is notably high, with 10 out of 11 posted trade setups achieving at least their first target upon a breakout price breach (The most on TW!). Our TradingView page serves as a testament to this claim, and we invite you to verify it!
CARDANO WILL BE $2!Our first downside target was touched, but then it failed to reach the second target and the g-wave ended at 0.54.
Based on past price movement, we can expect the price to reach $1.5-$2.
Good luck
NEoWave Chart

Will Cardano’s breakout drive a 15% surge to $0.80?Hello✌
let’s dive into a full analysis of the upcoming price potential for Cardano 📈.
BINANCE:ADAUSDT has broken out of its descending channel with strong volume, indicating a potential bullish reversal. Price is currently near a key support level, setting the stage for further upside. A move toward the $0.80 target, offering at least 15% gain, looks likely. 📊🔥
✨ Need a little love!
We pour love into every post your support keeps us inspired! 💛 Don’t be shy, we’d love to hear from you on comments. Big thanks , Mad Whale 🐋

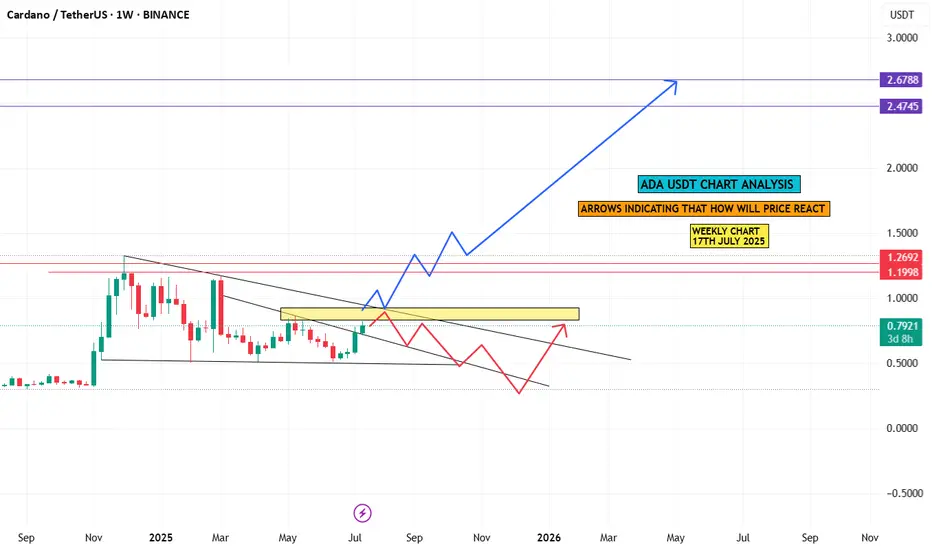
ada chart analysiscardano weekly chart analysis n arrows indicating that how will price react in upcoming
days or months,
Trading plan for ADALast week, BINANCE:ADAUSDT showed strong upside momentum, breaking the daily timeframe downtrend line and currently holding above $0.7. We're now observing a hidden bullish RSI divergence, suggesting potential continuation toward our third monthly target at $0.82. However, a breakdown below the weekly pivot point could trigger a drop back to the trendline. Full analysis in the video
Trade safe and stay adaptive

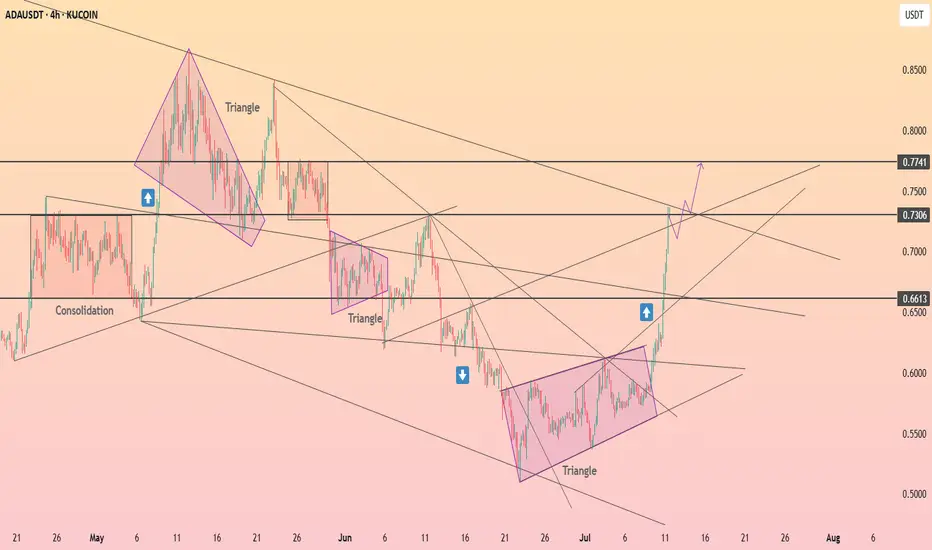
HolderStat┆ADAUSD seeks to $0.774KUCOIN:ADAUSDT recently broke out of a multi-week triangle formation on the 4H chart. The clean break above 0.66 has invalidated the previous downtrend and triggered a new leg higher. With ADA currently riding within an ascending channel, the path toward 0.73–0.75 remains open as momentum continues building.
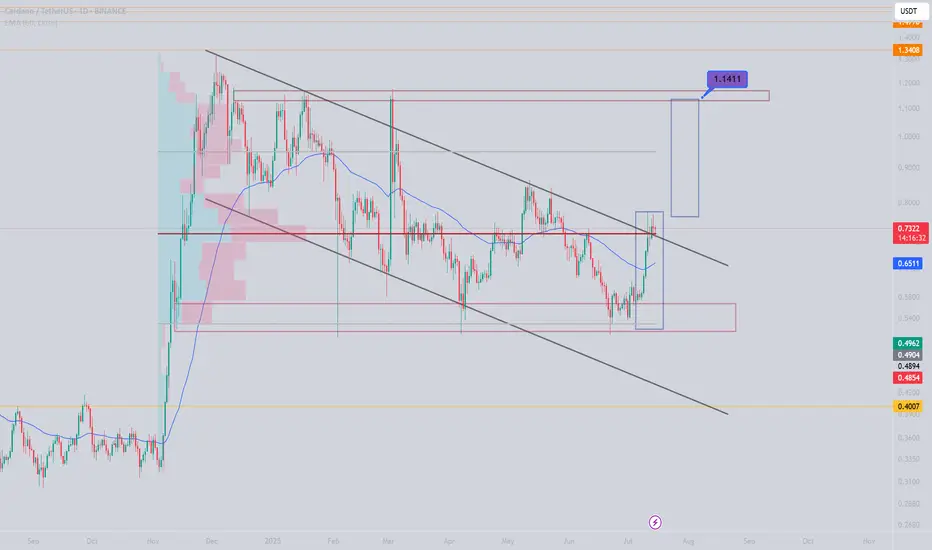
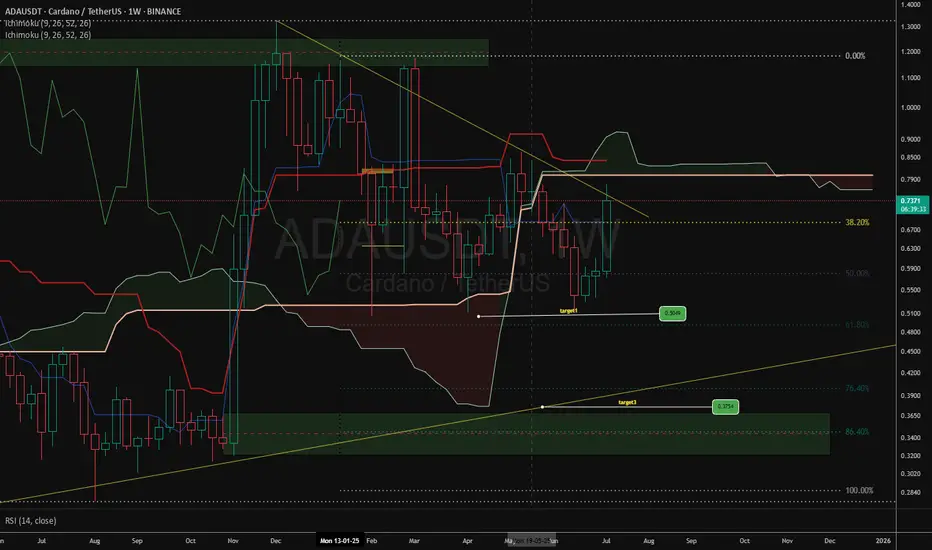
ADAUSDTWith the price stabilizing above the volume range and the descending channel, and if the market sentiment remains positive, we can expect growth to 1.14 in the first step and then 2.
3ADA Almazov Projection#ADAUSD ALMAZOV PROJECTION WEEKLY
Price projection according to Almazov's theory, #ADA should at least touch $1,71 before pulling back or continuing to go long if its dimensionality decreases (2.0).
ADA | Trade-updateWe’re in full profit on our CRYPTOCAP:ADA trade.
I took the final profits at the target zone (yellow); just a small portion is still running.
Gave yall that one for free — 68 R/R, lol.
Your win rate doesn’t need to be high — 30–40% with solid R/R is enough to be profitable.
Have a blessed day!

DeGRAM | ADAUSD above the demand zone📊 Technical Analysis
● ADA is testing the confluence of the long-term support line and the 0.54-0.63 demand zone; every prior touch of this area sparked a 20-30 % rebound.
● A falling wedge within the broader descending channel is close to completion; a 16 h close above the wedge roof (~0.66) activates a measured move to the first horizontal resistance at 0.73 and the channel cap near 0.86.
💡 Fundamental Analysis
● The upcoming Chang hard-fork, which introduces on-chain governance and boosts staking utility, is scheduled for main-net in Q3 2025, lifting on-chain activity and TVL.
✨ Summary
Long 0.58-0.63; wedge breakout >0.66 targets 0.73 ➜ 0.86. Bull bias void on a 16 h close below 0.54.
-------------------
Share your opinion in the comments and support the idea with a like. Thanks for your support

#ADA Almazov Projection#ADAUSD ALMAZOV PROJECTION WEEKLY
Price projection according to Almazov's theory, #ADA should at least touch $1,60 - before pulling back or continuing to go long if its dimensionality decreases (2.3).

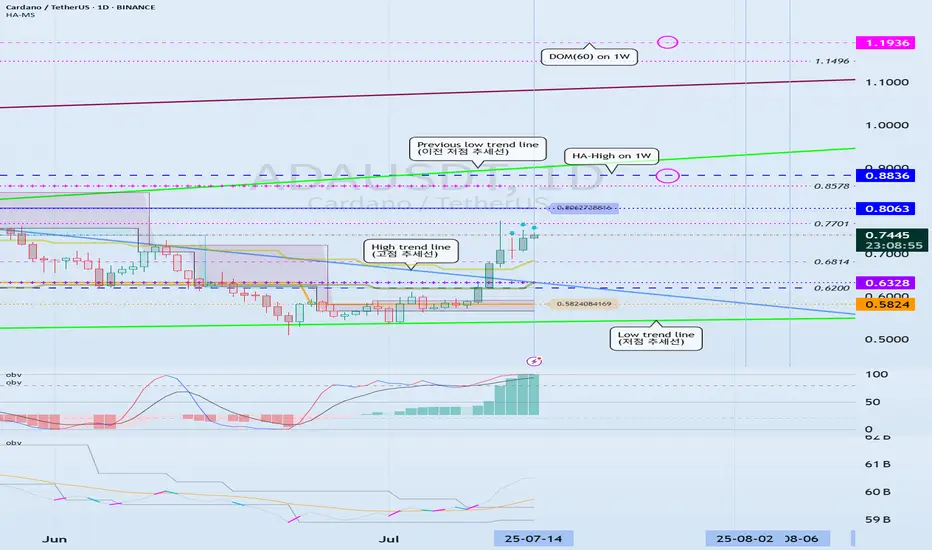
Can we break above the 0.8063-0.8836 range?
Hello, traders.
If you "Follow", you can always get the latest information quickly.
Have a nice day today.
-------------------------------------
(ADAEUSDT 1D chart)
ADA is forming a long-term rising channel and is showing an upward trend as it breaks above the mid-term high downtrend line.
We need to see if it can rise above 0.8836 and maintain the price to rise above the previous mid-term low trend line.
-
The DOM(60) indicator is showing signs of being newly created.
Accordingly, we need to see where the DOM(60) indicator is formed.
Since the HA-High indicator is formed at 0.8063, in order to continue the upward trend, it must rise at least above 0.8063 to maintain the price.
Accordingly, the key is whether the price can be maintained above 0.6328.
-
It is possible to show a mid- to long-term upward trend only if it breaks through the HA-High ~ DOM(60) section of the 1W chart upward.
Therefore, the 0.8836-1.1936 section is likely to be the resistance section.
-
Based on the current price position, the support section is the 0.5824-0.6328 section.
However, since the positions of the HA-Low indicator and the DOM(-60) indicator are switched, if it shows a downward trend, there is a possibility that a new HA-Low indicator will be created.
If a new HA-Low indicator is created, it is important to determine whether there is support near it.
-
Thank you for reading to the end.
I hope you have a successful trade.
--------------------------------------------------
- Here is an explanation of the big picture.
(3-year bull market, 1-year bear market pattern)
I will explain the details again when the bear market starts.
------------------------------------------------------
ADA WCardano is currently back to the flat cloud after breaking the cloud and is continuing its downward trend again until the tarkett is visible in the picture. My good friend, this is my personal opinion. Please make a rational decision.
ADA/USD Thief Trading Plan – Bullish Snatch & Run!🚨 ADA/USD HEIST ALERT! 🚨 – Bullish Loot Grab Before the Escape! (Thief Trading Strategy)
🌟 Greetings, Market Pirates & Profit Raiders! 🌟
🔥 THIEF TRADING STRIKES AGAIN! 🔥
💎 The Setup:
Based on our stealthy technical & fundamental heist tactics, ADA/USD is primed for a bullish loot grab! The plan? Long entry with an escape near key resistance. High-risk? Yes. Overbought? Maybe. But the heist must go on!
🎯 Key Levels:
📈 Entry (Vault Cracked!) → Swipe bullish positions on pullbacks (15m-30m precision).
🛑 Stop Loss (Escape Route) → Recent swing low (4H basis) at 0.5290 (adjust per risk!).
🏴☠️ Target (Profit Snatch!) → 0.6500 (or bail early if bears ambush!).
⚡ Scalpers’ Quick Heist:
Only scalp LONG!
Big wallets? Charge in! Small stacks? Ride the swing!
🔐 Lock profits with Trailing SL!
📢 Breaking News (Heist Intel!):
Fundamentals, COT, On-Chain, Sentiment— All hint at bullish momentum!.
🚨 ALERT! News volatility ahead—Avoid new trades during releases! Secure running positions with Trailing SL!
💥 BOOST THIS HEIST! 💥
👉 Hit LIKE & FOLLOW to fuel our next market robbery! 🚀💰
🎯 Profit taken? Treat yourself—you earned it!
🔜 Next heist incoming… Stay tuned, pirates! 🏴☠️💎

ADAUSDT.P m15 : a Short Position fot TP3The price, on its weekly upward path, reacted bearishly to the daily zone and seems likely to take out key lows to collect liquidity (whether for a future decline or rise).
Our trade will be activated after the liquidity Grab, based on trend and horizontal levels

ADA/USDT Trade Idea – 15m (Following V–Trend Setup)Bias: LONG
🔍 Trade Breakdown:
V-Structure Identified:
Market formed a clear V-reversal structure, shifting from a bearish downtrend into a bullish uptrend. This is a key part of my setup — I look for these V-shaped reversals as confirmation of potential long entries.
Trendline Break + Structure Shift:
The red descending trendline was broken with strong bullish candles. Price also broke above a key structure level, confirming the bullish trend shift.
Risk Management Zone (RM):
Price pulled back into my Risk Management Zone (RM) — a demand zone marked by previous consolidation and imbalance. I do not enter on impulse, instead I wait for price to return to this zone for a safer entry.
NO FOMO Zone:
Highlighted in red — I avoid entering if price doesn't respect this zone. It helps me stay disciplined and avoid emotional trades.
Entry & Target:
Entry: Within RM zone (~0.8780–0.8845)
Stop Loss: Below RM zone (~0.8739)
Target: 0.9266
This gives a solid risk-to-reward setup in alignment with the trend.
✅ Strategy Checklist:
V-shaped recovery ✅
Structure break ✅
Pullback into RM ✅
No FOMO entry ✅
RR > 1:3 ✅
📌 Let the market come to you. Stay disciplined, trust the setup.
#ADAUSDT #CryptoTrading #VTrend #SmartMoney #PriceAction #NoFOMO #15mSetup #TradingView

$ADA/USDT — Potential Long-Term BreakoutCardano is showing a major breakout from a long-standing descending channel on the daily timeframe.
Structure:
Downtrend channel respected for ~7 months
Breakout confirmed with a strong bullish daily candle
Price hovering around $0.7192, above previous resistance
Support Levels:
$0.60
$0.5299
Resistance / Long-Term Targets:
$0.8158
$1.0876
$1.3159
$1.8958
Ultimate target (Fib extension): $2.76+
Outlook:
The 285% potential move mirrors ADA’s past rally from similar conditions. If market sentiment continues improving and BTC holds above key levels, ADA might repeat history.
A pullback to $0.60–$0.66 could offer re-entry opportunities.
Bias: Bullish (long-term)
Caution: Not a trade setup—strictly an outlook. Watch BTC/ETH correlation.
DYOR | Not financial advice

ADA idea 03 07 25Grids can it’s a great way to deal with volatility and timming within a range with clear PD Arrays