$ADA movement This chart shows that ADA is moving in an uptrend. Higher highs (HH) and higher lows (HL) indicate the continuation of this trend.
Stop Loss: If the price drops below 1.0466, the analysis is invalid.
Take Profit: The price may reach 1.3383.
Key Level: Resistance at 1.1604, where the price might pull back before continuing upward.
Overall, as long as the price stays above the ascending trendline, the chances of further growth are high.
ADAUSDT trade ideas

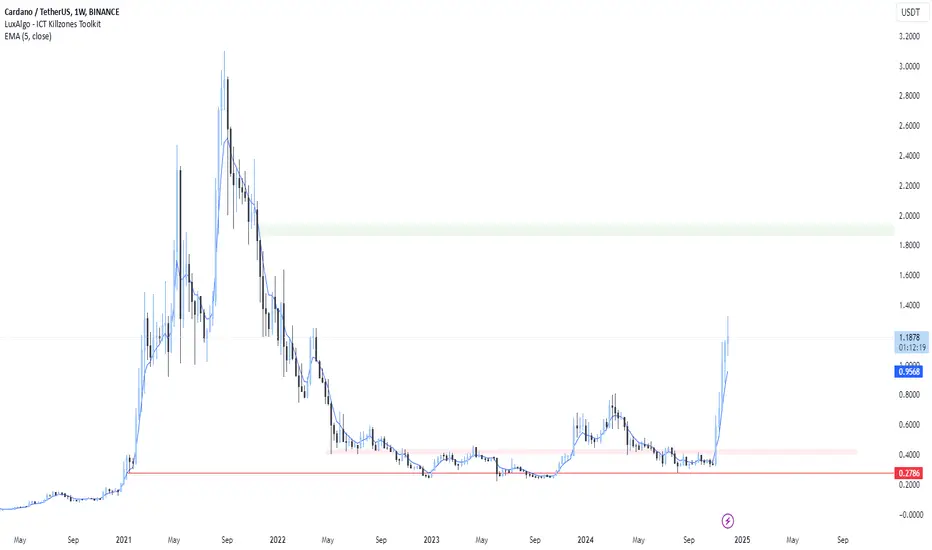
Update on ADAhello everybody.
tonight we have an update on Cardano and the price base on structure looks very bullish and could potentially go higher.
the price broke the recent structure and the green dots indicate our current range I also marked the liquidity above the demand zone and as soon as the price comes to the demand we will look at the price in the lower time frame and look for confirmation and if we saw one we can set an order and target the high of the range and catch a pretty good RR.
for now, we have to analyze the behavior of the price and see if it reaches our demand zone or not and be patient.
I will keep you updated.
tnx for reading <3

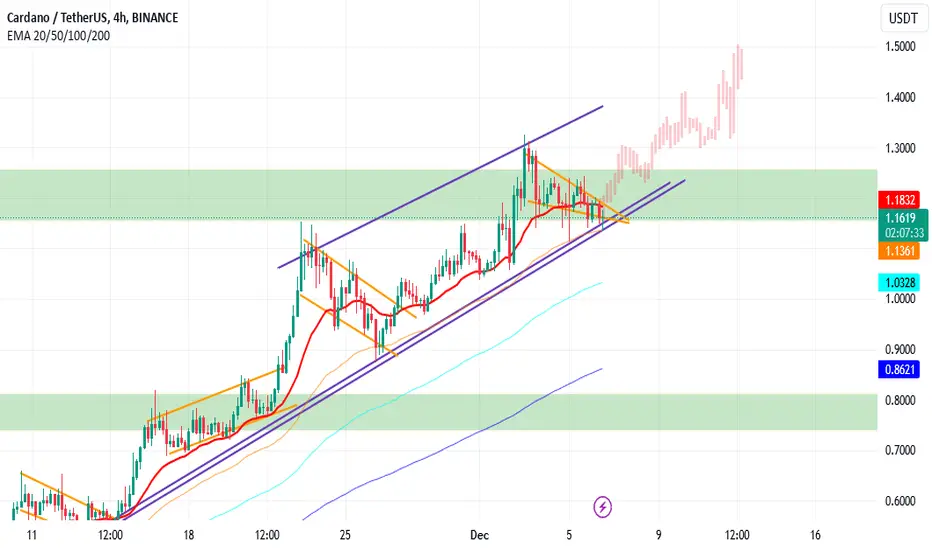
ADA Update and possible trendlines (4h)ADA performed as of now as expected and touched the 161.8 fib extension of the uptrend + touched the trendline and respected it several times.
Given the CCI I don't necessarily see a downtrend shortterm but we might prepare for a possible , short lived, dump to the 161.8 fib extension of the high time frame view, before regaining momentum. I've drawn in two possible scenarios that, in my eyes, could play out - altho I favor the continuous uptrend.
after the touch of 161.8 extension, BINANCE:ADAUSDT consollidated for a bit bellow it until it touched the trendline again. now it's slightly above the trendline and bellow 161.8. to me that indicates the 5th "wave" (not refering to elliot wave here) of the consollidation and breakout movement we saw previously 4 times in a row. so basically, if the momentum still gives, we can see another break upwards and above the 161.8 in the next days.
if it falls bellow, the next poi would be the VAH since the upmove. I've adjusted it to the current volumes so it's at 1.07. I'd see this one hold and form support, IF ADA breaks the trendline. but time will tell.

"Big Melons Pattern" - a double cup with no handle<3 <3 <3 Hold the melons, finesse the melons. You will learn to love the melons <3 <3 <3

ADAthere was a good spike, slowing down and three-corrections, v-formation and break out. A long position from this very point is likely to hit the target at a TP2

Cardano Primed for 2025 ATH: Don’t Miss Out!Cardano (ADA) has been performing well, but its price hasn’t seen a major jump yet. It’s currently trading within its previous range, showing signs of stability. Based on the chart, the $0.9799 level looks like an ideal zone for a swing trade entry. This area offers a good balance of risk and reward for those looking to capitalize on potential upward movement.
Looking ahead, I’m optimistic about Cardano’s long-term growth, especially as we move toward 2025. The ecosystem has strong fundamentals and continued development, which could drive it toward a new all-time high (ATH). For traders and investors, this makes current levels a promising opportunity to position for the future rally.

Ada/Usdt trend analysisHello friends. So now we are toward to resistance but i think around 1.10$ zone bullish setup is considrable
DYOR
levels shown for you
Enjoy :)))

ADASo far steep trend line not broken since election. Let's see if resistance at 1.23 can easily be crossed

Destiny 1H ADAThe negative divergence is very clear; in the previous analyses I sent, I explained that it has broken the daily trend line and is currently at another trend line resistance, which is the current point. My expectation as a technician is a drop in the price of ADA to the $0.5 range.


ADA Bullish PatternBy this bullish triangle pattern In case of breaking out we could easily reach 1.5$
Cardano With a Bright Bullrun!Hey Trader!
Cardano is trading within a descending channel, presenting a clear structure of lower highs and lower lows. While this pattern often leans bearish, there are signs of buyer activity, as evidenced by the repeated bounces off the lower trendline. This suggests that the market is at a pivotal moment, with the potential for a significant move in either direction.
The key resistance to watch is at $1.3269 . If ADA manages to break above this level and exit the descending channel with strong volume, it could signal the start of a bullish rally, potentially driving the price toward levels above $1.40 . Conversely, if the price fails to hold the current support at $1.0576 , a deeper drop toward $1.0378 could materialize, shifting the momentum decisively in favor of the bears.
The RSI indicator remains neutral, suggesting that the market is in a consolidation phase and building momentum for a breakout. Volume will be crucial in confirming the direction of the next move. With buyers stepping in to defend support and sellers maintaining pressure at resistance, this setup is nearing a critical decision point.
Stay alert for how ADA reacts around these levels—it could define the next major trend. What’s your take on ADA? Will it break upward or continue downward? Let me know in the comments!

Ada/Usdt Analysis In 1 Hour Time Frame Date 6/12/2024Ada/Usdt Analysis In 1 Hour Time Frame Date 6/12/2024
Sell Zone : 1.1510
Stop Loss : 1.2058
Take Profit : 0.9473
I think it's stronge sell because there are so many liquidity and also chart shows that a trend breakout and also Resistance Breakout, So for me it's stronge Sell

Cardano (ADA) Buy SetupAlexGoldHunter BINANCE:ADAUSDT Technical Analysis and Buy Strategy for Cardano (ADA/USDT)
Chart Analysis
Current Price: $1.1866
Key Zones:
Order Block: $1.25
Swing High: $1.1958
Swing Low: $1.15
Strong Low: $1.03
Volume Profile:
Significant trading volume around $1.18 to $1.20, indicating strong interest and potential support/resistance.
Technical Indicators:
RSI (Relative Strength Index): Currently around 47.99, indicating neutral momentum.
MACD (Moving Average Convergence Divergence): Shows a bearish crossover, suggesting potential downward momentum.
Buy Strategy with Confirmations
Identify Key Support Levels:
Look for buying opportunities around the $1.15 support level, as it has been tested multiple times and held.
Volume Confirmation:
Ensure there is significant buying volume when the price approaches the $1.15 support level. This can be confirmed by a spike in the volume bars.
RSI Confirmation:
Look for the RSI to be in the oversold region (below 30) and then start to move upwards, indicating a potential reversal.
MACD Confirmation:
Wait for a bullish crossover in the MACD (the MACD line crossing above the signal line) to confirm upward momentum.
Break of Structure (BoS):
Look for a BoS above the $1.1958 resistance level to confirm a bullish trend. This would indicate that the price has broken above a key resistance level and is likely to continue upwards.
Entry Point:
Enter a buy position when the price is around the $1.15 support level with the above confirmations in place.
Stop Loss:
Place a stop loss slightly below the $1.15 support level to minimize potential losses in case the support does not hold.
Take Profit:
Set a take profit target around the $1.25 resistance level (Order Block), as this is a significant resistance area where the price might face selling pressure.
By following this strategy and waiting for the confirmations, you can increase the probability of a successful trade.
If you need further assistance or have any other requests, just let me know! 😊


ADA_ Enough Gas to continue its uptrend ?If we close above the redline with confirmation, it'll resume its uptrend.
TP targets are on the chart.
NFA.

Cardano bullish triangle - Alt season is hereHey Traders!
Cardano (ADA/USDT) is showing an exciting setup as it forms a symmetrical triangle, signaling that the market is consolidating and preparing for a potential breakout. Based on the current price action, there is a clear bullish bias, but we can’t ignore the possibility of a bearish breakdown.
The price has been respecting the rising support line, currently holding at $1.0489, while resistance stands firm at $1.3269. If the price breaks above this resistance level with strong volume, it could trigger a bullish rally toward the Fibonacci target at $1.7080, offering a promising opportunity for buyers.
However, there’s always risk in these setups. If the price loses momentum and breaks below $1.0489, the bullish scenario would be invalidated, and ADA might drop toward the lower support at $0.9408, marking a bearish turn.
This pattern is a classic decision point. A breakout above resistance signals strength, while a breakdown below support could lead to a deeper retracement. Watch the volume closely for confirmation as we approach the apex of the triangle.
What do you think, traders? Will ADA break out to the upside or slide lower? Let me know your thoughts in the comments below!

CARDANO (ADAUSDT): Confirmed Bullish SignalI see a clear sign of a bullish trend continuation on 📈Cardano, following a pullback to a key horizontal support level that was recently broken.
The price has rise and violated the resistance line of a descending wedge pattern.
This suggests that we may see a continued upward movement towards a new high.

WajaniTV AnalysisMarket making LH and HH as seen through 1-4. Market currently at a support (resting) at 4. The market might range here for a few days before continuing it bullish.
Trading is risky so this is not a financial advice but educational material.
Let me know your thoughts.
Thank you.

Destiny ADA DailyThe daily trend line has been broken, and until the trend line drawn from the minor highs is reached, I currently expect a very sharp correction to the $0.55 area, which will be exactly 55%.

ADAUSDT is in Bullish TrendADAUSDT is showing HH&HL currently it is in a rectangle channel and the break out can give an Buy move it looks like a short time trade

ADA/USDT: READY FOR A 50% RALLY FROM HERE!!Hey everyone! 👋
If this analysis resonates with you, don’t forget to hit that 👍 and follow for more high-value setups! 💹
🔍 Technical Overview:
ADA is showing strong bullish momentum! It is forming an ascending triangle pattern in 4hr time frame and currently, retesting it. Long some here and add more in the dip.
Entry range: CMP and add more up to $1.16
Targets: $1.28/$1.42/$1.56/$1.70
SL: $1.0950
Lev: Use low leverage (Max 5x)
Why This Matters:
The setup points to a decisive bullish breakout for ADA! With the confirmed retest and strong support levels, it’s looking like an excellent opportunity for traders.
💬 What’s your take on ADA’s price action? Are you seeing the same breakout potential? Drop your thoughts and analysis in the comments below, and let’s ride this wave together! 🚀
