#ADA/USDT#ADA
The price is moving within a descending channel on the 1-hour frame and is expected to break and continue upward.
We have a trend to stabilize above the 100 moving average once again.
We have a downtrend on the RSI indicator that supports the upward move with a breakout.
We have a support area at the lower limit of the channel at 0.6300, acting as strong support from which the price can rebound.
Entry price: 0.6360
First target: 0.6460
Second target: 0.6580
Third target: 0.6700
ADAUSDT trade ideas

HolderStat┆ADAUSD BULLISH BOUNCEBYBIT:ADAUSDT is squeezing out of its falling-channel floor, carving a clean higher-low right above 0.66. That move flips a month-long consolidation into a fresh trend-restart signal. A steady bid on top of the diagonal keeps the bias pointing north-east; reclaiming 0.71 unlocks the 0.77 target where the upper megaphone meets prior supply. Break that and the “new-highs” narrative returns to center stage.

Cardano and Diametric Pattern
We are currently in wave-g of the Diamond Diametric and it could continue to 0.43.
After the completion of the Diametric, if the Double Combination pattern does not form, we expect an uptrend to form. (The post-pattern movement will show us whether the Diametric has completed or not).
Good luck
NEoWave Chart

ADAUSDT Is Warming Up for a Major MoveYello, Paradisers! Did you notice what just happened on ADAUSDT? After sweeping liquidity, the pair has now printed a bullish internal change of character (I-CHoCH), confirmed by bullish divergence. This confluence significantly increases the probability of a bullish move from here—but only if you play it smart.
💎From the current price levels, the risk-to-reward ratio isn’t the most attractive for conservative entries. Aggressive traders might still consider taking a position with a tighter invalidation, but the trade needs to be managed with precision.
💎For those who prefer safer setups, it’s much wiser to wait for a pullback into the key support zone. A confirmed retest from there could offer a much cleaner risk-to-reward structure and a clearly defined invalidation level.
💎However, if the price breaks down and closes below that invalidation level, this entire bullish setup becomes invalid. In that case, it's best to stay patient and wait for a new structure to form before jumping back in. Entering too early in uncertain territory can turn a high-probability setup into a costly mistake.
🎖Strive for consistency, not quick profits. Treat the market as a professional, not a gambler. Discipline and timing are what separate the winners from the crowd. Be patient, wait for the high-quality trades, and execute with confidence. That’s how long-term success is built in this game.
MyCryptoParadise
iFeel the success🌴

ADA's situation+ Target PredictionThe price on the daily timeframe is within a triangle, which can create some uncertainty about which direction it will move. Here, we should wait to see which side of the triangle the price breaks out from. Remember, the trend is our friend.
Best regards CobraVanguard.💚

Wyckoff Up-Thrust - This is how to identify using Speed indexClassic Wyckoff Up-Thrust formation, this is how to read it using Speed Index (annotations in sync with the chart):
1. Fib Area - this is where sellers might come in
2. FU - Fast Up wave with SI 0.4F
3. Next up wave with an abnormal SI of 1.0S while the average speed at 0.5, which means price has a hard time to move up (more sellers on the up move). Following the up wave on the down move we have double Short signals WU-Wyckoff Up-Thrust and PRS-Plutus Reversal Short and this where we enter.
I hope this was helpful. Enjoy!

ADA/USDT UPDATE 🚨 Cardano Slips as Hoskinson Proposes $100M Treasury Shift to Stablecoins
Cardano creator Charles Hoskinson recommended turning $100 million ADA into stablecoins and Bitcoin.
The capital reallocation method boosts Cardano's DeFi ecosystem.
ADA dropped almost 4% in 24 hours and is currently targeting $0.60 following a rejection at the upper border of a declining channel.
Cardano (ADA) fell 4% on Friday after creator Charles Hoskinson recommended converting $100 million of ADA into stablecoins and Bitcoin (BTC) to improve its ecosystem's stablecoin supply.
Cardano treasury allocation plan decreases ADA 4%.
Cardano co-founder Charles Hoskinson suggests turning $100 million in ADA tokens into Bitcoin and stablecoins. Hoskinson explained Cardano's low DeFi stablecoin supply on YouTube on Friday.
"Cardano issues less stablecoins than DeFi. In the YouTube video, Hoskinson indicated it was little under 10%.
DefiLlama data shows $31 million in stablecoins on Cardano and $273 million in TVL. Hoskinson said that the Cardano Foundation's treasury has no yield-bearing securities.
However, opponents warned that the token sale might lower ADA's price further because to mounting pessimistic attitude. Hoskinson answered concerns, saying $100 million would not hurt the network.
Cardano's stablecoin issuance ratio is 10%, however the fund conversion would increase it to 33% or 40%. Bitcoin might get $25 million to $50 million to boost DeFi activity and entice yield-seekers.
"We're going to look at it and then we're going to syndicate that with a lot of the DeFi applications in the Cardano ecosystem and have a discussion about its practical readiness," he said.
ADA is down 4% because to growing Israel-Iran conflict concerns.
At $0.60, ADA may find support. If $0.60 fails, it might bounce off the channel's bottom barrier under greater downward pressure. On the upside, it must break the channel's upper barrier to reach $0.84.
#CardanoDebate #IsraelIranConflict #TrumpTariffs #BTC110KSoon? #BinanceHODLerRESOLV CRYPTOCAP:ADA CRYPTOCAP:BTC CRYPTOCAP:ETH

Cardano Weekly, UpdateCardano weekly doesn't look as good as XRP and Ethereum, this is true because I am using the same indicators.
Here we can see ADAUSDT trading below EMA34 and MA200. We can even see an attempt this week to move higher followed by a rejection, this means that there can be some more bearish action before higher prices but this bearish action can easily happen short-term. Why? Because Cardano has already been dropping for five weeks straight.
The rise from the 7-April low lasted a total of six weeks. The week that produced the peak is also the first week of lower prices. So we can say 6 weeks up and four weeks down, or, five weeks up and five weeks down.
The thing is that the market seeks balance and this retrace is already big enough and has been going long enough. Yes, the action is happening below these moving averages but this can easily change.
Short-term bearish.
» ADAUSDT will continue bearish as long as it trades weekly below the $0.7050 - $0.6875 price range. When ADAUSDT moves and closes above this range, the bullish bias is confirmed. Any trading below and we wait.
Thank you for reading.
Your support is appreciated.
Namaste.

HolderStat┆ADAUSD above the $0.66 levelCRYPTOCAP:ADA
→ Climbs out of falling channel, presses 0.68 trend-lid
↳ Accept > 0.68 targets 0.72–0.75 → 0.80–0.85
⇢ Must defend 0.60–0.63 breakout shelf
⤴ Fall < 0.60 hands reins to bears aiming 0.58–0.55

ADA HVF 39 RR 250% LOG $2.4 by EOYADA on an upside HVF. 250% move measured in log scale to just under $2.4 with a likely run of target. Tight stop loss under the third (assumed complete) impulse allowing for re-entry upon failure and pattern continuation, also offering a 39 Risk Reward Ratio.

Cardano, What To Expect!The action is turning bearish after a very weak bounce from "higher low" on the chart. There is a sequence of local lower highs on ADAUSDT daily. What to expect?
Expect a test of the "higher low" zone as support and this zone breaking. The next level that will come into question is the "main support" but this one isn't likely to be tested.
Picture the action going lower towards support and ending right in between 'higher low' and 'main support'. This is the main scenario.
This scenario will keep the broader bullish structure intact and at the same time would end as a major market flush. As many weak hands as possible are removed and yet the bulls will remain in control.
Make no mistake, whatever happens in the short-term, Cardano will continue to grow. This is only a temporary event. Patience is key.
Thanks a lot for your continued support.
Namaste.

ADA | Liquidity Drain or UPSIDE POTENTIAL??ADA is lacking behind in terms of altcoins this season. We've not yet seen the new highs or parabolic increases that is due for a new BTC ATH.
We're seeing higher highs, and higher lows in the macro which is a bullish sign - indicating the trend is still BULLISH
From the macro, we do see a better picture.. at least THIs time around, the accumulation cycle isn't in such a tight range, and you could day trade / swing trade:
_______________
BINANCE:ADAUSDT

Be careful with ADA !!!Finally, the price broke the wedge, and the price experienced a significant drop. I think is the time for btc to rise again to 0.73 after more correction . STRONG SUPPORT 0.67
Give me some energy !!
✨We spend hours finding potential opportunities and writing useful ideas, we would be happy if you support us.
Best regards CobraVanguard.💚
_ _ _ _ __ _ _ _ _ _ _ _ _ _ _ _ _ _ _ _ _ _ _ _ _ _ _ _ _ _ _ _
✅Thank you, and for more ideas, hit ❤️Like❤️ and 🌟Follow🌟!
⚠️Things can change...
The markets are always changing and even with all these signals, the market changes tend to be strong and fast!!

Weekly trading plan for ADA Locally on the 1h timeframe we can see a bearish divergence and if the price fails to break the monthly pivot point, we are more likely to see a correction to the weekly PP. After that we can think about new longs, but also and now of course there is a chance to see a fast push to the target 3
Write a comment with your coins & hit the like button and I will make an analysis for you
The author's opinion may differ from yours,
Consider your risks.
Wish you successful trades ! mura

HolderStat┆ADAUSD above the $0.7 levelCRYPTOCAP:ADA is aiming to test 0.7 level with possible reaching 0.6764. The descending structure has been broken, we expect the formation of an ascending bottom to confirm the new structure.

ADA road map (4h)What I currently expect is that the price could correct slightly, as shown on the chart, and then pump by about 13% from the PRZ (Price Reversal Zone). This signal is strengthened by the presence of strong positive divergence. In summary, the PRZ is a good entry point, derived from the confluence of touchlines and pivots. However, if the price ignores this zone and drops below it, my analysis will be invalidated.
Best regards CobraVanguard.💚

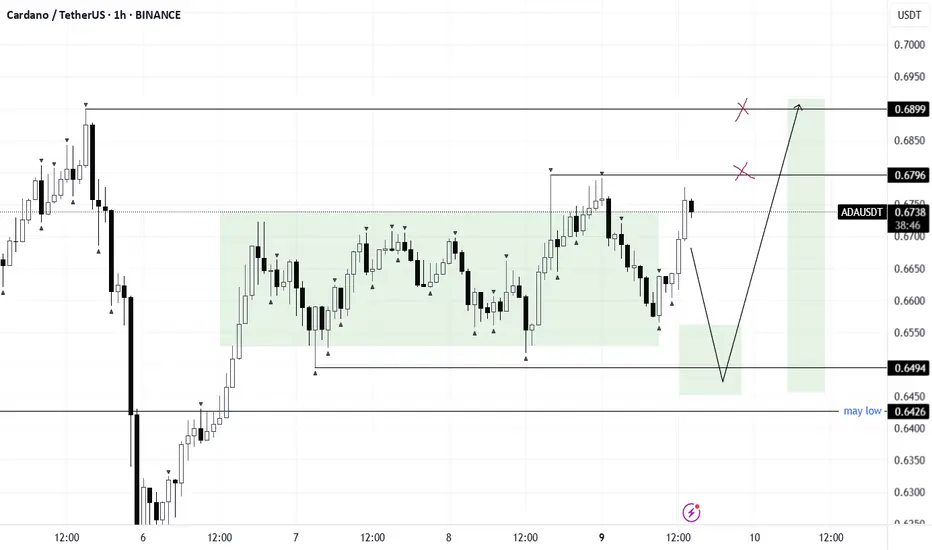
Ada upate ! (Analyst Crypto Tantrik)BINANCE:ADAUSDT Update: Navigating the Zones! 📈📉
Price is consolidating, currently caught between our critical zones. Here's what we're watching closely:
🔴 Red Zone ($0.675 - $0.68): Our Bearish Barrier!
Price facing resistance here.
BIG Signal: A confirmed break above this zone would indicate powerful bullish momentum and potential for significant upward movement!
🔵 Blue Zone ($0.65 - $0.655): Our Bullish Base!
This zone is currently acting as strong support, providing buying opportunities.
Watch Out: A break below this zone would signal a weakening trend and potential for bearish pressure.
🚀 Key Takeaway: These zones are vital support/resistance. We're patiently WAITING FOR A PROPER BREAKOUT from the current pattern to confirm the next big move. Stay alert and trade smart!

HolderStat┆ADAUSD defends 0.60 floorCRYPTOCAP:ADA revisits the 0.600 cradle inside a broad falling channel. Cardano price still respects its macro trendline; vaulting 0.68 would hint at a shift toward 0.75-0.80, yet a breakdown exposes next support at 0.55.

ADA/USDT – Decision Zone & Probabilities (Zarvān Tools)🔰 ADA/USDT – Strategic Analysis (Spring 2025)
Powered by Zarvān | Dynamic Field S/R Engine
ADA/USDT is now trading inside a crucial decision zone, highlighted by the golden background on the chart. This area marks a period of market indecision—typically a precursor to a strong breakout move in either direction.
Key Technical Levels:
Dynamic Support: 0.6580 – If this level fails, watch for the next support at 0.6430, and, in extension, 0.6225.
Dynamic Resistance: 0.6991 – This is the key short-term resistance. A confirmed breakout here opens the path towards 0.7540 and potentially 0.7851.
Major Resistance: 0.7997
Potential Scenarios:
Bullish Outlook:
Should ADA/USDT decisively break and hold above 0.6991, a rapid move towards 0.7540—and possibly higher to 0.7851—is on the table. (Green projection on chart)
Bearish Outlook:
Conversely, losing the 0.6580 support level could trigger a drop to 0.6430, then 0.6225. (Red projection)
What Makes This Analysis Unique?
This forecast is built upon a suite of proprietary Zarvān indicators, not available to the general public. These include:
Zarvān | Dynamic Support & Resistance (Divergence-Based)
A smart, adaptive S/R system built on divergence, structural bias, and market energy—not simple pivots or Fibonacci retracements.
Zarvān | Composite Field Engine
Measures “hidden field energy,” imbalance, and latent reversal potential using a layered logic unique to the Zarvān methodology.
Zarvān | Adaptive Reversal SmartView
Detects nuanced phase transitions, emerging reversals, and the “pulse” of the trend—well before classic indicators react.
MACD-Zarvān (Normalized)
An advanced, context-aware MACD, normalized and dynamically weighted by field conditions for vastly improved divergence detection.
Why Trust These Tools?
Noise Resistant: Zarvān indicators filter out “fake” moves and sideways traps, reacting only to truly significant field events.
Energy-Focused: Rather than just price or volume, they assess the interplay of forces behind every market move.
Signal Selectivity: Alerts are only generated when the underlying field energy and trend conditions truly align.
Practical Takeaway:
While price remains inside the highlighted decision zone, patience is advised. A confirmed breakout in either direction, validated by Zarvān indicators, can offer high-quality trading opportunities.
Set alerts at the levels above and wait for a clean setup.
Probability Outlook:
Given the current market structure and the price’s position within the decision zone, the probability of an upward move is slightly higher at this point. Both bullish and bearish scenarios remain valid, but recent price action—together with subtle positive divergence signals detected by proprietary Zarvān indicators—shifts the balance modestly in favor of the bulls.
At present, I estimate the odds at roughly 55% bullish versus 45% bearish.
This analysis is powered by Zarvān Field Intelligence. Our indicators are proprietary and developed exclusively for advanced phase-field market research. Please do not redistribute or copy our logic without permission.

ADA/USDTADA is currently in a local consolidation phase.
After a liquidity grab/manipulation sweep, we can start watching for long opportunities.
🎯 Upside target: $0.68 – $0.69
📊 Waiting for confirmation post-manipulation to trigger entries. Patience is key — setup is forming.
TradeCityPro | ADA: Holding Key Support Inside Descending Channe 👋 Welcome to TradeCity Pro!
In this analysis, I want to review the ADA coin for you, one of the most popular cryptocurrencies, currently ranked 10th on CoinMarketCap with a market cap of 23 billion dollars.
📅 Daily Timeframe
As you can see in the daily timeframe, the price is fluctuating between two key support and resistance zones. Additionally, there's a descending channel in play, and the price has recently been rejected from the top of this channel and moved down to the support zone.
✨ The 0.61 zone is a very strong area, and the price has reacted to it multiple times. It was broken once, but as the price reached the bottom of the channel, it was supported again and moved back above the level — indicating a possible fakeout.
✔️ If this zone is broken again, the likelihood of another drop toward the 0.5579 level or the bottom of the box increases. So I think it’s worth considering a short position on lower timeframes if this zone breaks.
💥 RSI entering the oversold area would be a strong momentum confirmation trigger for this trade.
📊 Currently, ADA's volume is quite low, and with this low volume, it’s not suitable for either long or short positions. I suggest waiting until significant volume enters ADA before taking a position.
🛒 For spot buying or long-term long positions, the first trigger is the price's reaction to this support zone. If a confirmation candle forms here, we can consider entering. However, in my view, this trigger is risky, and I personally prefer to wait for more reliable confirmations.
📈 A more reliable trigger would be a breakout of the descending channel. If either the channel itself or the 0.8414 trigger is broken, we can enter a position. And if you want the strongest confirmation and wish to enter with the main trend, you should wait for the 1.1325 level to be broken.
❌ Disclaimer ❌
Trading futures is highly risky and dangerous. If you're not an expert, these triggers may not be suitable for you. You should first learn risk and capital management. You can also use the educational content from this channel.
Finally, these triggers reflect my personal opinions on price action, and the market may move completely against this analysis. So, do your own research before opening any position.

Cardano Bull Market, Bear Market & Price Action Dynamics Expl...The question right now relates to the short-term because we all know what is happening long-term.
There is a sequence of higher lows starting June 2023. The next one comes August 2024 followed by a strong bullish breakout. So the market is bullish.
The bullish wave enters a correction with a major low in February retested in April. Now we are looking at a short-term retrace and local higher low (2025).
The 7-April low leads to a bullish breakout and this breakout gets corrected, four weeks red. This is the fourth red week and the end of the retrace. From this point on, we will see growth.
The left side of the chart is always the past. The right side the present.
The bear market wave is hard to miss (left-red), it was straight down. The bull market period is different, it has been going in sequence. Strong jump followed by a strong correction. What we are about to experience is something different.
Instead of the action we saw in 2022, 2023 and 2024, we will see something more like the bear market but inverted, straight up. Something like 2021, bull market action. We miss it and we cannot remember the truth of it because it happened so long ago.
Let's summarize: Cardano is going up.
Namaste.

adausdt.1hCardano analysis based on trend analysis, support and resistance, and price action, analysis on the hourly time frame
