#ADAUSDT is forming a strong bullish trend📈 LONG BYBIT:ADAUSDT.P from $0.8110
🛡 Stop Loss: $0.8046
⏱ 1h Timeframe
🔹 Overview:
➡️ Price is showing a strong uptrend after a correction, forming a support zone and bouncing off the local trendline.
➡️ POC (Point of Control) at $0.7826 highlights the key volume area where the reversal occurred.
➡️ Key resistance levels are marked, indicating potential price targets.
➡️ Volume spikes confirm increased buyer interest, signaling momentum.
➡️ An impulse breakout is possible if buying pressure sustains at TP levels.
⚡ Plan:
➡️ Main scenario – long position with profit-taking at TP levels.
➡️ Expecting a breakout above $0.8110 and resistance level tests.
🎯 TP Targets:
💎 TP 1: $0.8160
🔥 TP 2: $0.8210
🚀 TP 3: $0.8262
📢 BYBIT:ADAUSDT.P is forming a strong bullish trend — preparing for resistance breakouts!
ADAUST trade ideas

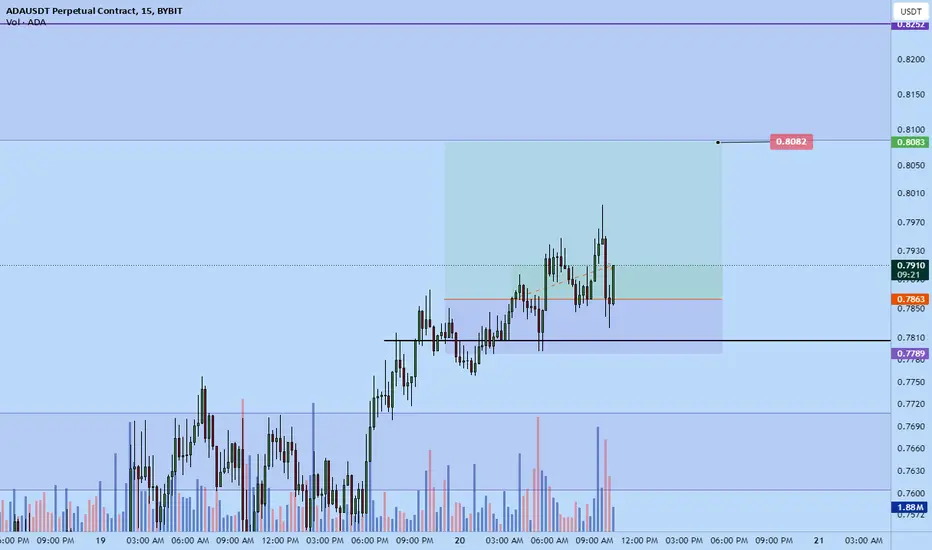
Ada long to $0.8082I got stopped on solana long.. Just went long on #ada instead of going back in sol.
See targets on chart.
$0.8082
I had both setups to choose from this session and I went with solana over sol cause it had more volume but ada structure was much clearer
ADAADA is building a bottoming structure here.
We have a higher low and wait to confirm with a higher high.
A lot of resistance at $0.81-$0.85.
A daily close above $0.85 opens the road for much higher, first stop at $0.91-$0.95.

ADAUSDT PO3 SETUPADAUSDT is now forming po3 setup and is in accumulation phase, I am expecting manipulation because SSL and internal liquidity as FVG. After this manipulation we see distribution phase in upside.

ADA's bearish movementBINANCE:ADAUSDT
ADA was in a bearish pattern (double top) and now the price has already broken the pattern!
which means the price will decrease and reach the next support which I've shown you on the chart!
⚠️ Disclaimer:
This is not financial advice. Always manage your risks and trade responsibly.
👉 Follow me for daily updates,
💬 Comment and like to share your thoughts,
📌 And check the link in my bio for even more resources!
Let’s navigate the markets together—join the journey today! 💹✨

Univers Of Signals | ADAUSDT Is the Downtrend Continuing?👋 Welcome to Univers Of Signals Channel!
Let's take a look at one of the most popular cryptocurrency coins, review our previous analysis on this coin, and find our triggers!
🌐 Overview Bitcoin
Before starting the analysis, I want to remind you again that we moved the Bitcoin analysis section from the analysis section to a separate analysis at your request, so that we can discuss the status of Bitcoin in more detail every day and analyze its charts and dominances together.
This is the general analysis of Bitcoin dominance, which we promised you in the analysis to analyze separately and analyze it for you in longer time frames.
📊 Weekly Timeframe
On the weekly time frame, ADA, like sol, sui, xrp and most of the top ten coins in the market, is still in a better situation and the price is fluctuating at higher levels
After being rejected at 1.1983 and losing support at 0.7959, we experienced a sharp drop to 0.50, and this was the result of Trump and the US tariffs on other countries and caused panic in the market!
The buy trigger is still above 1.1983, but because it is in a better situation, I will give you a trigger for this coin in lower time frames, but I had said that selling below 0.7959 was a temporary sale and I do not have a trigger to exit at the moment!
📈 Daily Timeframe
But interesting things are happening on the daily time frame and we are still clearly at higher levels than other altcoins and if we have a trend change in the market itself, we can be careful for a long trigger sooner
After breaking 0.8204 and losing the 0.236 Fibonacci level, we experienced a Sharpe decline that also became high and I myself expected that after this volume we would go from volatility to forming a range box and this is also happening and we are forming a box of 0.6777 to 0.8204, but if today's daily candle closes like this, we will continue the downtrend!
The spot purchase trigger if we are in this space more in this box that I have specified for you will be after the break of 0.8204 or the formation of a higher ceiling and floor in this box, but your next exit trigger if you do not exit at 0.8204, if it breaks at 0.6777, it is recommended to exit or at least save profit!
⏱ 4-Hour Timeframe
In the four-hour time frame, the conditions of this coin are such that you can open both short and long positions, and it is one of the coins that you should have on your watchlist for this period and watch!
📈 Long Position Trigger
it is quite clear and after the break of 0.8204, I will open a futures position myself and it will probably be so that I continue to hold it and open it long-term
📉 Short Position Trigger
today's trigger was activated earlier and 0.7681, I opened a low-risk short position myself, but the main trigger after the break will be 0.6806 and try to have a short position before that break
📝 Final Thoughts
Stay calm, trade wisely, and let's capture the market's best opportunities!
This analysis reflects our opinions and is not financial advice.
Share your thoughts in the comments, and don’t forget to share this analysis with your friends! ❤️

TradeCityPro | ADAUSDT Is the Downtrend Continuing?👋 Welcome to TradeCityPro Channel!
Let's take a look at one of the most popular cryptocurrency coins, review our previous analysis on this coin, and find our triggers!
🌐 Overview Bitcoin
Before starting the analysis, I want to remind you again that we moved the Bitcoin analysis section from the analysis section to a separate analysis at your request, so that we can discuss the status of Bitcoin in more detail every day and analyze its charts and dominances together.
This is the general analysis of Bitcoin dominance, which we promised you in the analysis to analyze separately and analyze it for you in longer time frames.
🕵️♂️ Previous Analysis
In the previous analysis, we had already identified our analytical levels and said that after the break of 0.8360, we would have the possibility of a sharp decline, and that is what happened, and after the decline, we are currently in a pullback to this level!
📊 Weekly Timeframe
On the weekly time frame, ADA, like sol, sui, xrp and most of the top ten coins in the market, is still in a better situation and the price is fluctuating at higher levels
After being rejected at 1.1983 and losing support at 0.7959, we experienced a sharp drop to 0.50, and this was the result of Trump and the US tariffs on other countries and caused panic in the market!
The buy trigger is still above 1.1983, but because it is in a better situation, I will give you a trigger for this coin in lower time frames, but I had said that selling below 0.7959 was a temporary sale and I do not have a trigger to exit at the moment!
📈 Daily Timeframe
But interesting things are happening on the daily time frame and we are still clearly at higher levels than other altcoins and if we have a trend change in the market itself, we can be careful for a long trigger sooner
After breaking 0.8204 and losing the 0.236 Fibonacci level, we experienced a Sharpe decline that also became high and I myself expected that after this volume we would go from volatility to forming a range box and this is also happening and we are forming a box of 0.6777 to 0.8204, but if today's daily candle closes like this, we will continue the downtrend!
The spot purchase trigger if we are in this space more in this box that I have specified for you will be after the break of 0.8204 or the formation of a higher ceiling and floor in this box, but your next exit trigger if you do not exit at 0.8204, if it breaks at 0.6777, it is recommended to exit or at least save profit!
⏱ 4-Hour Timeframe
In the four-hour time frame, the conditions of this coin are such that you can open both short and long positions, and it is one of the coins that you should have on your watchlist for this period and watch!
📈 Long Position Trigger
it is quite clear and after the break of 0.8204, I will open a futures position myself and it will probably be so that I continue to hold it and open it long-term
📉 Short Position Trigger
today's trigger was activated earlier and 0.7681, I opened a low-risk short position myself, but the main trigger after the break will be 0.6806 and try to have a short position before that break
📝 Final Thoughts
Stay calm, trade wisely, and let's capture the market's best opportunities!
This analysis reflects our opinions and is not financial advice.
Share your thoughts in the comments, and don’t forget to share this analysis with your friends! ❤️

ADA: AB=CD Pattern - 1hr Time FrameAnalysis Overview:
#ADA has recently shifted from a Bullish trend to an downtrend, forming Lower Lows (LLs) and Lower Highs (LHs) on the Small timeframe. Currently, #ADA is developing an AB=CD pattern, signaling a potential continuation of the bullish momentum.
Key Observations:
✅ Uptrend Confirmation: Price action is forming consistent HHs and HLs.
✅ AB=CD Pattern: Price is aligning with the classic harmonic formation.
✅ No Bearish Reversal Signs: No significant bearish divergence or trendline break.
✅ Entry Strategy: Waiting for HLs to form and price to complete the AB=CD structure.
Trade Plan:
🔹 Entry: At the completion of the HL and AB=CD pattern.
🔹 Stop-Loss: Below the previous HL to minimize risk.
🔹 Take-Profit: Near key resistance levels or Fibonacci extensions.
🔹 Risk Management: 1:2 or higher risk-to-reward ratio.
Conclusion:
If the AB=CD pattern completes successfully, we can expect #ADA to continue its bullish move. However, waiting for confirmation and applying proper risk management is crucial to avoid potential reversals.
📊 Let me know your thoughts in the comments! Do you see any additional confluence?

ADAUSDT - Looks like ADA is forming a beautiful bullish div.Hello to all of you.
This is my first chart post ever. So go easy on me ;-)
I don't want anything from you. I have nothing to sell. I just love ADA.
To me this charts indicates that ADA is forming a bullish divergence. If this is true we could be in for a nice ride. Personally I do as I have always done: I hodl my ADA and prepare to sell a bit every time price evolves positively. That gives me the opportunity to buy the many dips that occurs in every cycle. Remember: No one knows if markeds goes up or down. Nothing can be predicted. But sometimes patterns occur that "normally" leds to a positive outcome. Maybe this setup is one of them.
Thanks to you if you made it this far.
Best regards from public-service.

$ADA Correction Finished? #ADA
I think we're at the conclusion of the correction.
I can read an impulse up that has one more leg down, or it's working on a lesser degree wave up.
My bias is towards a corrective wave down with more sideways. If it wants to pump out it has to do it now and not revisit $0.76
The next target area for ME on CRYPTOCAP:ADA is the $1.20 region. Once we make it to that level its a start of a new trend.
Good Luck.

ADA Long Position OpportunityMarket Context:
ADA is showing strong buyer activity around $0.50 and holding above the 200-Day EMA. A reclaim of $0.84 could signal a medium-term structural shift, offering a solid entry for upside potential.
Trade Details:
Entry Zone: Around $0.84 on a confirmed reclaim
Take Profit Targets:
$0.98
$1.15
Stop Loss: Below $0.75
This setup provides a favorable risk-to-reward ratio, with potential for upside if the reclaim holds. 📈

#ADAUSDT remains strong—expecting further upside!📈 LONG BYBIT:ADAUSDT.P from $0.8106
🛡 Stop Loss: $0.8066
⏱ 15M Timeframe
✅ Overview:
➡️ BYBIT:ADAUSDT.P is trading in an accumulation zone, breaking the local resistance at $0.8106, which could act as a long entry point.
➡️ POC (Point of Control) at $0.7971 confirms strong buyer interest below the current levels.
➡️ The price maintains an upward structure, and a breakout above $0.8106 could lead to further upside.
➡️ Rising volumes confirm bullish activity and potential growth.
⚡ Plan:
➡️ Enter long above $0.8106, confirming the breakout.
➡️ Risk management via Stop-Loss at $0.8066 to protect against false breakouts.
🎯 TP Targets:
💎 TP1: $0.8138
🔥 TP2: $0.8195
⚡ TP3: $0.8266
🚀 BYBIT:ADAUSDT.P remains strong—expecting further upside!
📢 BYBIT:ADAUSDT.P is showing a solid bullish impulse. A breakout above $0.8106 could lead to a test of $0.8138 – $0.8266.
📢 However, if the price drops below $0.8066, it may signal a return to the consolidation zone.

ADA cardano vs ETHWhat is going on with ETH? is loosing ground vs ADA. That's mean ADA is coming back from its long coma. ETH with its ridiculous TPS and fees is not anymore the preferred platform to build applications.

Cardano (ADA): Bullish Channel Formation with Upside Potentialhello guys!
Key Observations:
Strong Impulse Move:
ADA recently experienced a sharp rally, breaking through resistance levels and establishing a new range.
Fake RSI Divergence:
A deceptive bearish RSI divergence was invalidated as the price continued its uptrend, confirming bullish momentum.
Support Holding at Lower Channel:
The price is currently consolidating near the lower boundary of the parallel channel, suggesting a potential bounce.
Next Target:
If the price respects the channel structure, ADA could aim for the 0.90 - 0.94 USD range as the next resistance.
Conclusion:
As long as the lower trendline holds, ADA remains bullish with a high probability of an upward breakout. However, traders should monitor the channel support for potential invalidation. 📈🔥

Cardano Forming a pennantSo i think Cardano can finally get a little umph to get out of this range we can see it push up to the .85xx range....

ADAUSDT - BULLİSH FLAGAbove the 0.8213 level, I will consider buying goods, but you can also buy from the support of the channel. It would be ridiculous to buy this coin before the volume comes. Therefore, it is necessary to wait. I will keep an eye on RSI-ADX and Fib levels. If the volume rises, it will make a good exit. This bull flag will work then.

CARDANO → 𝐁𝐮𝐥𝐥𝐢𝐬𝐡 𝐏𝐫𝐞𝐬𝐬𝐮𝐫𝐞 !!!The price has formed a Triangle on the 4h time frame, and if it breaks out, it can drive the price up to around $0.96 .
Give me some energy !!
✨We spend hours finding potential opportunities and writing useful ideas, we would be happy if you support us.
Best regards CobraVanguard.💚
_ _ _ _ __ _ _ _ _ _ _ _ _ _ _ _ _ _ _ _ _ _ _ _ _ _ _ _ _ _ _ _
✅Thank you, and for more ideas, hit ❤️Like❤️ and 🌟Follow🌟!
⚠️Things can change...
The markets are always changing and even with all these signals, the market changes tend to be strong and fast!!

short another try .
so slow moving up with high seller limits
look at 4H candle , could be the same move as prevous one

ADAUSDT will be ready to push up soonFor ADAUSDT we will be waiting for a small drop before we look for the buy setup.

ADA’s Long-Term Potential, But a Short-Term Drop Is ComingLooking at the crypto market right now, there’s a lot of uncertainty—and Cardano (ADA) is feeling the heat. Bitcoin is holding up well thanks to massive inflows into spot ETFs, but altcoins like ADA just aren’t keeping up. And that’s a problem.
Macroeconomic Pressure: A Tough Environment for ADA
One of the biggest factors weighing on ADA is the current macroeconomic landscape. Many traders were hoping for early interest rate cuts from the Federal Reserve, but that’s looking increasingly unlikely. Inflation remains sticky, and as long as rates stay high, speculative assets like ADA will struggle to attract fresh demand.
Another key issue is capital flow: Institutional investors are laser-focused on Bitcoin. We’re seeing billions pour into BlackRock and Fidelity’s Bitcoin ETFs, while altcoins are largely being ignored. ADA might have strong fundamentals, but without serious buying pressure, it’s hard to push the price higher.
Why ADA Is Particularly Weak
Compared to other altcoins, ADA lacks a strong narrative right now. Ethereum is getting a boost from the upcoming Dencun upgrade, and Solana is thriving thanks to high network activity and meme coin hype. But ADA? It’s been quiet.
Cardano has a dedicated community, which is great for long-term vision, but not ideal for short-term price action. Right now, the market is favoring assets with strong momentum and hype—and ADA doesn’t have that.
My Outlook: More Downside Ahead
Unless ADA can break above $0.835 with real buying volume, I see more downside risk. I expect a retest of the $0.66 level soon, and if that doesn’t hold, we could see a drop to $0.50.
Bottom line? There’s no strong catalyst to push ADA higher in the short term, while macro factors and capital rotation keep the pressure on. That’s why I’m shorting ADA and waiting for a shift in sentiment before considering a long position.


short ADA couldb e sqeese
volumes
losing a lot of longs
not neough time to explain all :)
and i noticed a lot of willines to get low along last days

ada/usdthello friends
As we specified for you, we have two good support ranges for price growth, which we specified for you...
If the support range is maintained, the price will move up to the ceiling of the channel.
*Trade safely with us*
