Cardano short to $0.7778Just recently took a short position on ada. Its more of a scalp short. I anticipate that within the next 4hrs the market is likely to push back down to $0.7778 and now its just likely wicking up a little to then push back down.
ADAUST trade ideas

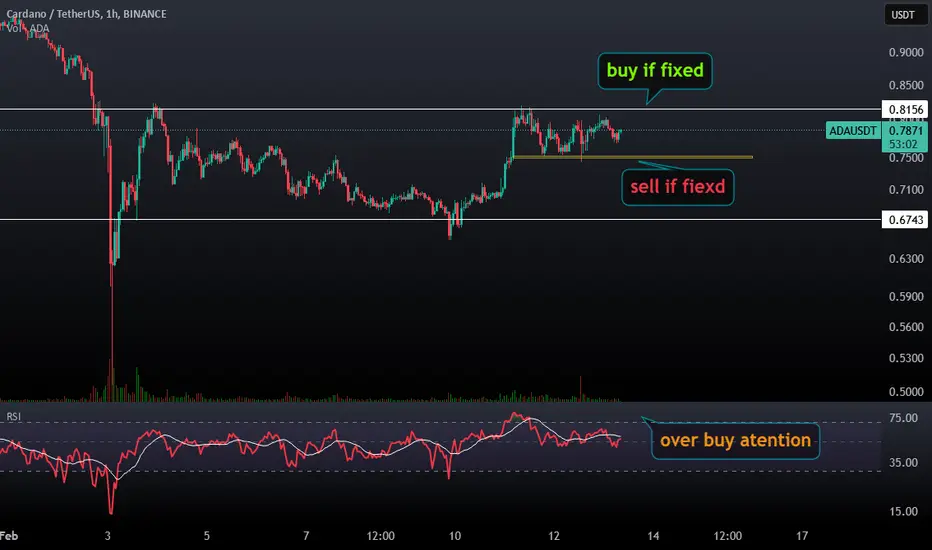
#ADAUSDT ( resistance band )Right now the main problem in the growth path is the red resistive band.
We are waiting for the failure of this gang to continue growing
We are also monitoring the green support line
So wait and watch

Fake Breakout Alert: Don't Be Fooled by the Deceptive Move!Hi Everyone,
While ADA looks bullish in a small time, in a daily chart still looking bearish ,
Do not get fooled by this fake move and the reason is , the market still need to get the longs as they are LOTs.
If you wish to open a short position make sure you don't use all your capital at once, spread it as it will bring you more gains and minimise your risk.
For sure we do not suggest you open long position , but the decision is up to you.
Market at the moment looks a bit manipulated ,so be extra cautious!

Bull Flag on ADAThis looks like the perfect bull Flag on the 4hr chart for ADA it's retesting the trend now And should take us to .85 or .86 cents in this next move up.

ADA/USDT 1H: Bullish Structure Holding – Breakout to $0.88?!!ADA/USDT 1H: Bullish Structure Holding – Breakout to $0.88?
🚀 Follow me on TradingView if you respect our charts! 📈 Daily updates!
Market Structure & Momentum:
Current Price: $0.8231, showing bullish momentum.
Pattern: Ascending triangle formation, confirming higher lows and Smart Money accumulation.
RSI at 61.24, still below overbought levels, allowing room for further upside.
Key Levels:
Support: $0.78 (previous demand zone).
Resistance: $0.84 (breakout level).
Stop Loss: Below $0.775 (under structure support).
Targets:
T1: $0.85 (short-term resistance).
T2: $0.88 (extended move).
Long Setup (Confidence 8/10):
Entry Zone: Current price ($0.8231).
Hidden bullish divergence on RSI, confirming strength in momentum.
Smart Money accumulation visible, reinforcing higher lows.
Risk Score:
7/10 – Strong setup, but confirmation needed above $0.84.
Market Maker Intent:
I
nstitutional buying pressure visible, signaling demand at current levels.
Market Makers likely accumulating before next leg up.
Break above $0.84 confirms strength and triggers upside continuation.
Recommendation:
Long entry favorable at current price ($0.8231).
For a safer entry, wait for a confirmed breakout above $0.84.
Maintain stops below $0.775 to minimize downside risk.
Confidence Level:
8/10 – Bullish structure intact, but breakout confirmation required.
🚀 Follow me on TradingView if you respect our charts! 📈 Daily updates!

READY TO EXPLODE! january'25ADA is at the moment just before breake the flag formation.
Is it right time to trade ?
For me it is.
X10 long
RR 1:17
Profit 747%-960%
10% of capital/entry (the rest is waiting)
1st Entry 0.90$
2nt Entry 1.0$
3rd Entry 1.13$
Stop 0.84$ or previous entry.
First Target 1.57$
Second Target 1.75$
Enjoy!

Cardano (ADA) Approaches Key ResistanceCardano (ADA) has been slow-moving, but its recent upswing above $0.81 hints at a potential breakout. Following BNB’s recent rally, ADA could aim for $1, but challenges remain.
Key Technical Levels & Trends:
📌 Resistance at $1.2 – ADA faced rejection here, triggering a descending parallel channel.
📌 Current Range – Trading between the 50-day & 200-day MAs, keeping bullish hopes alive.
📌 RSI & Ichimoku Cloud Concern – RSI shows bearish divergence, while Ichimoku’s +Di failed to confirm a bullish crossover.
Can ADA Break Above $1?
📈 Bullish Path: If ADA sustains momentum above $0.85, a move toward $1 is possible.
📉 Bearish Risk: Weak buying volume & market hesitation could lead to another rejection at $0.85.
For ADA to truly break out, stronger market sentiment and higher buying volume are needed. Will February be the month ADA finally crosses $1?

$ADA LongTermCardano has been showing a strong uptrend on the weekly timeframe, with higher highs and higher lows confirming its bullish momentum.
The overlap of the static level and the 61% Fibonacci retracement forms strong support, and a solid candlestick is taking shape.
Targets are based on Fibonacci levels, making it a promising setup for the long term .

#ADAUSDT Approaching Key Resistance – Breakout or RejectionBYBIT:ADAUSDT.P is showing strong bullish momentum, breaking above the $0.8150 resistance zone. Volume is increasing, confirming buyer interest, and the price remains above POC $0.7848, supporting the uptrend. However, the next move will depend on the reaction at $0.8190.
📊 LONG BYBIT:ADAUSDT.P from $0.8190
🛡 Stop Loss: $0.8085
⏱ 1H Timeframe
✅ Overview:
➡️ BYBIT:ADAUSDT.P is testing the upper boundary of its recent range, attempting to hold above $0.8150.
➡️ Buyers are active, but confirmation of the breakout is still needed.
➡️ Holding above $0.8190 would increase the likelihood of reaching $0.8410.
⚡ Plan:
✅ Long confirmation requires a breakout above $0.8190 with strong volume.
✅ If volume decreases, a pullback to $0.8085 is possible before further upside.
✅ Another option is a retest of $0.8150 before a new breakout attempt.
🎯 Take Profit:
TP1: $0.8410 – next resistance level.
🚀 BYBIT:ADAUSDT.P is gaining strength — expecting a test of $0.8410!
⚡ Best approach – watch price reaction at $0.8190. If price holds above this level, the long trade remains valid. If weakness appears, a pullback to $0.8085 is likely.
⚡ Key rule – wait for confirmed breakout before entering, don’t anticipate it!

Anomaly ADA Flase moving up , but huge limit orders says , that we going to go lower ...especially after starting distribution
there was a lot of limit sell order before

Time to Buy Cardano..? Analyzing the Current BreakoutCardano (ADA) has recently surpassed a significant resistance level on the daily timeframe, but it is currently facing challenges in maintaining its position above this level. A potential long trade could be considered if the daily candle closes at or above the 0.8200 mark. Conversely, if the price fails to hold above this level and begins to decline, a short position may be warranted once the price falls to or below the 0.7400 level on the daily candle, with a recommended stop loss set at 0.8100.

ADAThe position of a trade has decreased in volume, and we are currently at a trading pause at the top of a short-term range between two zones. This could be an opportunity to start a trade on a timeframe below 4 hours. Make sure to manage your capital properly. Thank you!
ADA : This May Be Your Last Chance Before Exploding to Upside !!As you can see, the price is forming two bullish patterns on the daily timeframe, If my view is correct, ADA will rise to 0.93 .
And if this pattern is correct and breaks, higher targets are possible.
Give me some energy !!
✨We spend hours finding potential opportunities and writing useful ideas, we would be happy if you support us.
Best regards CobraVanguard.💚
_ _ _ _ __ _ _ _ _ _ _ _ _ _ _ _ _ _ _ _ _ _ _ _ _ _ _ _ _ _ _ _
✅Thank you, and for more ideas, hit ❤️Like❤️ and 🌟Follow🌟!
⚠️Things can change...
The markets are always changing and even with all these signals, the market changes tend to be strong and fast!!

ADA About To Start a New Bullish Rally📈 At Daily Timeframe There Is a Bull Flag Formed At The Chart By The Clear ABC Structure And Wave C Completed Exactly At The 1.618% PRZ, New Bullish Rally Is About To Start Toward a 1.15$ And 1.83$


ada sell markethello friends
Due to the failure of the trading range, we can have a fall.
Trade safely with us.


ADAUSDT CHART ANALYSİS-EDUCATİONAL POSTHigh-Profile Projects
In the NFT format, the first piece of art was a black and white work by the artist Banksy, a 2007 stencil called Morons (White). Blockchain company Injective Protocol bought it, burned it, and created an NFT — a virtual asset tied to a “digital image of an art object”.
The first musician to turn his album into a token was DJ 3LAU. He sold a limited edition album and made $11.6 million. After that, singer Grimes, known as the mother of Elon Musk’s child, sold 400 NFTs featuring her drawings. In just 20 minutes, the token sale brought Grimes $5.8 million.
Overall, for creatives, NFTs are a way to monetize their skills and expand their audience. Because of the lack of logistical difficulties, it’s easier to sell artwork digitally than it is offline.
It’s not just artwork that sells in the format of the non-fungible token. Even a popular meme can have a new owner. For example, in the gif Nyan Cat, the cat is hurtling through space and leaves a trail of rainbows behind it, which sold at auction for $590,000.
However, last year’s most high-profile projects in the NFT industry have been the CryptoPunk, Meebits, and BAYC (Bored Ape Yacht Club) collections. They include several thousand collectible cards and pictures in a stylized modern art format. The total value of the collections is estimated at several billion dollars. Hundreds of thousands of crypto enthusiasts and investors are after such NFT exhibits.
These and many other projects likely have growth prospects, as the technology, according to experts, has not yet reached the peak of its capabilities.
Conclusion
The NFT market is developing extremely fast, and the blockchain infrastructure has undergone significant changes over the past few years. However, today, there are still many questions about how the NFT market can function and in which areas non-fungible tokens can be used.
For example, one potential application of NFT is the blockchain recording of unique documents. Due to the reliability of the blockchain, diplomas, certificates, and various documents can be issued in NFT format, potentially helping to eliminate the risk of forgery.
NFTs are likely to have, and are already having, some impact on formats for creating and distributing content, and art objects. For now, however, it is primarily a trending investment tool for crypto enthusiasts around the world. The numerous possibilities of this technology will be revealed in the coming years.

ADA Reversal Confirm Bullish!!!!I am sharing my Views as per the technical Analysis
Bullish divergence Formation, Bearish momentum goin weak.
The price action is forming a symmetrical triangle, which is typically a neutral pattern, meaning it can break out in either direction.
Key Support & Resistance Levels
Resistance: Around $0.95 - $1.00
Support: Around $0.65 - $0.70
. Bullish Indications:
The price is approaching the apex of the triangle, suggesting an imminent breakout.
A breakout above the upper white trendline could push ADA towards $1.00+
5. Trading Strategy:
✅ Long Position:
Enter if price breaks above the white resistance line and confirms with volume.
Target: $0.95 - $1.05
Stop-loss: Below $0.6

Cardano / TetherUSHello dear traders,
This is an analysis of the cryptocurrency Cardano, for which I am providing you with an updated daily analysis. Cardano is currently in a corrective trend and the daily buying zone is currently far from us. An excellent selling zone is marked on the chart. Once the price reaches this zone, we can enter a selling position with technical confirmation. If we do not have technical confirmation, we should also expect a new peak. However, considering the total crypto analysis, which is currently bearish, this cryptocurrency is likely to also trend downwards.
Daily Supports:
Daily Support: 0.3730
Daily Range: 0.3393
Monthly Liquidity : 0.2756
Wishing you all the success!
Fereydoon Bahrami
A retail trader in the Wall Street trading Center (Forex)
Risk Disclosure:
Trading in the crypto market is risky due to high price changes. This analysis is just one person's opinion and shouldn't be taken as financial advice. Before investing, it's best to talk to a financial advisor and do your own research. You are responsible for any profits or losses from this analysis

Public trade #24 - #ADA price analysis ( Cardano )CRYPTOCAP:ADA price was drained quite a bit on 03/02/25, but today it shows one of the best rates of buyback (of course, among the “old” coins with a large market cap)
Let's try to bribe to ourselves with #Cardano
The approximate trade for the investment portfolio is shown on the chart, and also we will take #ADA in copytrading as the price moves, depending on the dynamics.
Do you believe that the price of OKX:ADAUSDT will reach $5.60-6.50 in this 2025 growth cycle?
_____________________
Did you like our analysis? Leave a comment, like, and follow to get more

ADA at a Breaking Point: Will It Skyrocket or Crash?Yello! Are you ready for what’s coming with #ADAUSDT? The price action is heating up, and the next move could be explosive. #ADA is showing signs of a critical Elliott Wave structure, and what happens next will determine whether we see a massive rally or a sharp drop. Let’s dive into the analysis.
💎#CARDANO has just completed a strong impulsive 5-wave structure, topping out around $0.8211. At this peak, we’re seeing a double top formation with corrective Wave B, which is often a bearish reversal signal that’s exactly what’s unfolding now with an ABC correction pattern. The price is currently in Wave B of the correction, gearing up for a potential drop towards Wave C.
💎The critical level to watch is the Golden Pocket Zone (FIB 0.168) around $0.7430. This zone is crucial because if #ADAUSD holds this level, it could trigger a strong bullish reversal that sends the price towards the $0.8240 Supply Zone.
💎However, if ADA fails to hold momentum at the FIB 0.168 level and closes below it, we could see it dropping further, potentially targeting the imbalance and bullish OB zone at $0.7089.
💎Before entering a trade, we add confirmation such as ensuring the RSI and MACD form a bullish divergence. If they do, that means the Wave C correction has ended, and a new Elliott Wave structure is on the way, offering a long opportunity.
What’s your take? Will ADA bounce or break down? Share your thoughts below! 💬
MyCryptoParadise
iFeel the success🌴

$ADA Surges 15% Amid Grayscale’s Groundbreaking ETF ProposalCardano ( CRYPTOCAP:ADA ), the ninth-largest cryptocurrency by market cap, is making headlines once again. This time, it’s not just about its innovative blockchain technology or its proof-of-stake consensus mechanism—it’s about a potential game-changer in the world of traditional finance. Grayscale Investments, the powerhouse behind the first Bitcoin ETF, has proposed a first-ever Cardano ETF for listing on the New York Stock Exchange (NYSE). This announcement sent CRYPTOCAP:ADA soaring by 15%, with its price hitting $0.7953 and its market cap climbing to $27.99 billion. But what does this mean for Cardano, and why is this development so significant? Let’s break it down.
Grayscale’s Cardano ETF Proposal
Grayscale’s filing for a Cardano ETF marks a pivotal moment for the cryptocurrency. Unlike its previous ETF filings for Solana and XRP, which involved converting existing trusts into ETFs, the Cardano ETF is a brand-new offering. If approved, the Grayscale Cardano Trust (ticker: GADA) would allow traditional investors to gain exposure to ADA without the complexities of managing private keys or navigating crypto exchanges. Coinbase Custody would serve as the custodian, while BNY Mellon would handle administrative tasks.
This move is particularly significant for Cardano, which has often been overshadowed by Bitcoin and Ethereum in the ETF conversation. While Bitcoin and Ethereum ETFs have dominated discussions, Cardano’s inclusion signals growing institutional interest in altcoins. However, regulatory hurdles remain. The SEC has previously classified ADA as a security in its lawsuits against Binance and Coinbase, which could complicate approval.
Technical Analysis
From a technical standpoint, Cardano is showing strong signs of a bullish reversal. Here’s what the charts are saying:
1. Price Action and RSI:
Despite the 15% surge, Cardano’s Relative Strength Index (RSI) sits at 46, indicating that the asset is not overbought. This suggests there’s still room for upward movement before hitting resistance levels. The lack of overbought conditions is a bullish signal, as it implies sustained buying pressure.
2. Fibonacci Levels:
In the event of a market pullback, the 78.6% Fibonacci retracement level serves as a strong support zone. This level has historically acted as a springboard for price recoveries, making it a critical area to watch.
3. Breakout Potential:
A breakout above the 1-month high pivot point could trigger a sustained bullish streak, potentially propelling ADA toward the psychologically significant $1.5 mark.
4. Volume Surge:
Trading volume for ADA spiked by 51% to $1.16 billion, reflecting heightened market activity and investor interest. Increased volume during a price surge is a strong confirmation of bullish momentum.
Why This Matters for Cardano and the Crypto Market
Grayscale’s Cardano ETF proposal is more than just a win for ADA holders—it’s a milestone for the broader cryptocurrency market. Here’s why:
1. Institutional Adoption:
An ETF would open the doors for institutional investors who have been hesitant to dive into the crypto space due to regulatory and custodial concerns. This could bring significant capital inflows into Cardano.
2. Regulatory Clarity:
While the SEC’s stance on ADA remains uncertain, Grayscale’s filing could push regulators to provide clearer guidelines on altcoin classification. This would benefit the entire crypto ecosystem.
3. Market Sentiment:
The mere announcement of a Cardano ETF has already boosted market sentiment, as evidenced by the 15% price surge. Approval could further solidify Cardano’s position as a top-tier blockchain project.
4. Altcoin ETF Landscape
If approved, the Cardano ETF could pave the way for similar products targeting other altcoins, expanding the reach of digital assets in traditional finance.
Conclusion
Cadano’s 15% surge following Grayscale’s ETF proposal underscores the growing institutional interest in the project. With strong technical indicators pointing to further upside and a groundbreaking ETF filing that could reshape the altcoin landscape, CRYPTOCAP:ADA is poised for a potential breakout. While regulatory challenges remain, the proposal marks a significant step toward mainstream adoption.
