ADNOC Gas (ADX) – Riding Wave 5
Analysis:
The stock appears to be in Wave 4 completion, and Wave 5 seems to be forming as per Elliott Wave Theory. The recent pullback aligns well with a key demand zone around 3.39, which has been respected, indicating strong buying interest.
Wave Analysis:
- Wave (1): Impulsive move from a prior consolidation range.
- Wave (2): Corrective pullback, respecting prior demand.
- Wave (3): Strong impulsive move higher with increased momentum.
- Wave (4): A corrective pullback to a demand zone near 3.39, forming a higher low.
- Wave (5): Targeting 3.97-4.00 levels, aligning with a Fibonacci 1.618 extension of Wave 3.
Supply/Demand Zones:
- Demand Zone: 3.39-3.14 (validated as price has reversed strongly).
- Supply Zone: 3.97-4.00 (potential resistance as Wave 5 completes).
RSI Confirmation:
- RSI on lower timeframes (e.g., 4H and 1D) shows no bearish divergence, which supports continued bullish momentum for Wave 5.
Trade Setup:
- Entry: around 3.52.
- Stop Loss: Below the wave 4 low at 3.39 to minimize risk.
- Take Profit: Target Wav 5 completion at 3.97-4.00.
- Risk-Reward Ratio: Approx. 1:3
“Trade what you see, not what you feel.”
Stick to your analysis and avoid chasing the market if the price fails to confirm Wave 5.
Always use proper risk management. Allocate no more than 1-2% of your account balance to this trade to ensure sustainability.
Patience is a trader's greatest asset!
Happy trading! 🚀
Disclaimer:
This idea is for educational purposes only and not financial advice. Always do your due diligence and consult a professional before making any trading decisions. Trading involves significant risk, and past performance is not indicative of future results.
ADNOCGAS trade ideas

ADNOCGAS is looking good and about to breakoutADX:ADNOCGAS is trading about 200 and 50 MA with bullish price action. Long the breakout of 3.23 AED, targets are shown on the chart. Stop daily close below 3.06 AED.
Not financial advice, only my view

EMIRAT ARABE ADNOC GAS DOWNPeriod: D1 Current trend: bearish Analysis: based on price trends, ITC, high/low volume indicators and also QQE
forecast: bearish
after a retest break of the daily order block at the 2.9 round figure, the price will make a descent to the order block. there will be a reversal of the trend for some time and there is even a risk of breaking support.
i think and suggest selling this stock...

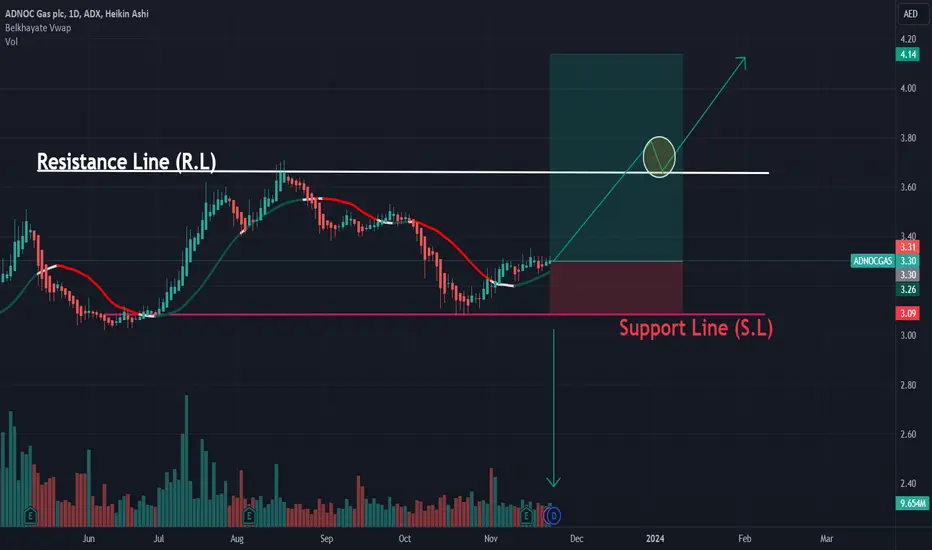
ADNOC GAS (ADX), to target 3.82 after crossing resistanceDaily chart, the stock ADNOC GAS is trading between support and resistance lines since mid June 2023.
A Triangle chart pattern is being formed - After the price clearly crosses the resistance line (BLUE), around 3.15 - 3.16, then the target will be 3.82, passing through some resistance levels as shown on the chart.
ENTRY #1 : BUY at touching the support line (RED) around 3.02 - 3.03 and rebounding.
Stop Loss below 3.00
ENTRY #2 : BUY after clear crossing of resistance line (closing 2 days above / or one day and high volume)
Stop loss after breaking down resistance line.

ADNOCGAS: Buy ideaOn ADNOCGAS as you see on the chart we will have a hight probability to have an uptrend if only if we have the breakout with force the resistance line by a big green candle follow by a large green volume.Thanks!
A new wave up in ADNOC GASADNOC Gas Processing is a natural gas producing company and the largest gas processing complex in Abu Dhabi.
The share of ADNOC GAS went up in an impulse from march 2023 and completed the impulse wave up by august 2023
From Aug. 2023 to Oct 2023 the share corrected 61.8% of the entire rise in the form of an Elliot Wave zig zag(ABC).
The Wave 3 for the stocks seems to have started off and the projected target for the same would be approx.4.15 AED(26% from CMP).
Note*- This post is for educational purpose only

Adnoc GasI think ADNOC Gas's decline has ended
First, it reached the target of the head and shoulders pattern and began to fluctuate horizontally without breaking the last low of 3.08
Secondly, the target of the aforementioned model coincided with the second most important support area
Third, the histogram bars of the MACD indicator began to rise throughout the period of fluctuation and were about to turn into a positive zone (near the intersection of its averages in a positive way). This means that buying is the one that has been dominant throughout the period since it reached the bottom of 3.08.

Pullback then may rise to 3.64.The descending channel is broken and after the pullback to the range of 3.43, the price may rise to 3.64.
entery : 3.43
target : 3.64
ST : 3.39
TP : 3.63

Scary & safeTrend
For now its still looking safe and in a uptrend, but i hope its not forming a head & shoulder pattern. If the pattern is confirmed then be ready for a selling scenario till about 3.30 zone
New High
On the other side, if it manages to close above 3.60 this will be a good sign that its ready to go higher and bearish pattern will be invalidated. Over all i am bullish on this stock for now with oil prices going higher.
Hit like & follow guys ;)

long term bullish and looks positive on an uptrend and looks very interesting after a small drop for accumulation and now going to the 4 aed territory by September will the show the potential

Lets WaitAdnoc gas is stuck with the rectangle lets wait for the breakout to confirm the trend, this will be a wait and watch game as let it decide the trend, let the big boys buy this stock and then we will make the entry.
Hit like & follow guys ;)

ADNOCGAS Bearish trend continues but maybeMay be there is a chance of this getting a bounce from the trend support line
Or it can go back to the strong support of 3.05 to 3.07
Lets wait and see . This correction is not due to any news

ADNOCGAS, UAE, to go uptrend after a slight correction ADNOCGAS, AbuDhabi, UAE,
On the daily chart, a sign for a profit taking (minor correction), then to go uptrend

ADNOCGAS Channel broken AdnocGas was going in an amazing direction making a parabolic move since inception but looks like it has entered into a correction phase
The parabolic channel is now broken and support is being established at the moment
3.17 to 3.21 is an important support channel which has been tested multiple times since the demise
Its a good time to create a partial position . if it falls to the next support level that is around 3 to 3.07 area then more accumulation can be made.
So far I haven't found any news related to this drop so it could be just a correction

ADNOCGAS Paraobolic ride EnjoySince the inception of this lovely stock its continuing a parabolic move and has recently retested its new channel median support line
Entry at current price or any where close to the support line i.e 3.35
Until this trend is not broken the move can be ridden .
If it goes below 3.20s and forms a new support and retest it then it means this parabolic channel is broken and then we will analyse the movement again.
Best of luck
