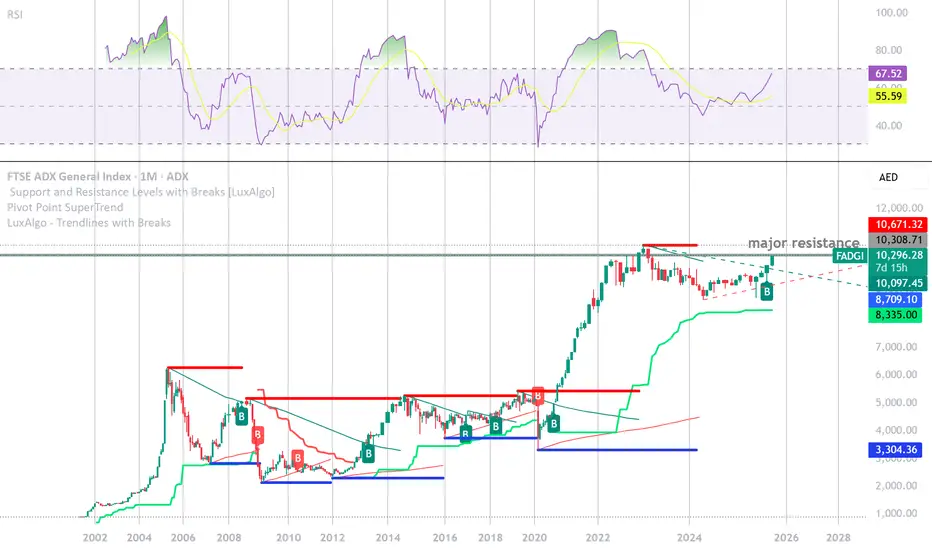
INSIGHT: ADX Index Positioned for Breakout—But Eyes on ResistancThe FTSE ADX General Index is at a technically sensitive level, hovering near the R1 (Classic) resistance of 10,148 and marginally above key moving averages (VWMA 20 at 10,056.94 and HMA 9 at 10,266.15). This suggests **bullish momentum is building**, supported by a “**Strong Buy**” signal on technical indicators.
The index recently completed a breakout from a **multi-year symmetrical triangle**, and is now flirting with **major resistance (\~10,300–10,340)**, which coincides with the **R2 level (Classic & Woodie)**.
💡 Why This Matters:
* A decisive move above 10,340 (R2) could trigger a **fresh bullish leg** toward **R3 at 10,909**, confirming the breakout.
* Support sits at 9,768 (Pivot) and **9,577 (S1)**—if price pulls back, these zones should be closely monitored for potential entries.
🧭 Conclusion: The ADX Index is sending bullish signals both structurally and through indicator convergence. However, a confirmed close above 10,340 with rising volume would validate the breakout and could signal the start of a sustained rally.
FADGI trade ideas
ADX ready for take off?📈 Current Price & Volume
• The index closed most recently around 9,981.5 AED—near its 52‑week high of 10,000.87 AED
• Today’s trading volume was unusually strong—roughly triple the 3‑month average—which often signals a potential trend shift ().
⸻
🔍 Technical Summary (Investing.com)
• Overall stance: Strong Buy across daily, weekly, and monthly timeframes .
• Oscillators (RSI, MACD, ADX) are bullish:
• RSI at ~68 indicating bullish momentum (just below overbought)
• ADX trend strength at ~36 
• Moving Averages: All key averages (5, 10, 20, 50, 100, 200) show Buy signals .
⸻
📊 Chart Pattern Insights
• TradingView commentary suggests a breakout from a falling wedge—a bullish reversal pattern.
• The index has moved into a confirmation phase, consolidating near all-time highs before the next leg up ().
⸻
⚙️ Support & Resistance Levels
• Resistance: Around pivot zone of 10,001–10,021 AED (R1–R2 from pivot points) .
• Support: Established near the 9,800 AED range, close to prior breakout point.
⸻
🧭 Summary of Technical Trend
• Strong uptrend momentum, validated by multi-timeframe buy signals.
• Fresh breakout from wedge pattern suggests further upside potential.
• Elevated volume supports sustainability of this rally.
⸻
➤ NOTES:
• Bullish Momentum: Strong buy signals across oscillators and moving averages; trend strength confirmed by ADX.
• Pattern Breakout: Completion and breakout above falling wedge indicates reversal into bullish phase.
• Support Surround: Healthy volume and solid support around 9,800 AED reduce short-term downside risk.
⸻
🗂️ Tactical Setup
• Entry: On a clean break above 10,021 AED (R2 pivot) with sustained volume.
• Target: Next resistance zone near 10,200–10,300 AED.
• Stop-loss: Below 9,800 AED support area.

FADGI Index: Sideways Movement After Downfall
Title:
FADGI Index: Sideways Movement After Downfall
Greetings, Fellow Traders!
🌟 Hello everyone,
The FADGI Index is currently experiencing a phase of sideways movement following a recent downfall, signaling a potential shift in market dynamics.
ADX:FADGI
Key Observations:
- The FADGI Index has entered a period of consolidation after a downward trend, suggesting a potential pause in the bearish momentum.
- Market participants are closely monitoring the index's behavior, looking for indications of stability or further downward movement.
- The current sideways movement may present trading opportunities for those who can identify potential reversal signals or consolidation patterns.
Technical Analysis:
Analysis of the FADGI Index's price chart reveals a pattern of sideways movement, with price action oscillating within a defined range. Technical indicators may provide insights into the strength and duration of this consolidation phase.
Fundamental Factors:
Beyond technical analysis, fundamental factors such as economic indicators, geopolitical developments, and market sentiment can influence the direction of the FADGI Index. Traders should remain vigilant to changes in these factors.
Trading Strategies:
Given the current sideways movement in the FADGI Index, traders may consider adopting range-bound trading strategies. This could involve buying near support levels and selling near resistance levels within the established range.
In Conclusion:
As the FADGI Index navigates through a period of sideways movement following a recent downfall, traders are advised to remain patient and vigilant. This phase may offer opportunities for short-term trading strategies, but it's essential to exercise caution and manage risk effectively.
Engage with Us:
🟢 If you find this analysis insightful, please give it a LIKE.
🟡 Don't forget to FOLLOW for more updates.
🔵 SHARE with fellow traders who might benefit from this information.
🔴 Feel free to COMMENT with your thoughts and insights!
Your active participation enriches our trading community, fostering knowledge exchange and collective growth. Share your feedback and ideas in the comments below or by boosting this post.
Looking forward to connecting with you in the next post.
Happy trading!


Abu Dhabi MarketAbu Dhabi Market broke the neckline in the negative slanting head and shoulders pattern...then confirmed it by breaking the neckline of the negative Adam and Eve pattern.
The lower targets are activated, but usually, and from my experience, prices do not go directly to them.. In 80-90% of cases, there is a temporary rebound either to the closest resistance or, at a maximum, to the second resistance 😔

Make Or Brake!Abu Dhabi Securities Exchange is at crucial support area, it have broken the trend line which is a sign of weakness but still the up trend is intact. We need more bulls to get activated at current levels to push the market index higher.
Scenario One
Either market can retrace 50% of Fib level to see a rejection and come down to make lower low, this will effect the trend we can see a reversal unfortunately. This will be the beginning of a fresh down trend hopefully we don't see this as sentiments are really positive in the market as of now.
Scenario Two
Market may push up till 50% Fib level and then take a pause around that zone, then there are good chances it will break the resistance of 9900 and we may see fresh rally which may break the solid resistance of 10000 points creating a higher high.
Conclusion
Market should hold at current levels to maintain the trend, bulls need to bounce back!!

Bull Trend ADXAfter a long Bear trend from Nov 22 , Finally ADX has broken the bear trend and has started its Bullish movement.
Its a great time to take entries

Under PressureSurprisingly ADX stocks are not performing well for the last 2 months or so. Market can come down to retest the support level again that is around 9800. Burjeel will also be added to the index, its getting listed tomorrow so expect so high volumes. All the best to Burjeel Holdings.
Hit like and follow guys ;)

Ready to go higher!!Over all market index is looking very promising and more upside is expected. Bulls are in the house!!!
!
Hit like & follow guys ;)
