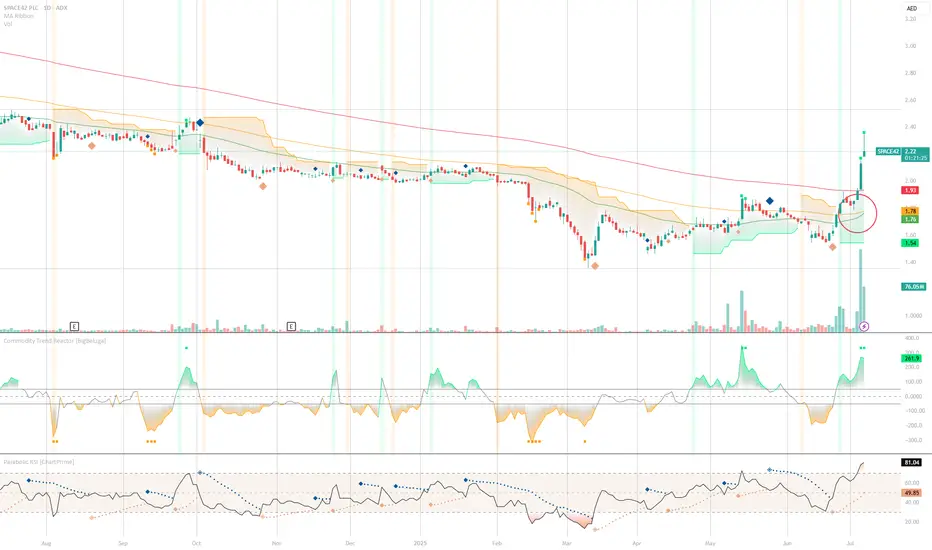
preparing for lift-off with Bullish flag formation on SPACE42? Traders, take a look at this beauty unfolding on SPACE42's daily chart 👀
After a powerful upward thrust — a textbook "flagpole" — price action has been gently coiling down within a tight parallel channel. This classic **bull flag** pattern suggests we might just be seeing a pause before the next big move. 🏁
Key Highlights:
* Sharp rally → momentum confirmed ✅
* Flag consolidation → decreasing volume 💤
* Breakout potential → waiting on the edge 🚀
What to watch:
* A strong close above the upper trendline with volume could ignite the next leg up 🔥
* Target projection? Classic bull flag logic says: measure the pole, add it to the breakout 💡
Not a recommendation — just a chart talking loud and clear! 🎯
Let’s see if SPACE42 honors the pattern... or fakes out. Stay nimble, stay sharp ⚡
#SPACE42 #BullFlag #ChartPatterns #TechnicalAnalysis #PriceAction
SPACE42 trade ideas
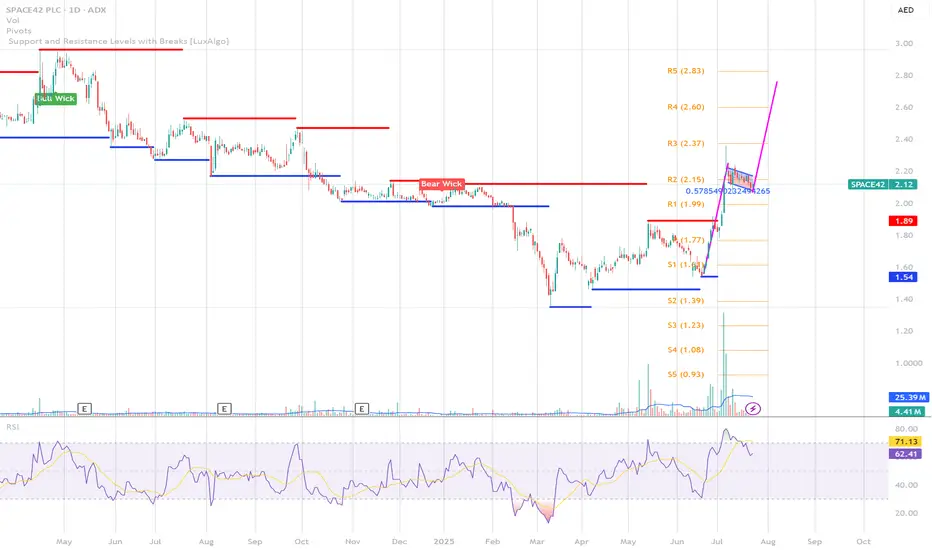
Wedge Watch: SPACE42 Poised for Liftoff from Falling Orbit?
➤ 📈 RECOMMENDATION: BUY (Speculative)
➤ 🔍 REASONING:
📉 Chart Pattern: This is a falling wedge — a classic bullish pattern often seen at the end of a downtrend.
🚀 Bullish Signal: A breakout above the upper wedge line 📈 typically signals the start of an **uptrend**.
📊 Volume: Look for increasing volume** on the breakout 🔊 — this confirms momentum.
📐 Trend Structure: The narrowing price range with higher lows = buyers are stepping in gradually 💪.
🛠️ Action Strategy:
🟢 Entry: Buy on breakout above the upper trendline.
🛡️ Stop-loss: Just below the recent swing low inside the wedge.
🎯 Target: Take the height of the wedge and project it upward from the breakout level.

Updated Technical Analysis: Space42 PLC Daily CharThe daily chart of Space42 PLC is showing a strong bullish breakout from a long-term downtrend.
Key Observations:
Price Breakout: The price has decisively broken above the resistance at 1.78 AED, which was a key ceiling for several months.
Retest and Confirmation: There was a brief throwback to retest the 1.78 AED level, which successfully held as support, confirming the breakout.
Next Resistance : The immediate resistance is now located at 2.40 AED, which is the next technical target suggested by the breakout structure.
Support Levels:
Primary support: 1.78 AED (previous resistance, now confirmed support)
Secondary support: 1.60 AED (lower support zone within the previous consolidation range)
Indicators:
RSI: Currently at **80.77**, indicating strong momentum but also nearing overbought territory. Price may consolidate or pull back in the short term before further continuation.
Volume: A significant spike in volume accompanies the breakout, adding credibility to the move.
Commodity Trend Reactor: Displays positive strength and aligns with bullish momentum.
What to Watch:
Holding 1.78 AED Support: If the price remains above this level, the bullish structure is intact.
Approach to 2.40 AED Resistance: Look for signs of continuation (strong bullish candles and sustained volume) or potential rejection.
Pullback Behavior: A controlled retracement to 1.78 AED with low volume would be healthy and could provide a continuation setup.
Volume and RSI: Watch for decreasing volume on pullbacks and RSI behavior near current levels for potential cooling before a next leg higher.
Key Levels:
Support: 1.78 AED, 1.60 AED
Resistance: 2.40 AED
The current price action suggests bullish momentum, but traders should closely monitor how the stock behaves around these critical levels for confirmation of further movement.