ADXBTC trade ideas

ADX uptrend esteblished
Check out this day chart to see the big picture. ADX starting an uptrend. Tested 3470 resistance couple of times but still below. Either pullback or keep on going on hype. Targets for 1-2 weeks (maybe less), but if reached, it will be only a beginning.
Buy zone either on pullback to ~3350-3380 or jump on a leaving train if you wanna be sure not to miss that one.
Targets 3770 - 3990 - 4270 - 4350
Stop loss below 3070
@CryptoTrades #ADX #AdEx

ADX Uptrend lineADX have some upcoming events in next few weeks. This is a good chance for swing trading.
coinmarketcal.com


Adex... A Determined Elongation XtravaganzaDon't know anything about this coin.. charts don't lie... enjoy and goodluck..

ADX/BTC 1D 50% PPADXBTC is currently trying to break out of a consolidation phase which began in AUG last year. This is the second try for a breakout, however, the difference this time (apart from some good upward momentum showing on both the STOCH RSI and RSI EMA Indicators), is that in the 1D chart, the 22EMA has already crossed both the 55 and 100EMA already and heading toward the 200EMA. This should most likely lead to a spike in the price action.
This trade relies on the fact that, on the 4HR chart, ADXBTC will take a drop down to the 100EMA and hit my BUY order sitting at 3426SATS. This is also an area of previous support. It should then bounce from there, back onto the 22EMA as it crosses the 200EMA giving momentum to push up towards the sell Targets.
BUY: 3426
SELL: T1 50% 4023SATS
T2 50% 5110SATS
SL: 3219
This is not trading or financial advice. Always do your own technical analysis before entering any trade and use your own judgement. Trading is risky and can result in financial loss.

AdEx trade ideaExpecting some bearish momentum, because of resistance and bearish divergence on the RSI.
Will look for the 61.8% retrace as ideal entry, just below EQ


ADX/BTC potential spikesADX has a low supply and often pumps with a slight volume increase.
Currently the daily volume is rising and we have already seen a couple of very volatile pumps, i can see a few lines of trend being respected and currently price sitting on a level of demand but has already been it a few times, there is a chance we will fall to the next demand zone but hoping it gets wicked up quickly to stay with in this pitchfork channel.
40%+ push back to the top of the pitchfork but each limit line will be a level of resistance so have your own game plan on how to trade it.
If the current pitchfork trend breaks then i dont see this exact set up working.

Finally it breaks a Strong Resistance_Get ReadyFinally it breaks a Strong Resistance_Get Ready
after a long time ADX breaks out of a strong resistance
'wait for the pullback and a confirmation and then and afrer that you should see a reversal pattern like
engulfing and you can enter the trade in that position


Daily Bullish Signal $ADX #ADX #ADXBTC (10 March 2019)RED ARROW indicates the EXPECTED Time and Targets
Level Stoploss point up to maximize profit and reduce risk
I'm working all the time, even in Bearish Market

SoT 2.0 Chartoff March, Week 2Entry is just a few sats above the hourly level. This hourly level has not yet been tested so enter a little bit above it.
ADX is trying to break out of a valley that started the 1st of March.
Current trend is up. It's laddering up and creating new levels all the time.
Have 2 exits defined which are close to daily levels. These daily levels have been tested already.
Sell 50% at Exit1 and the other 50% at Exit2.

AdxBtc Potential Cup formationHi guys spotted potential Inverse head and shoulder pattern with price moving in typical symmetrical triangle zone, and looking dip into the whole pattern look like typical CUP formation.
Kindly follow the suggested accumulation zone on the chart and always remember to apply stop loss.
Level to watch for are:
POSSIBLE ENTRY ZONE
Possible Support LEVEL
SELL TARGETS
Do know that I appreciate you taking the time to read my posts and Please leave a LIKE and FOLLOW us for more updates.
Thank you


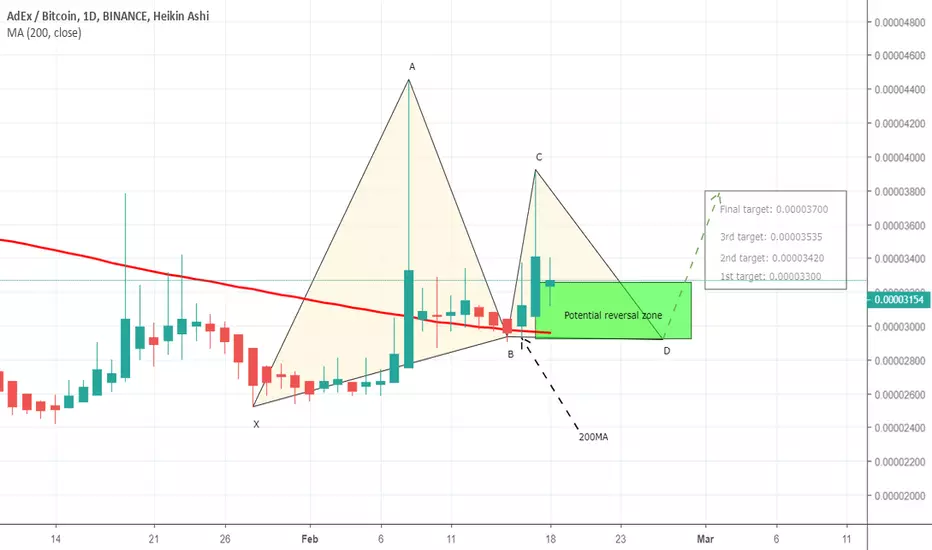
ADXBTC a completion of gartleyBy the grace of Allah the most high my below idea of ADXBTC
generated more than 32 percent profit.
Now the price action is completing the C to D leg of same gartley pattern and almost entered in buying zone.
We have again a 200MA strong support in potential reversal zone which will help in bullish divergence insha Allah.
The targets are defined accordingly plz find on chart.
Regards,
Atif Akbar (moon333)


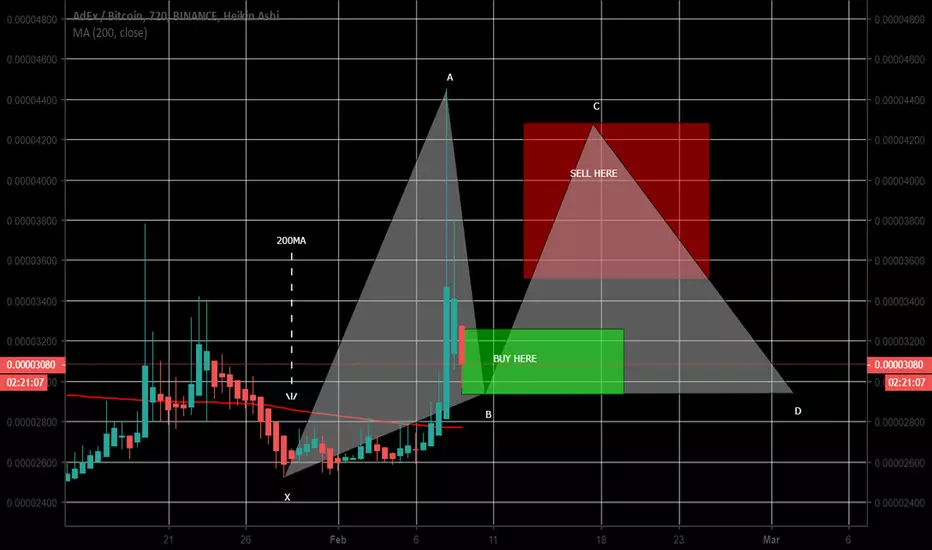
ADXBTC again ready to fill our wallets with money insha AllahThe ADXBTC never disappointed us and every idea gave us massive profits in a very short period of time as my this previous idea:
gave more than 60 percent profit by the grace of Allah the most high.
This time the ADXBTC is again going to form some harmonic.
The 200MA us just beneath the buying area which will provide a firm support to price action for bullish divergence insha Allah.
I have defined the targets on chart plz find.
Regards,
Atif Akbar (moon333)