#ADEX/USDT#ADEX
The price is moving in a descending channel on the 1-hour frame and is expected to continue upward.
We have a trend to stabilize above the 100 moving average once again.
We have a downtrend on the RSI indicator that supports the upward move with a breakout.
We have a support area at the lower boundary of the channel at 0.1006.
Entry price: 0.1050
First target: 0.1066
Second target: 0.1084
Third target: 0.1111
ADXUSDT trade ideas

#ADX/USDT#ADX
The price is moving within a descending channel on the 1-hour frame, adhering well to it, and is heading for a strong breakout and retest.
We are seeing a bounce from the lower boundary of the descending channel, which is support at 0.0914.
We have a downtrend on the RSI indicator that is about to break and retest, supporting the upward trend.
We are looking for stability above the 100 moving average.
Entry price: 0.0935
First target: 0.0951
Second target: 0.0966
Third target: 0.0986

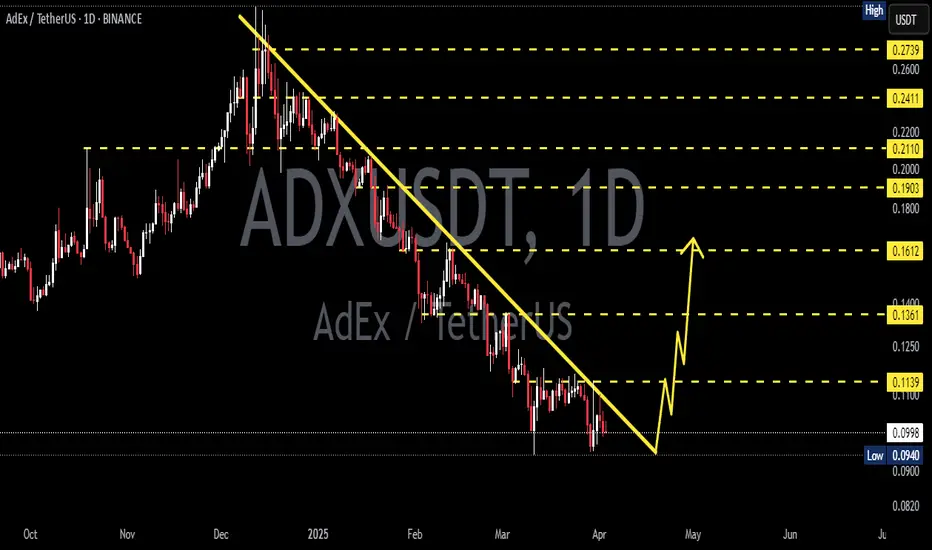
ADXUSDT 1D ADX ~ 1D Analysis
#ADX Buy after successfully penetrating this resistant line with a short -term target of at least 15%+.
AdEx Is Ready To Grow (Long-Term Bullish, Since 2022)AdEx (ADXUSDT) bottomed November 2022, almost two years ago. We've been seeing bullish action within a widening ascending channel. When the upper boundary of the channel is challenged we get a correction; when the lower boundary of the channel is tested we get a bullish wave. There is reason to belief that this pattern will continue to repeat and it is repeating now as ADXUSDT goes bullish.
We have a very strong higher low in August 2024 compared to late 2022. The session that produced the higher low closed as hammer, which signals the end of a tend and thus a reversal. This signal is being confirmed with a full green candle now and a move above local resistance as well as a long-term resistance line.
So the doors are open for growth. The chart is bullish and pointing up. We follow the chart.
Of course, you can find ADXBTC by looking at the 'Related publications' below.
Thank you for reading.
Namaste.

adxusdt idea2 key level to take note. can pursue higher as pass this 2 level.
can sideway few days before move as daily tf setup

ADXThe chart displays AdEx (ADX) paired with USDT on a 1-hour timeframe. The price has experienced a recent breakout from a consolidation range and is currently trading at 0.1818 USDT, just above a previous resistance level. The breakout suggests potential bullish momentum, and if the price sustains above 0.1820, it could signal further upside. A target around 0.2000 USDT is reasonable, while a stop-loss could be placed below 0.1730 USDT to manage downside risk. This setup suggests a favorable risk-to-reward ratio for a long position, but confirmation of momentum is key for entry

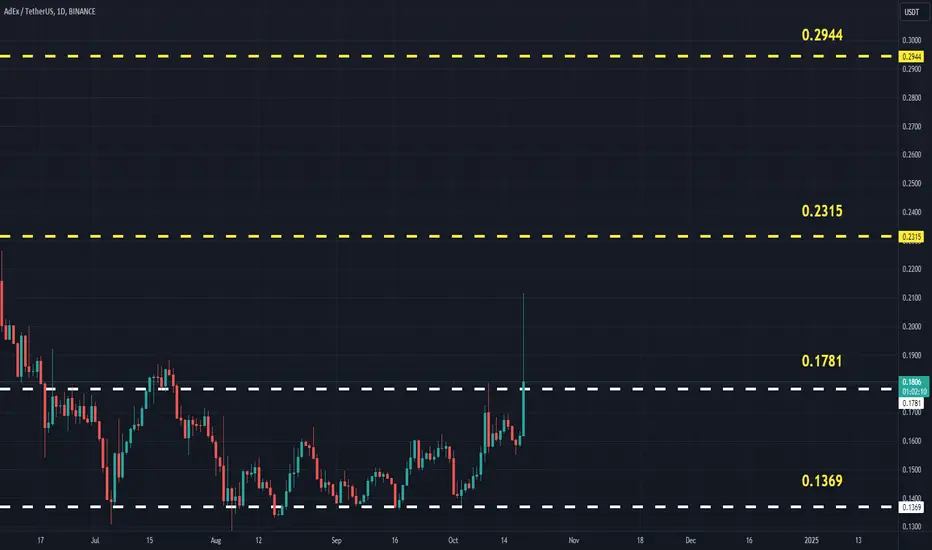
ADXUSDT (AdEx) Updated till 19-10-24ADXUSDT (AdEx) Daily timeframe range. many alts got similar pattern now. from a accumulation zone its trying to get out of its local low. but volume still not there if it can stay above 0.1781 than it got chances to continue.
ADXUSDT LONG IDEAAs with most of my token analyses, we can see a clear accumulation of this asset.
The price fell by 90% and found support. According to such structure as rounding we can say that we are on the way to big growth.
I advise you to have this asset in your portfolio.

AdEx (ADX)After a significant correction of approximately 50%, price action has now confirmed support on past resistance as shown on the above weekly chart. This development suggests a potential reversal is underway, offering an attractive buying opportunity.
In addition to the confirmation of support you will notice price action prints a higher low in tandem with lower low in stochastic RSI. This is hidden bullish divergence. There is no chart pattern to indicate a target.
Is it possible price action may correct further? Sure.
Is it probable? No.
Ww
Type: trade
Risk: <= 2%
Timeframe to act: Days
Return: N/A

ADXUSDT ADXUSDT is in Bullish Trend , making higher high and higher lows.
We can buy on 50% retracement
With confluences of Support , Bullish Trend, Broke MAjor Trendline , ABCD pattern is not completed yet and no Divergence On RSI.

ADXUSDTADXUSDT is in Bullish Trend , making higher high and higher lows.
We can buy on 50% retracement
With confluences of Support , no Divergence and Trend


✴️ AdEx Classic Price Action (Low + Consolidation = Bullish)This is a repeating pattern across the market and between cycles, let's see what we have here.
(1) AdEx (ADXUSDT) goes on to produce a "bottom low" in November 2022 leading to the formation of a consolidation pattern. Afterward a bullish wave develops.
(2) AdEx goes again and hits a correction low ("higher low" on the chart) which starts the formation of a new consolidation pattern.
We can expect a bullish break of this pattern; Once the consolidation is over growth follows, like clockwork.
Namaste.


ADX Lights the Path: Get In on the Buy Action Today## ADX Coin: Short Fundamentals, Recent News, and Disclaimer
**Fundamentals:**
* **AdEx (ADX):** A decentralized advertising protocol aiming to improve transparency and efficiency in online advertising.
* **Launched:** December 2017.
* **Market Cap:** ~$33 million (as of Mar 3, 2024).
* **Rank:** #724 on CoinMarketCap.
* **Unique Features:**
* **Focuses on Web3 advertising:** Connects Web3 projects with potential crypto users.
* **Reduces fees:** Offers lower fees compared to traditional ad platforms.
* **Utilizes blockchain:** Enables transparent and fraud-protected advertising.
**Recent News:**
* **Feb 23, 2024:** AdEx announces integration with fiat and stablecoin deposits for campaign budgets.
* **Feb 15, 2024:** AdEx releases update on its staking program, offering rewards for token holders.
* **Jan 31, 2024:** AdEx participates in industry conferences, raising awareness of its Web3 advertising solutions.
**Disclaimer:**
* This information is for educational purposes only and should not be considered financial advice.
* Cryptocurrency investments are highly volatile and carry significant risks.
* Do your own research before making any investment decisions.
**Additional Notes:**
* ADX price has shown moderate growth in recent weeks, potentially reflecting growing interest in Web3 advertising.
* The recent news highlights AdEx's focus on expanding its user base and functionalities.
* It's crucial to understand the risks involved in cryptocurrency investments before making any decisions.
I hope this information is helpful! Please let me know if you have any other questions.

ADXUSDT 1-Apply your own risk management.
2-Daily and Weekly Targets
3-Hunt the profits at any level you see convenient for you.
4-Raise Often Your SL to protect your profits.
5-Use 5 % Spot
6-Long it With 5 % LEV5
NYSE:ADX Entries on the Chart, SL Daily Close under 0.1586

ADXUSDT IDEAUPDATE
Formation of Falling wedge in 4H TF.
Breakout can take it towards 0.1950$ and above !!!
COIN DETAILS
The live AdEx price today is $0.168949 USD with a 24-hour trading volume of $1,453,445 USD. We update our ADX to USD price in real-time. AdEx is up 0.05% in the last 24 hours.

ADXUSDT - BULLISH OUTLOOKADXUSDT is currently exhibiting a bullish divergence on the 1-hour (1H) time frame, signaling a potential reversal in the prevailing trend. The price has successfully broken above the last lower high and is now establishing higher highs and higher lows, indicative of a likely continuation of the bullish trend.
Here's a concise technical analysis with a suggested trading strategy:
Entry: Consider initiating a long position on a retracement at key Fibonacci levels, specifically targeting the 0.382 or 0.50 Fibonacci retracement levels, with an entry price of around 0.1770.
Stop Loss (SL): Place a stop loss order at 0.1680 to effectively manage risk.
Take Profit (TP): Set take-profit levels to achieve a 1:1 and 1:2 risk-reward ratio:
TP1 = 0.1860
TP2 = 0.1950
This trading strategy is designed to capitalize on the anticipated continuation of the bullish trend, utilizing Fibonacci retracement levels as potential entry points. It's essential to closely monitor the market for any shifts in price dynamics and be prepared to adjust the strategy accordingly


Finally Adx Testing Multi Year Trendlineseems like bottomed out and getting ready for massive recovery
in downtrend from last year now testing trend line in 3 days tf expecting breakout too
incase of successful breakout expecting solid recovery in coming weeks expecting 120 to 140% bullish rally incase of breakout

ADX getting ready For pumpBINANCE:ADXUSDT
shit coins pumping but this one is known for big pumps
I’m smelling a nice jump from here

ADXUSDT - Bullish TrendAs per the recent price action, ADXUSDT is exhibiting a bullish trend. It has successfully broken out from a triangle pattern, indicating a potential continuation of the upward movement.
Moreover, the price is forming higher highs and higher lows, which is a positive sign in technical analysis, suggesting an overall uptrend. This pattern often indicates increasing buying pressure and could imply further price appreciation.
Additionally, the Relative Strength Index (RSI), a popular momentum oscillator, does not show any divergence. This absence of divergence can reinforce the current bullish sentiment, as it suggests that the price trend is supported by solid underlying momentum
Entry Price @ 0.1720
Stop loss @ 0.1590
TP 1 @ 0.1850
TP 2 @ 0.1980
RISK 2%
This is not financial advice. Always do your own research and always put stop loss(SL) on your trade.

ADXUSDT #ADX #CRYPTO Breaking out of the predictable channel?Looks like it could range or breakout of the channel
On watch
