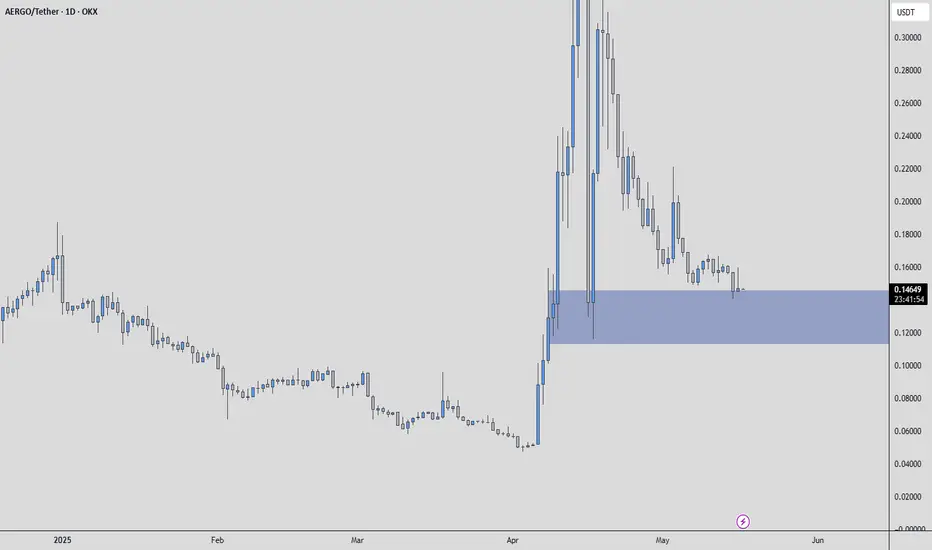
AERGO/USDT +110%AERGO is setting up for a potential breakout after establishing a solid accumulation range. The price action has been consolidating within a tight structure, indicating the sellers are getting exhausted while buyers are silently stepping in.
Entry Zone Green Box
AERGOUSDT trade ideas

AERGO/USDTKey Level Zone: 0.11800 - 0.11880
LMT v1.0 detected.
The setup looks promising—price previously trended upward with rising volume and momentum, then retested this zone cleanly. This presents an excellent reward-to-risk opportunity if momentum continues to align.
Introducing LMT (Levels & Momentum Trading)
- Over the past 3 years, I’ve refined my approach to focus more sharply on the single most important element in any trade: the KEY LEVEL.
- While HMT (High Momentum Trading) served me well—combining trend, momentum, volume, and structure across multiple timeframes—I realized that consistently identifying and respecting these critical price zones is what truly separates good trades from great ones.
- That insight led to the evolution of HMT into LMT – Levels & Momentum Trading.
Why the Change? (From HMT to LMT)
Switching from High Momentum Trading (HMT) to Levels & Momentum Trading (LMT) improves precision, risk control, and confidence by:
- Clearer Entries & Stops: Defined key levels make it easier to plan entries, stop-losses, and position sizing—no more guesswork.
- Better Signal Quality: Momentum is now always checked against a support or resistance zone—if it aligns, it's a stronger setup.
- Improved Reward-to-Risk: All trades are anchored to key levels, making it easier to calculate and manage risk effectively.
- Stronger Confidence: With clear invalidation points beyond key levels, it's easier to trust the plan and stay disciplined—even in tough markets.
Whenever I share a signal, it’s because:
- A high‐probability key level has been identified on a higher timeframe.
- Lower‐timeframe momentum, market structure and volume suggest continuation or reversal is imminent.
- The reward‐to‐risk (based on that key level) meets my criteria for a disciplined entry.
***Please note that conducting a comprehensive analysis on a single timeframe chart can be quite challenging and sometimes confusing. I appreciate your understanding of the effort involved.
Important Note: The Role of Key Levels
- Holding a key level zone: If price respects the key level zone, momentum often carries the trend in the expected direction. That’s when we look to enter, with stop-loss placed just beyond the zone with some buffer.
- Breaking a key level zone: A definitive break signals a potential stop‐out for trend traders. For reversal traders, it’s a cue to consider switching direction—price often retests broken zones as new support or resistance.
My Trading Rules (Unchanged)
Risk Management
- Maximum risk per trade: 2.5%
- Leverage: 5x
Exit Strategy / Profit Taking
- Sell at least 70% on the 3rd wave up (LTF Wave 5).
- Typically sell 50% during a high‐volume spike.
- Move stop‐loss to breakeven once the trade achieves a 1.5:1 R:R.
- Exit at breakeven if momentum fades or divergence appears.
The market is highly dynamic and constantly changing. LMT signals and target profit (TP) levels are based on the current price and movement, but market conditions can shift instantly, so it is crucial to remain adaptable and follow the market's movement.
If you find this signal/analysis meaningful, kindly like and share it.
Thank you for your support~
Sharing this with love!
From HMT to LMT: A Brief Version History
HM Signal :
Date: 17/08/2023
- Early concept identifying high momentum pullbacks within strong uptrends
- Triggered after a prior wave up with rising volume and momentum
- Focused on healthy retracements into support for optimal reward-to-risk setups
HMT v1.0:
Date: 18/10/2024
- Initial release of the High Momentum Trading framework
- Combined multi-timeframe trend, volume, and momentum analysis.
- Focused on identifying strong trending moves high momentum
HMT v2.0:
Date: 17/12/2024
- Major update to the Momentum indicator
- Reduced false signals from inaccurate momentum detection
- New screener with improved accuracy and fewer signals
HMT v3.0:
Date: 23/12/2024
- Added liquidity factor to enhance trend continuation
- Improved potential for momentum-based plays
- Increased winning probability by reducing entries during peaks
HMT v3.1:
Date: 31/12/2024
- Enhanced entry confirmation for improved reward-to-risk ratios
HMT v4.0:
Date: 05/01/2025
- Incorporated buying and selling pressure in lower timeframes to enhance the probability of trending moves while optimizing entry timing and scaling
HMT v4.1:
Date: 06/01/2025
- Enhanced take-profit (TP) target by incorporating market structure analysis
HMT v5 :
Date: 23/01/2025
- Refined wave analysis for trending conditions
- Incorporated lower timeframe (LTF) momentum to strengthen trend reliability
- Re-aligned and re-balanced entry conditions for improved accuracy
HMT v6 :
Date : 15/02/2025
- Integrated strong accumulation activity into in-depth wave analysis
HMT v7 :
Date : 20/03/2025
- Refined wave analysis along with accumulation and market sentiment
HMT v8 :
Date : 16/04/2025
- Fully restructured strategy logic
HMT v8.1 :
Date : 18/04/2025
- Refined Take Profit (TP) logic to be more conservative for improved win consistency
LMT v1.0 :
Date : 06/06/2025
- Rebranded to emphasize key levels + momentum as the core framework

AERGO/USDT for weekend AERGO/USDT for a short-term weekend trade with a high-risk/high-reward profile. The chart is showing potential for a breakout move, supported by recent volume upticks and technical structure forming a bullish continuation pattern.
upside: 30–40% from current levels if momentum sustains.
Buy Entry : green DCA box
🎯 Targets:
TP#1: $0.18
TP#2: $0.21
TP#3: $0.23
SL: $0.15
This is a high-risk weekend trade idea

Bullish flag, will it continue to go up?will it return to the high or make a new high? There are two patterns visible on this trendline, such as bullish flag, bullish falling wedge, will it continue to occur to reach a new ATH?

AERGO/USDT – Blue Box Support… But BewareAERGO’s been carving out a zone that looks like a textbook demand area—our blue box. It’s tempting to jump in as soon as price drifts down there, but there’s a real chance it doesn’t hold. That’s why moving without proof is a fast track to getting stopped out.
Here’s what needs to happen before you pull the trigger:
Volume + CDV confirmation: Price dips into the blue box, then you see a clear surge in traded volume that lines up with a bullish CDV divergence—smart money quietly stepping in.
Low-timeframe break & reclaim: On your one- or five-minute chart, watch for a quick break below the box followed by an aggressive reclaim. That flip in order flow is your green light.
Order flow shift: Watch for bids eating through offers, not just a wick. That tells you buyers are serious.
“I will not insist on my short idea. If the levels suddenly break upwards and do not give a downward break in the low time frame, I will not evaluate it. If they break upwards with volume and give a retest, I will look long.”
I’ve seen setups like this crumble when traders act on hope instead of signals. If you buy early and it snaps through, chasing feels a lot worse than waiting. But if you wait for the trifecta—volume, CDV, and that clean break-retest—you’ll be in position when AERGO decides to rip.
🧠 Miss the confirmation and you might regret sitting on the sidelines… jump in too soon and you’ll regret taking the hit.
Keep your eyes locked on that blue box. When those confirmation elements align, that’s your moment. Otherwise, patience wins again.
📌I keep my charts clean and simple because I believe clarity leads to better decisions.
📌My approach is built on years of experience and a solid track record. I don’t claim to know it all but I’m confident in my ability to spot high-probability setups.
📌If you would like to learn how to use the heatmap, cumulative volume delta and volume footprint techniques that I use below to determine very accurate demand regions, you can send me a private message. I help anyone who wants it completely free of charge.
🔑I have a long list of my proven technique below:
🎯 ZENUSDT.P: Patience & Profitability | %230 Reaction from the Sniper Entry
🐶 DOGEUSDT.P: Next Move
🎨 RENDERUSDT.P: Opportunity of the Month
💎 ETHUSDT.P: Where to Retrace
🟢 BNBUSDT.P: Potential Surge
📊 BTC Dominance: Reaction Zone
🌊 WAVESUSDT.P: Demand Zone Potential
🟣 UNIUSDT.P: Long-Term Trade
🔵 XRPUSDT.P: Entry Zones
🔗 LINKUSDT.P: Follow The River
📈 BTCUSDT.P: Two Key Demand Zones
🟩 POLUSDT: Bullish Momentum
🌟 PENDLEUSDT.P: Where Opportunity Meets Precision
🔥 BTCUSDT.P: Liquidation of Highly Leveraged Longs
🌊 SOLUSDT.P: SOL's Dip - Your Opportunity
🐸 1000PEPEUSDT.P: Prime Bounce Zone Unlocked
🚀 ETHUSDT.P: Set to Explode - Don't Miss This Game Changer
🤖 IQUSDT: Smart Plan
⚡️ PONDUSDT: A Trade Not Taken Is Better Than a Losing One
💼 STMXUSDT: 2 Buying Areas
🐢 TURBOUSDT: Buy Zones and Buyer Presence
🌍 ICPUSDT.P: Massive Upside Potential | Check the Trade Update For Seeing Results
🟠 IDEXUSDT: Spot Buy Area | %26 Profit if You Trade with MSB
📌 USUALUSDT: Buyers Are Active + %70 Profit in Total
🌟 FORTHUSDT: Sniper Entry +%26 Reaction
🐳 QKCUSDT: Sniper Entry +%57 Reaction
📊 BTC.D: Retest of Key Area Highly Likely
📊 XNOUSDT %80 Reaction with a Simple Blue Box!
📊 BELUSDT Amazing %120 Reaction!
📊 Simple Red Box, Extraordinary Results
I stopped adding to the list because it's kinda tiring to add 5-10 charts in every move but you can check my profile and see that it goes on..

AERGO Structure Has Turned Bullish (1W)After 1428 days, AERGO has powerfully reclaimed a major zone. In addition to reclaiming this area with strength, it has swept the liquidity pool, meaning there are no more liquidity magnets left below the chart.
It has also completed its core CH (Change of Character) and cleared an important zone.
Considering the time range it has spent in correction, we have identified the targets on the chart.
We are looking for a buy around the green zone.
A weekly candle closing below the invalidation level will invalidate this analysis.
For risk management, please don't forget stop loss and capital management
When we reach the first target, save some profit and then change the stop to entry
Comment if you have any questions
Thank You

AERGO/USDT Analysis – 2 Strong Buying Zones
For this futures pair, we are approaching zones where abnormal buyer aggression was previously recorded.
If we test the $0.23–$0.205 or $0.185–$0.153 zones and see a reaction from buyers, we could see a strong upward move, potentially reaching at least the $0.30 level.

AERGO Crashes 61% After Binance Futures Listing Aergo (AERGO) saw a dramatic price crash on April 16, falling by 61.32% within 24 hours to $0.1590, despite high trading activity. The sharp drop followed Binance’s launch of the AERGOUSDT Perpetual Futures Contract, which allows trading with up to 15x leverage. The contract went live at 11:00 UTC.
Before this event, Aergo had reached a recent all-time high close to $0.76, marking strong bullish momentum. However, the futures launch triggered heightened volatility, leading to a swift decline in market price shortly after trading opened.
Currently, Aergo’s market capitalization stands at $75.95 million, while its fully diluted valuation (FDV) is $79.61 million. The 24-hour trading volume has skyrocketed to $1.56 billion, reflecting a 204.66% increase, with a volume-to-market cap ratio of 2060.24% — signaling extremely high turnover. The token’s circulating supply is 477.49 million AERGO, with a total and max supply capped at 500 million AERGO. Holders of the asset currently number 7.65K.
Aergo is a hybrid enterprise blockchain platform built by Blocko, a Samsung-backed South Korean firm. The platform enables SQL-compatible smart contracts and supports both public and private blockchain systems. It has seen adoption by major institutions such as Hyundai Motors and the Korea Exchange.
Following its high, near $0.76, Aergo's price broke down sharply. It currently hovers around $0.1596. With the RSI close to oversold territory, traders may look for stabilization before any potential bounce.


AERGO: Golden Pocket Hit – Crash Incoming?On April 3rd, AERGO hit a historic low of $0.04746—and just 13 days later, it's trading around $0.60, an astonishing +1500% surge in less than two weeks. The rapid rise begs the question: What are the bulls aiming for next, and how sustainable is this move?
Key Observations:
Explosive Rally:
AERGO’s meteoric move from $0.04746 to $0.70 in just 13 days has propelled the coin into uncharted territory. Such a dramatic spike is not only eye-catching but also raises concerns about overextension.
RSI Overbought:
The daily RSI sits at 98, indicating extreme overbought conditions. This level suggests that the current rally is unsustainable and may be ripe for a pullback.
Historical Resistance Levels:
Looking back at 2021, key highs were established around $0.60 to $0.62. These levels serve as critical resistance zones.
Fibonacci Confluence:
Taking the Fibonacci retracement from the low at $0.04746 to the previous rally's high at $1.0809 (April 13, 2024), the 0.618 level is projected at $0.68613. The bulls just tested that golden pocket.
Trade Strategy & Potential Setups:
For Longs:
With the market showing signs of being overbought (RSI at 98) and the explosive move possibly winding down, this may be the perfect opportunity to take profits rather than accumulate further.
Take Profit Consideration:
Target: Near the 0.618 fib retracement at $0.68613.
Observation: If bulls push beyond this level, the move might extend — however, the risk of a sharp pullback is high given current overbought conditions.
For Shorts:
A corrective move is very much on the table, and traders looking to short should focus on the key resistance zone between $0.60 and $0.70.
Short Setup:
Entry: Look to initiate shorts near the $0.60–$0.70 zone.
Target: $0.4 and $0.2 as take profit targets
The Big Question:
Will AERGO drop as sharply as it surged? Given the extreme overbought conditions and the rapid, unsustainable spike, a healthy—and perhaps brutal—correction seems very possible. Keep a close eye on volume and price action near the $0.60–$0.70 resistance zone and be ready to adjust positions accordingly.
Anyone riding this wave has experienced one of the wildest moves in recent memory. For those in long positions, consider taking profits now; for potential short traders, watch those key levels tightly. The market's rhythm will soon reveal its next chapter.

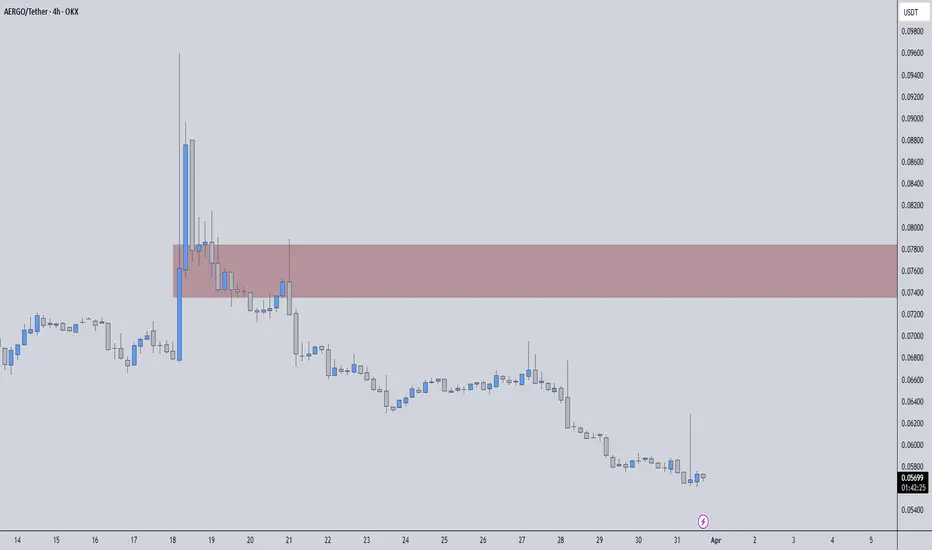
Aergo price analysis The #Aergo coin is “old” from 2019, and its capitalization is only 59 million, and that's after a few days of 200%+ pumping from Korean exchange users in a falling market.
🟡 At the current price, of course, it's not worth buying OKX:AERGOUSDT , but why not keep an eye on it.
🟢 If the price is kept above the buying zone - $0.075 - $0.087, then the pump can easily be extended, at least to $0.30 - $0.32 (potentially modest x4, or maybe not)
🔴 Below this zone, in our opinion, it is dangerous to buy, because there will be weakness of buyers and the price of #Aergo has a place to fall.
_____________________
Did you like our analysis? Leave a comment, like, and follow to get more

LIMIT ORDER - #AERGO/USDTLIMIT ORDER - $AERGO/USDT
Direction: #Short 🔴
Entry Price: 0.12943
Stop Loss: 0.15096
Target 1: 0.11975
Target 2: 0.11007
Target 3: 0.10039
Target 4: 0.090713
Target 5: 0.081033
Waiting till hits Target 2, changing SL to entry price

AERGO is in a counter-trend rally. Hunting for liquidityA sudden bullish rally amid a one-day influx of huge volume.
Hunting for liquidity located in the double top zone. This situation in 99% of cases ends with a false breakout and reversal
Countertrend rally to the resistance zone on the background of a bearish cryptocurrency market
Scenario: false breakout of resistance 0.1721 - 0.1886
There is no potential for continuation of the movement
It is impossible to buy such movements due to the lack of security and a huge level of risk.

AERGOUSDT | Critical Resistance Zone AheadThe price is weak. Now, we are approaching the red box, a well-defined resistance zone where I will be watching closely for my usual short confirmations.
🔴 Key Observations:
✔️ Red Box = Strong Resistance – This level has historically been difficult to break, and I expect sellers to step in here.
✔️ No Need to Chase – If the price breaks upwards without giving a proper confirmation, I won’t force a short.
✔️ LTF Confirmations Are Everything – The smartest move is waiting for a breakdown with CDV alignment before taking action.
🔥 How to Approach This Trade:
🔹 If the price rejects the red box, I will evaluate shorts with confirmation.
🔹 If we break above with volume and retest, I might consider looking long.
🔹 As always, I stick to my rules, and that’s why my success rate speaks for itself.
Most traders get caught in emotional decisions, but I stay ahead because I focus on data, structure, and discipline. That’s why people follow me—because I deliver real results. Stay sharp and trade smart!
I keep my charts clean and simple because I believe clarity leads to better decisions.
My approach is built on years of experience and a solid track record. I don’t claim to know it all, but I’m confident in my ability to spot high-probability setups.
If you would like to learn how to use the heatmap, cumulative volume delta and volume footprint techniques that I use below to determine very accurate demand regions, you can send me a private message. I help anyone who wants it completely free of charge.
I have a long list of my proven technique below:
🎯 ZENUSDT.P: Patience & Profitability | %230 Reaction from the Sniper Entry
🐶 DOGEUSDT.P: Next Move
🎨 RENDERUSDT.P: Opportunity of the Month
💎 ETHUSDT.P: Where to Retrace
🟢 BNBUSDT.P: Potential Surge
📊 BTC Dominance: Reaction Zone
🌊 WAVESUSDT.P: Demand Zone Potential
🟣 UNIUSDT.P: Long-Term Trade
🔵 XRPUSDT.P: Entry Zones
🔗 LINKUSDT.P: Follow The River
📈 BTCUSDT.P: Two Key Demand Zones
🟩 POLUSDT: Bullish Momentum
🌟 PENDLEUSDT.P: Where Opportunity Meets Precision
🔥 BTCUSDT.P: Liquidation of Highly Leveraged Longs
🌊 SOLUSDT.P: SOL's Dip - Your Opportunity
🐸 1000PEPEUSDT.P: Prime Bounce Zone Unlocked
🚀 ETHUSDT.P: Set to Explode - Don't Miss This Game Changer
🤖 IQUSDT: Smart Plan
⚡️ PONDUSDT: A Trade Not Taken Is Better Than a Losing One
💼 STMXUSDT: 2 Buying Areas
🐢 TURBOUSDT: Buy Zones and Buyer Presence
🌍 ICPUSDT.P: Massive Upside Potential | Check the Trade Update For Seeing Results
🟠 IDEXUSDT: Spot Buy Area | %26 Profit if You Trade with MSB
📌 USUALUSDT: Buyers Are Active + %70 Profit in Total
🌟 FORTHUSDT: Sniper Entry +%26 Reaction
🐳 QKCUSDT: Sniper Entry +%57 Reaction
📊 BTC.D: Retest of Key Area Highly Likely
I stopped adding to the list because it's kinda tiring to add 5-10 charts in every move but you can check my profile and see that it goes on..
A tiny part of my runners;
🌊 WAVESUSDT.P: Demand Zone Potential
🟣 UNIUSDT.P: Long-Term Trade
🔵 XRPUSDT.P: Entry Zones
🔗 LINKUSDT.P: Follow The River
📈 BTCUSDT.P: Two Key Demand Zones
A tiny part of my runners;
💼 STMXUSDT: 2 Buying Areas
🐢 TURBOUSDT: Buy Zones and Buyer Presence
🌍 ICPUSDT.P: Massive Upside Potential | Check the Trade Update For Seeing Results
🟠 IDEXUSDT: Spot Buy Area | %26 Profit if You Trade with MSB
📌 USUALUSDT: Buyers Are Active + %70 Profit in Total
🌟 FORTHUSDT: Sniper Entry +%26 Reaction
🐳 QKCUSDT: Sniper Entry +%57 Reaction
j
📌I keep my charts clean and simple because I believe clarity leads to better decisions.
📌My approach is built on years of experience and a solid track record. I don’t claim to know it all but I’m confident in my ability to spot high-probability setups.
📌If you would like to learn how to use the heatmap, cumulative volume delta and volume footprint techniques that I use below to determine very accurate demand regions, you can send me a private message. I help anyone who wants it completely free of charge.
🔑I have a long list of my proven technique below:
🎯 ZENUSDT.P: Patience & Profitability | %230 Reaction from the Sniper Entry
🐶 DOGEUSDT.P: Next Move
🎨 RENDERUSDT.P: Opportunity of the Month
💎 ETHUSDT.P: Where to Retrace
🟢 BNBUSDT.P: Potential Surge
📊 BTC Dominance: Reaction Zone
🌊 WAVESUSDT.P: Demand Zone Potential
🟣 UNIUSDT.P: Long-Term Trade
🔵 XRPUSDT.P: Entry Zones
🔗 LINKUSDT.P: Follow The River
📈 BTCUSDT.P: Two Key Demand Zones
🟩 POLUSDT: Bullish Momentum
🌟 PENDLEUSDT.P: Where Opportunity Meets Precision
🔥 BTCUSDT.P: Liquidation of Highly Leveraged Longs
🌊 SOLUSDT.P: SOL's Dip - Your Opportunity
🐸 1000PEPEUSDT.P: Prime Bounce Zone Unlocked
🚀 ETHUSDT.P: Set to Explode - Don't Miss This Game Changer
🤖 IQUSDT: Smart Plan
⚡️ PONDUSDT: A Trade Not Taken Is Better Than a Losing One
💼 STMXUSDT: 2 Buying Areas
🐢 TURBOUSDT: Buy Zones and Buyer Presence
🌍 ICPUSDT.P: Massive Upside Potential | Check the Trade Update For Seeing Results
🟠 IDEXUSDT: Spot Buy Area | %26 Profit if You Trade with MSB
📌 USUALUSDT: Buyers Are Active + %70 Profit in Total
🌟 FORTHUSDT: Sniper Entry +%26 Reaction
🐳 QKCUSDT: Sniper Entry +%57 Reaction
📊 BTC.D: Retest of Key Area Highly Likely
📊 XNOUSDT %80 Reaction with a Simple Blue Box!
📊 BELUSDT Amazing %120 Reaction!
I stopped adding to the list because it's kinda tiring to add 5-10 charts in every move but you can check my profile and see that it goes on..
AERGO/USDTKey Level Zone : 0.1233 - 0.1240
HMT v4.1 detected. The setup looks promising, supported by a previous upward/downward trend with increasing volume and momentum, presenting an excellent reward-to-risk opportunity.
HMT (High Momentum Trending):
HMT is based on trend, momentum, volume, and market structure across multiple timeframes. It highlights setups with strong potential for upward movement and higher rewards.
Whenever I spot a signal for my own trading, I’ll share it. Please note that conducting a comprehensive analysis on a single timeframe chart can be quite challenging and sometimes confusing. I appreciate your understanding of the effort involved.
Important Note :
Role of Key Levels:
- These zones are critical for analyzing price trends. If the key level zone holds, the price may continue trending in the expected direction. However, momentum may increase or decrease based on subsequent patterns.
- Breakouts: If the key level zone breaks, it signals a stop-out. For reversal traders, this presents an opportunity to consider switching direction, as the price often retests these zones, which may act as strong support-turned-resistance (or vice versa).
My Trading Rules
Risk Management
- Maximum risk per trade: 2.5%.
- Leverage: 5x.
Exit Strategy
Profit-Taking:
- Sell at least 70% on the 3rd wave up (LTF Wave 5).
- Typically, sell 50% during a high-volume spike.
- Adjust stop-loss to breakeven once the trade achieves a 1.5:1 reward-to-risk ratio.
- If the market shows signs of losing momentum or divergence, ill will exit at breakeven.
The market is highly dynamic and constantly changing. HMT signals and target profit (TP) levels are based on the current price and movement, but market conditions can shift instantly, so it is crucial to remain adaptable and follow the market's movement.
If you find this signal/analysis meaningful, kindly like and share it.
Thank you for your support~
Sharing this with love!
HMT v2.0:
- Major update to the Momentum indicator
- Reduced false signals from inaccurate momentum detection
- New screener with improved accuracy and fewer signals
HMT v3.0:
- Added liquidity factor to enhance trend continuation
- Improved potential for momentum-based plays
- Increased winning probability by reducing entries during peaks
HMT v3.1:
- Enhanced entry confirmation for improved reward-to-risk ratios
HMT v4.0:
- Incorporated buying and selling pressure in lower timeframes to enhance the probability of trending moves while optimizing entry timing and scaling
HMT v4.1:
- Enhanced take-profit (TP) target by incorporating market structure analysis

AERGOUSDT Analysis: Only the Best Trades, Believe MeListen, folks, sometimes a trade not taken is better than a losing one . Believe me, I know winners, and this blue box? It’s a fantastic demand zone , one of the best out there. Smart traders wait for the right moment—patience is key.
Here’s the Deal:
Smart Moves Only: Don’t be hasty, don’t lose. Focus on great setups.
The Blue Box: It’s incredible, carefully chosen, and full of potential.
Top-Tier Confirmations: I use CDV, liquidity heatmaps, volume profiles, and volume footprints. The best tools, the greatest techniques, all to make sure it’s the right trade.
Learn From the Best: If you want to dominate like a pro, I can teach you how to use CDV, liquidity heatmaps, volume profiles, and volume footprints . Just DM me. You’ll be learning from the best, believe me.
Remember: Great trades come from great levels. No rushing, no losing—only winning.
If this analysis helps you, boost it, comment, share it with everyone you know. Let’s make trading great again. Success is waiting, folks!
Let me tell you, folks, this is amazing. Nobody does analysis like I do. Believe me. If this helps you, don't forget to boost and comment! It’s a big deal, motivates me to share even more winning insights with you. Tremendous insights.
I keep my charts the best—clean, simple, and clear. You know it, I know it, clarity leads to better decisions. No question about it. My approach? Built on years of tremendous experience. Incredible track record. I don’t claim to know it all, but I spot high-probability setups like nobody else. Trust me.
Want to learn how to use the heatmap, cumulative volume delta, and volume footprint techniques I use to determine demand regions with stunning accuracy? Send me a private message—totally free, folks. That’s right. I help anyone who wants it, absolutely no charge. Unbelievable value.
Here’s the list—long list, great list—of some of my previous incredible analyses. Each one, a winner:
🎯 ZENUSDT.P: Patience & Profitability | %230 Reaction from the Sniper Entry
🐶 DOGEUSDT.P: Next Move
🎨 RENDERUSDT.P: Opportunity of the Month
💎 ETHUSDT.P: Where to Retrace
🟢 BNBUSDT.P: Potential Surge
📊 BTC Dominance: Reaction Zone
🌊 WAVESUSDT.P: Demand Zone Potential
🟣 UNIUSDT.P: Long-Term Trade
🔵 XRPUSDT.P: Entry Zones
🔗 LINKUSDT.P: Follow The River
📈 BTCUSDT.P: Two Key Demand Zones
🟩 POLUSDT: Bullish Momentum
🌟 PENDLEUSDT.P: Where Opportunity Meets Precision
🔥 BTCUSDT.P: Liquidation of Highly Leveraged Longs
🌊 SOLUSDT.P: SOL's Dip - Your Opportunity
🐸 1000PEPEUSDT.P: Prime Bounce Zone Unlocked
🚀 ETHUSDT.P: Set to Explode - Don't Miss This Game Changer
🤖 IQUSDT: Smart Plan
⚡️ PONDUSDT: A Trade Not Taken Is Better Than a Losing One
💼 STMXUSDT: 2 Buying Areas
🐢 TURBOUSDT: Buy Zones and Buyer Presence
🌍 ICPUSDT.P: Massive Upside Potential | Check the Trade Update For Seeing Results
🟠 IDEXUSDT: Spot Buy Area | %26 Profit if You Trade with MSB
📌 USUALUSDT: Buyers Are Active + %70 Profit in Total
🌟 FORTHUSDT: Sniper Entry +%26 Reaction
🐳 QKCUSDT: Sniper Entry +%57 Reaction
📊 BTC.D: Retest of Key Area Highly Likely
And that’s just the start. The list goes on and on, folks. It’s a tremendous list, the best. I stopped adding because, frankly, it’s tiring. So many wins. People are amazed. You can check my profile and see for yourself—winning moves, all the time. Believe me, nobody does it better.

#AERGO (SPOT) entry range (0.0800- 0.0920) T.(0.1799) SL(0.0755)BINANCE:AERGOUSDT
entry range (0.0800- 0.0920)
Target1 (0.1399)- Target2 (0.1799)
SL .1D close below (0.0755)
*** Collect slowly in the entry range ****
**** #Manta ,#OMNI, #DYM, #AI, #IO, #XAI , #ACE #NFP #RAD #WLD #ORDI #BLUR #SUI #Voxel #AEVO #VITE #APE #RDNT #FLUX #NMR #VANRY #TRB #HBAR #DGB #XEC #ERN #ALT #IO #ACA #HIVE #ASTR #ARDR #PIXEL #LTO #AERGO ****

Aergo Looks Super-Long-Term-Ready (344% - 578% Potential)Recent price action for Aergo produced a new All-Time Low. The action in early August 2024. The long-term support range that held prices in mid/late 2022, mid/late 2023 was broken but a recovery is already in place. So AERGOUSDT moved below a long-term support and is now back above this level, with full green weekly candles as well as rising volume. Strong bullish signals.
The chart above clearly depicts what I have just written.
The bottom is likely in and we can prepare for long-term growth. That is, higher highs and higher lows.
New All-Time Highs are possible in 2025 as with all other major, minor and strong pairs. Cryptocurrencies are about to go mainstream and 2025 will be the year that will produce the biggest number of Crypto-millionaires.
Prepare for the best, hope for something great.
Namaste.

AERGOAergo is travelling in an uptrend.
A long entry can be taken from
Entry : 0.1050
TP1: 0.11
Tp2 : 0.1150
Stoploss : 0.1020
Keep following for more

AERGO look good to go up Till Now 4 WIN 3 LOSSAERGO look good to go up
TP 1:1
entry 0.1127
SL 0.1054


AERGOUSDTWe can attempt to buy AERGOUSDT from specified level as it make HL , also there is no bearish divergence occur indicate that it moves upward.
SL , TP mention in chart.
