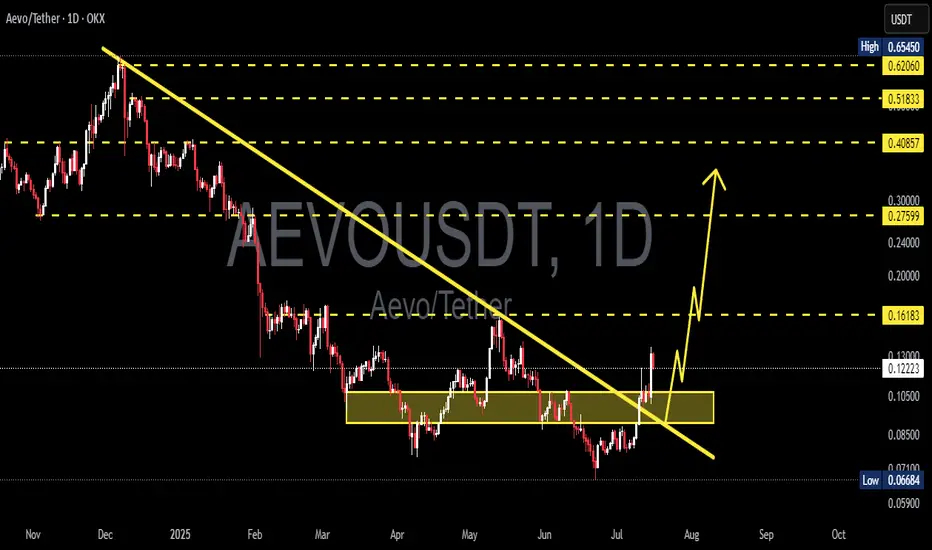
AEVO/USDT – Major Trendline Breakout! Is This the Beginning?🔍 Chart Overview & Pattern Analysis
The AEVO/USDT daily chart reveals a significant breakout from a long-term descending trendline that has been intact since November 2024. This trendline acted as a strong dynamic resistance, suppressing every bullish attempt—until now.
A clear multi-month accumulation zone is visible between $0.080 – $0.105 (highlighted in yellow). Price tested this support zone multiple times, forming a strong base of demand. The combination of horizontal support and descending resistance creates a classic descending triangle breakout, often signaling a trend reversal when broken to the upside.
What's more, price action recently:
Broke above the trendline with strong bullish candles
Retested the breakout zone successfully
Is now forming a potential bullish continuation structure (mini bull flag or pennant)
This structure suggests that the bulls are not done yet—and momentum could be accelerating.
🟢 Bullish Scenario – The Path to Higher Highs
If AEVO continues to hold above the breakout zone, the following upside targets become very realistic:
✅ Target 1: $0.16183 – Previous resistance zone, short-term TP.
✅ Target 2: $0.27599 – Key horizontal resistance from late Q1 2025.
✅ Target 3: $0.40857 – Weekly structure resistance.
✅ Target 4: $0.51833 – Bullish extension zone.
🎯 Ultimate Bull Target: $0.62660 – Full recovery to pre-downtrend levels.
Confluence factors supporting this bullish outlook:
Breakout above dynamic and static resistances
Accumulation breakout after long consolidation
Higher low and bullish retest pattern
Bullish momentum building with volume confirmation (volume not shown but implied)
🔴 Bearish Scenario – Key Levels to Watch
In case of a false breakout or macro weakness:
Breakdown below $0.105 could invalidate the bullish structure
Price could revisit $0.080 or even $0.06684 (last line of defense)
A daily close below this zone would shift the bias back to bearish or neutral
However, as long as price stays above the yellow support box, the bullish thesis remains valid.
---
🧠 Key Technical Highlights
Pattern: Descending Triangle Breakout + Accumulation Base
Trend Shift: From Bearish to Bullish (confirmed with breakout + retest)
Momentum: Building up toward higher time frame resistances
Market Psychology: Smart money likely accumulated during sideways chop
📣 Final Thoughts
AEVO/USDT is showing one of the cleanest breakout structures in the altcoin space right now. With clear upside targets, a retested breakout zone, and strengthening market structure, this could be the early phase of a major bullish leg.
Traders and investors should watch for confirmation of higher highs and pullbacks to the $0.105 zone for potential entries.
#AEVOUSDT #CryptoBreakout #TrendReversal #AltseasonReady #DescendingTriangle #CryptoTA #BullishCrypto #AltcoinAnalysis #TechnicalBreakout #AEVOAnalysis
AEVOUSDT trade ideas
AEVO double bottom 250%AEVO/USDT has seen a ~98% drop from its all-time high, now potentially forming a double bottom pattern in the current accumulation zone. This structure, combined with flattening volume and emerging bullish divergence, suggests a possible trend reversal in the making.
Buy Setup :Risk/Reward :9
Entry Zone : $0.076 – $0.095 green box
TP1: $0.18
TP2: $0.25
TP3: $0.32
Stop Loss: $0.064

AEVO Main Trend DEX L2 Listing 212 X !) Decrease -98% 06 25Logarithm. Term 3 days.
Asset super hype in the past, listing with overly positive and aggressive marketing at 212X!
1️⃣Q1 2023 Private Seed $0.0185 / $1.85 million
2️⃣10 05 2023 Private Series A $0.13 / $6.01 million
3️⃣Q4 2023 Private Series A+ $0.25 / $8.75 million
4️⃣13 03 2024 Listing on the Binance exchange on the day of the secondary market trend reversal (I missed it, and it happens).
26 06 2025 now -98% decline after listing, which is 4.2X from the last prices of scammers, who gradually distributed, maintaining liquidity and the news background all this time their huge profit. Most of the coins are redistributed. You can think about collecting in this sideways, on a breakout of a local wedge (local trend), or on a breakout of a descending channel (reversal of the main trend).
Those who are far from trading can buy in equal parts (3 parts). From the position of the main trend and potential, the prices are now acceptable (you can buy the first part), so to speak (former "hype investors" are in wild horror).
Exit zones will be zones of previous consolidation, that is, those who previously bought on the hype will not be able to make a profit. In fact, it is always like this ... There are no “passengers”, then they will pump up well. As a rule, +800-1000% such assets of the previous excitement and such liquidity.
Local reversal zone.

AEVO/USDT — A Classic Altcoin Bottom Structure🧠 Context:
Another chart showing a typical altcoin structure near the bottom. Price has dropped over 98% from the all-time high. The concept of a "bottom" here is highly abstract — risk remains elevated, and liquidity is thin.
📉 Chart Highlights:
▪️ Price is still moving within a descending channel
▪️ A potential double bottom or dragon pattern is forming
▪️ The 0.0833 level is a key zone to watch
📈 Potential Move:
If the 0.0833 area holds, we may see a push toward the upper boundary of the channel.
Due to thin order books, any move could be impulsive and fast.
⚠️ Note:
This is still a weak market structure.
The idea is speculative — focus on price reaction rather than prediction.

What's coming up for AEVO?Aevo has to break $0.13-14. If its bullish enough to break $0.16 it may also break the resistance line and we can expect $0.25 short-term and higher targets like $0.50 in the long run.
But
If its bearish and fails at breaking the resistance the price can fall back to $0.07 or even $0.04 in the worst case scenario. However it is likely that we see another attemp for breaking $0.14 after the price reaches $0.07.


#AEVO/USDT#AEVO
The price is moving in a descending channel on the 1-hour frame and is expected to continue upwards
We have a trend to stabilize above the moving average 100 again
We have a descending trend on the RSI indicator that supports the rise by breaking it upwards
We have a support area at the lower limit of the channel at a price of 0.3595
Entry price 0.3624
First target 0.3856
Second target 0.3856
Third target 0.3976

#AEVO/USDT#AEVO
The price is moving within a descending channel on the 1-hour frame and is expected to continue lower.
We have a trend to stabilize below the 100 moving average once again.
We have a downtrend on the RSI indicator, supporting the upward move with a break above it.
We have a resistance area at the upper limit of the channel at 0.1100.
Entry price: 0.1093
First target: 0.1079
Second target: 0.1069
Third target: 0.1057

AEVOUSDT WEEKLY MID-TERM TRADEI've been monitoring this coin on a weekly chart for a couple of months and we can see that AEVO seems to have finished its downtrend and bottomed out to start the next accumulation phase . So I'll be adding some AEVO at these lows prices to my SPOT portfolio.
This is a Mid-term trade for the next 1-2 months (NOV-DEC)
Entry $0.30 - $0.35
Target $0.60 - $0.75 - $1.00

AEVO/USDTKey Level Zone: 0.1250-0.1270
HMT v7 detected. The setup looks promising, supported by a previous upward/downward trend with increasing volume and momentum, presenting an excellent reward-to-risk opportunity.
HMT (High Momentum Trending):
HMT is based on trend, momentum, volume, and market structure across multiple timeframes. It highlights setups with strong potential for upward movement and higher rewards.
Whenever I spot a signal for my own trading, I’ll share it. Please note that conducting a comprehensive analysis on a single timeframe chart can be quite challenging and sometimes confusing. I appreciate your understanding of the effort involved.
Important Note :
Role of Key Levels:
- These zones are critical for analyzing price trends. If the key level zone holds, the price may continue trending in the expected direction. However, momentum may increase or decrease based on subsequent patterns.
- Breakouts: If the key level zone breaks, it signals a stop-out. For reversal traders, this presents an opportunity to consider switching direction, as the price often retests these zones, which may act as strong support-turned-resistance (or vice versa).
My Trading Rules
Risk Management
- Maximum risk per trade: 2.5%.
- Leverage: 5x.
Exit Strategy
Profit-Taking:
- Sell at least 70% on the 3rd wave up (LTF Wave 5).
- Typically, sell 50% during a high-volume spike.
- Adjust stop-loss to breakeven once the trade achieves a 1.5:1 reward-to-risk ratio.
- If the market shows signs of losing momentum or divergence, ill will exit at breakeven.
The market is highly dynamic and constantly changing. HMT signals and target profit (TP) levels are based on the current price and movement, but market conditions can shift instantly, so it is crucial to remain adaptable and follow the market's movement.
If you find this signal/analysis meaningful, kindly like and share it.
Thank you for your support~
Sharing this with love!
HMT v2.0:
- Major update to the Momentum indicator
- Reduced false signals from inaccurate momentum detection
- New screener with improved accuracy and fewer signals
HMT v3.0:
- Added liquidity factor to enhance trend continuation
- Improved potential for momentum-based plays
- Increased winning probability by reducing entries during peaks
HMT v3.1:
- Enhanced entry confirmation for improved reward-to-risk ratios
HMT v4.0:
- Incorporated buying and selling pressure in lower timeframes to enhance the probability of trending moves while optimizing entry timing and scaling
HMT v4.1:
- Enhanced take-profit (TP) target by incorporating market structure analysis
HMT v5 :
Date: 23/01/2025
- Refined wave analysis for trending conditions
- Incorporated lower timeframe (LTF) momentum to strengthen trend reliability
- Re-aligned and re-balanced entry conditions for improved accuracy
HMT v6 :
Date : 15/02/2025
- Integrated strong accumulation activity into in-depth wave analysis
HMT v7 :
Date : 20/03/2025
- Refined wave analysis along with accumulation and market sentiment

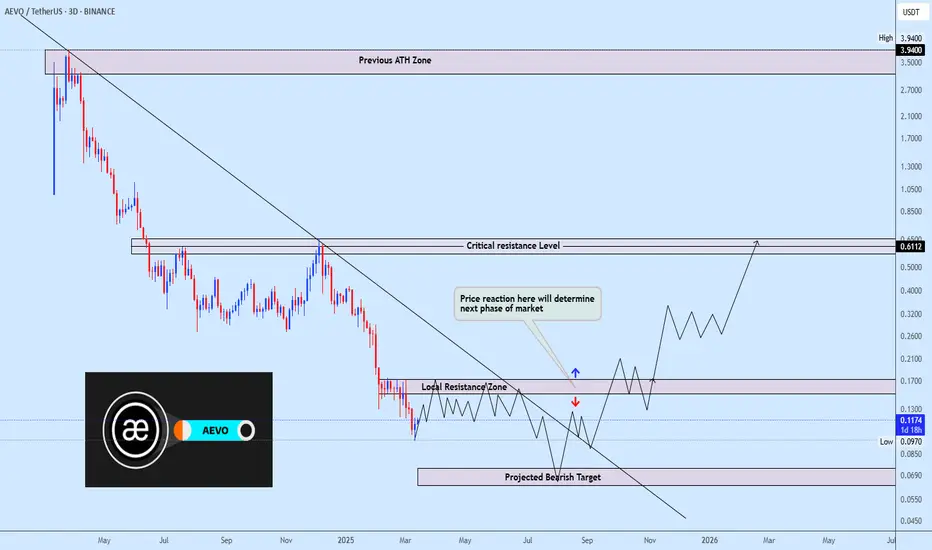
Aevousdt trading ideaAevo exhibit clear downtrend with a descending trendline acting as resistance. Price is currently reacting to a local resistance zone, where a breakout could lead to a test of the critical resistance at 0.6112, while rejection could send it towards the projected bearish target around 0.0580. Price action suggests consolidation within a tight range, indicating indecision. A break above the local resistance could trigger bullish momentum, while failure may extend the downtrend. The next major move depends on price reaction at the current resistance zone.
CEX hacks turn attention to DEX once again, AEVOas market participants quietly allowed themselves to forget about the CEX Ponzi scheme that was FTX supported by its wealthy social media shills, Bybit is hacked by North Korea for $1.5b... not hours after Coinbase CEO Brian Armstrong claims lawsuits against the industry will be dropped. What further evidence is needed as to why this industry is doomed to fail?
On the above 6 day chart price action on the decentralised exchange token AEVO has corrected 95% since February last year. Market participants are now bearish, just in the knick of time…. a number of reasons now exist to be long, they include:
1) Price action and RSI resistance breakouts. (see linear chart below)
2) Regular bullish divergence as measured over a one month period.
3) Hook reversal pattern. You either know or you don’t. You’ll see an HRP on the Bitcoin pair also.
4) Two significant areas of resistance are shown, one at 280% and the other at 750%.
Is it possible price action continues correcting? Sure.
Is it probable? No.
Ww
breakouts
News source:
www.trmlabs.com

AEVO LONG DEVIATION For the past 7 months, AEVO has ranged between $0.60 and $0.25. It seems to have broken below this range, creating a new low. However, for those with patience, this presents an ideal setup for a long position in this coin.
At the moment, market psychology suggests the following:
Traders who bought at the support zone are now losing money and likely closing their positions or even opening shorts, adding liquidity.
Meanwhile, whales that shorted from $0.64 down to the current levels are likely accumulating below support.
These whales could push the price higher to liquidate short positions.
As the price rises, short sellers may be forced to close in losses or add to their losing positions, creating further fuel for an upward move.
If the price re-enters the range, this would confirm that the breakdown was just a stop hunt, signaling a good opportunity to open a long-term position.

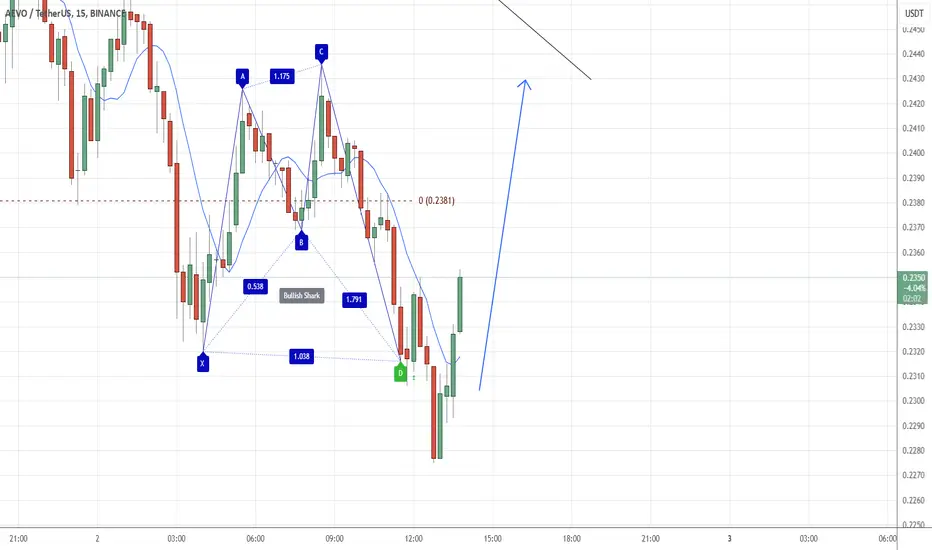
AEVO/USDT Long Trade Setup Analysis (15M Timeframe - Binance)🔍 Market Context:
- AEVO/USDT is currently showing signs of a bullish reversal after reaching a low point.
- The price has bounced from a key support level, near the 0.2320 area, forming a potential bullish shark pattern.
- Fibonacci retracement levels and previous price action suggest resistance zones to watch above.
📊 Trade Entry Criteria:
- The price has reacted strongly at the 0.2320 support, with a sharp upward movement forming a potential bullish pattern.
- A bullish confirmation is expected if the price breaks above 0.2345 resistance, continuing the upward move.
- A rejection from the resistance could result in a retest of the lower levels.
🎯 Trade Targets & Risk Management
- Bullish Scenario:
- Entry Price: Above 0.2345 USDT
- Take Profit (TP1): 0.2380 USDT (38.2% Fibonacci)
- Take Profit (TP2): 0.2400 - 0.2420 USDT (50%-61.8% Fibonacci)
- Stop Loss (SL): Below 0.2320 USDT
- Bearish Scenario:
- Entry Price: Below 0.2320 USDT (break of support)
- Take Profit (TP1): 0.2300 USDT (27.2% Fib extension)
- Take Profit (TP2): 0.2270 USDT (61.8% Fib extension)
- Stop Loss (SL): Above 0.2345 USDT
📉 Profit Target Justification:
- The bullish target aligns with key Fibonacci retracement levels and a previous liquidity zone.
- The bearish target is supported by Fib extensions and the possibility of further downside if support breaks.
📌 Summary
✔ Price is at a key support level, suggesting a potential bullish move.
✔ Fibonacci confluence provides clear trade setups for both bullish and bearish scenarios.
✔ Risk-to-reward ratio is favorable in both directions.
🔻 Invalidation: If price breaks below 0.2320 USDT, bullish setups are invalid. Conversely, a strong move above 0.2345 USDT would invalidate bearish setups.
AEVO/USDT Short Trade Setup Analysis (1D Timeframe - Binance)
🔍 Market Context:
- AEVO is in a downtrend, with a series of lower highs and lower lows.
- The price has retraced from recent lows and is testing key Fibonacci retracement levels as resistance.
📊 Trade Entry Criteria:
- The entry aligns with the 0.5 Fibonacci retracement level (0.2717), a historically strong resistance point in a bearish market.
- Price is showing rejection wicks around the 0.382 (0.2626) to 0.5 (0.2717) levels, indicating selling pressure.
- The previous strong bearish candles suggest sellers are in control.
🎯 Trade Targets & Risk Management
- Entry Price: Around 0.2648 - 0.2717 USDT
- Stop Loss (SL): Above 0.3106 USDT (-1 Fib level)
- Take Profit (TP): At 0.1576 USDT (-1 Fib extension)
- Risk-to-Reward Ratio: High R:R trade (approximately 1:4 or better)
🛑 Stop-Loss Placement:
- The stop-loss is placed above 0.3106 USDT, beyond the -1 Fib extension, ensuring protection against price spikes.
📉 Profit Target Justification:
- The primary take-profit target is around 0.1576 USDT (-1 Fib extension), aligning with previous swing lows.
- If bearish momentum continues, a deeper drop towards 0.1300 USDT could be possible.
📌 Summary
✔ Bearish rejection at Fibonacci levels
✔ Confluence with overall downtrend
✔ Clear risk-reward ratio (high probability short setup)
✔ Targets key support zones from historical price action
🔻 If price closes above 0.3106 USDT, the trade is invalidated. Otherwise, a continuation lower is expected.

$AEVO at the Lows – Can It Get Any Better?Decided to start buying ASX:AEVO at these levels. It reminds me a lot of CRYPTOCAP:ETHFI , and with CRYPTOCAP:ETH holding up well for now, I'm feeling optimistic.
It's been 5 days without a new low at a key level, so it looks promising. I might get another shot at the lows, so I have some bids placed lower just in case.

pattern cup and handlejust learning about pattern for it to activate
how the pattern that i missed in the first place ive been zooming in to much not seeing the entirety of the chart that what Ive missed it
the pattern is already there but sadly me being a student sometimes ive searching for some other things that arent there specifically the divergence convergence signal hahaha
note for the day
ZOOM OUT

AEVO TIME IS HEREAfter a tough time for Alts in the past couple of weeks, a relief rally is set and Aevo seem ready to take the lead, a breakout upside is imminent.

AEVO/USDT Chart Analysis #AEVO/USDT ( ASX:AEVO )
Rounding Bottom is being formed on weekly🧐
Be ready for a rally once accumulation is over📈
✔️1 Target Zone: 0.9575$
✔️2 Target Zone: 2.7400$

AEVO/USDT$AEVO/USDT
Rounding Bottom is being formed on weekly🧐
Be ready for a rally once accumulation is over📈
✔️1 Target Zone: 0.9575$
✔️2 Target Zone: 2.7400$

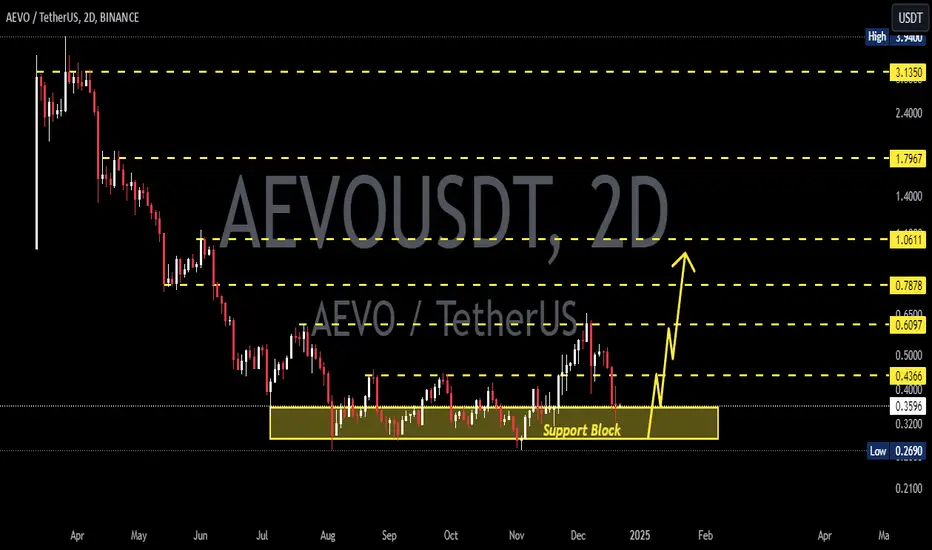
AEVOUSDT 2DAEVO ~ 2D
#AEVO If you still have Conviction on the coin,. Buy gradually within this support block,. with a minimum target of 20%++
AEVO ANALYSIS (1D)It seems to be completing a triangle. If it reaches the green limit, we will look for buy/long positions.
The targets are marked on the chart.
Closing a daily candle below the invalidation level will violate this analysis.
For risk management, please don't forget stop loss and capital management
When we reach the first target, save some profit and then change the stop to entry
Comment if you have any questions
Thank You
