$AIC ANALYSIS!CSE:AIC is testing the red resistance zone 🟥.
✅ If breakout is successful, the first target is the green line level 🟩.
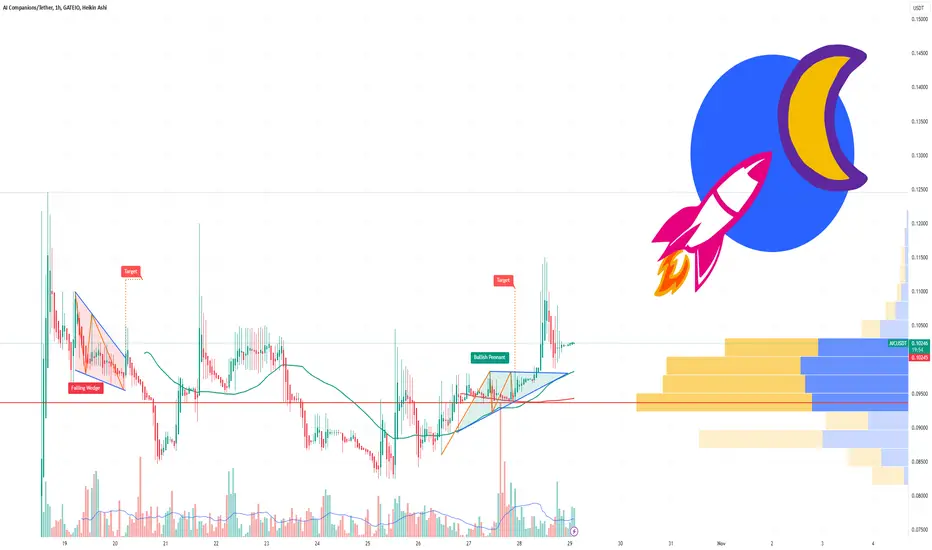
AICUSDT trade ideas

AIC - AI Companions goes up!AIC - It is take over the AI agents Leadership in the Technical point of view.
AI Companions ( CSE:AIC ) is pioneering the next generation of digital relationships by combining AI, VR, AR, and blockchain technologies. Our platform allows users to create deeply personalized, immersive virtual companions that evolve and grow with them.
That is amazing seeing what's happening in the crazy crypto markets in todays time!
From a technical point of view we broke a stage 1 zone, exiting the 0.21$ range zone, the price is stationed around the 0.4$ and then it is trying to break the psychological barrier of 0.5$.
The next question is: where are our possible potential targets?
Well, we dont have one.
we wanna ride it as we did with Virtuals protocol, till the price reach his maximal potential in a possible parabolic scenario. Which is imminent from the chart.
What do you think?
Good trading!

Support near Fibonacci ratio 2.618 is the key
Hello, traders.
If you "Follow", you can always get new information quickly.
Please also click "Boost".
Have a nice day today.
-------------------------------------
(1D chart)
The chart is broken due to the rapid rise.
Please refer to the Fibonacci ratio that can be seen in the current upward wave.
Since the StochRSI indicator has touched the highest point in the overbought zone, even if it rises further, the Fibonacci ratio 2.618 (0.484488) is expected to be the high point.
If the decline begins,
1st: Fibonacci ratio 1.902 (0.379635) ~ 2 (0.393986)
2nd: 1.618 (0.338045)
3rd: 0.288000
You should check whether there is support among the 1st-3rd areas above.
The important thing in the decline is whether it can touch the MS-Signal (M-Signal on the 1D chart) indicator and rise.
-
Thank you for reading to the end.
I hope you have a successful trade.
--------------------------------------------------
- Big picture
I used TradingView's INDEX chart to check the entire range of BTC.
(BTCUSD 12M chart)
Looking at the big picture, it seems to have been maintaining an upward trend following a pattern since 2015.
In other words, it is a pattern that maintains a 3-year upward trend and faces a 1-year downward trend.
Accordingly, the upward trend is expected to continue until 2025.
-
(LOG chart)
Looking at the LOG chart, you can see that the upward trend is decreasing.
Accordingly, the 46K-48K range is expected to be a very important support and resistance range from a long-term perspective.
Therefore, I expect that we will not see prices below 44K-48K in the future.
-
The Fibonacci ratio on the left is the Fibonacci ratio of the uptrend that started in 2015.
That is, the Fibonacci ratio of the first wave of the uptrend.
The Fibonacci ratio on the right is the Fibonacci ratio of the uptrend that started in 2019.
Therefore, this Fibonacci ratio is expected to be used until 2026.
-
No matter what anyone says, the chart has already been created and is already moving.
It is up to you how to view and respond to it.
Since there is no support or resistance point when the ATH is updated, the Fibonacci ratio can be appropriately utilized.
However, although the Fibonacci ratio is useful for chart analysis, it is ambiguous to use it as a support and resistance role.
The reason is that the user must directly select the important selection points required to create the Fibonacci.
Therefore, it can be useful for chart analysis because it is expressed differently depending on how the user specifies the selection point, but it can be seen as ambiguous for use in trading strategies.
1st: 44234.54
2nd: 61383.23
3rd: 89126.41
101875.70-106275.10 (when overshooting)
4th: 134018.28
151166.97-157451.83 (when overshooting)
5th: 178910.15
-----------------

AICUSDT: Expecting 2x in few weeks!Join our community and start your crypto journey today for:
In-depth market analysis
Accurate trade setups
Early access to trending altcoins
Life-changing profit potential
Let's analyse AICUSDT both fundamentally and technically.
FUNDAMENTAL ANALYSIS:
AI Companions is pioneering the next generation of digital relationships by combining AI, VR, AR, and blockchain technologies. Our platform allows users to create deeply personalized, immersive virtual companions that evolve and grow with them.
Backed by a robust ecosystem and AIC token, AI Companions is set to redefine how people connect in the digital age, offering a transformative experience in virtual companions.
TECHNICAL ANALYSIS:
AICUSDT is displaying a bullish breakout from an ascending triangle pattern. The price has recently rebounded from the 100 MA. The recent listing on Tier 1 exchanges has generated increased interest and potential buying pressure. Additionally, a bullish crossover in the MACD, even in the oversold region, suggests a potential upward trend.
Entry Zone:
$0.104 to $0.098
Targets level:
Expecting 2-3x in few weeks
If you find this analysis helpful, please hit the like button to support my content! Share your thoughts in the comments and feel free to request any specific chart analysis you’d like to see.
Happy Trading!!

$AIC AI Companions Cryptocurrency listed on a tier 1 exchangeCSE:AIC AI Companions announced that it will soon be listed on a tier 1 exchange following the completion of its first smart contract audit report.
The CSE:AIC cryptocurrency is gaining momentum as it continues to attract attention in the rapidly evolving world of artificial intelligence and blockchain technology. Recent insights from the AIC Whitepaper highlight the project's innovative approach to integrating AI companions into daily life, which could redefine how individuals interact with technology.
At the core of CSE:AIC ’s vision is the creation of AI-driven companions designed to enhance user experiences across various sectors, including healthcare, education, and personal productivity. This forward-thinking initiative not only addresses the growing demand for personalized AI solutions but also positions CSE:AIC as a pioneer in leveraging blockchain technology to ensure secure and transparent interactions between users and their AI companions.
The scalability of the CSE:AIC platform could be a significant driver for its adoption. As more users recognize the benefits of AI companions, the demand for CSE:AIC tokens is likely to rise, fueling positive price momentum. The roadmap outlined in the whitepaper indicates a strong vision for future development, including partnerships and integrations that could expand the utility of CSE:AIC beyond its initial applications.