algoStill thinking bottoms in as I alerted to my group back in early Sept like XRP back did bottom at .30c but if BTC nukes we could overthrow to that cluster of
support & resistance I marketed off in my highlighted circle for a capitulation event.
ALGOUSD.P trade ideas

FIFA Fever!Looks like FIFA fever is beginning, expect max $0.50 range, then a drop after Cup is over.
There will also be a dip when governance pays out as well, but should still push up to target. I expect winter to set in after for at least end Q1 2023.
Good health, family and fortune to all!

Algorand looks ready to trigger its inv h&s patternAfter doing a fakeout above the yellow neckline we now have price action for king above the white neckline….not sure which one will be the most valid but if the white neckline reaches its target they both do. I imagine it will be retesting the 1day 200ma before too long. *not financial advice*

ALGOUSDT | NEAR BREAKOUTALGOUSDT has been trading under the falling resistance. The price is trading near the falling resistance. The price has also break above 200SMA. The falling resistance is also confluence with 0.38 fib level.
Th price has multiple support level as 200SMA and 0.236 fib level and horizontal zone too.
The price is converging and now near to breakout.
One can long on breakout.
Trade your levels accordingly.

ALGOHello guys this is my trading analysis about ALGO thank you
IF you like my work please like share and follow thanks
TURTLE TRADER 🐢

Long Algo Everything about Algo's chart is yelling "pump". We just hit strong support along with Momentum showing an Inverse H&S. RSI on the higher time-frames looks bullish as well. This bounce for Algo will be strong! My target is a combination of a fibonacci retracement level along with resistance. Keep an eye on Algo because it's ready to pop.
This chart based off of The Elliot Wave Theory, Fibonacci, EMA’s, MacD , RSI , Momentum, and resistance/support zones combined with patterns.

ALGORAND to $100 (£82) BY 2026?- IS20022 COMPLIANT crypto
- Fast and cheap to move money!
- Partnering up with FIFA 2022!

$ALGOmarket is just simply wrong if it doesn't follow either red or white line / Also has been super weak compared too other alts but fundamentals didn't change.

Algorand - Uptrend Continues!As long as it keeps the trend line intact, it can easily go and tap the range high at $0.40 short term.

Algorand finally poking above the inv h&s neckline.For now we won’t know exactly where the measured move target will be until we know clearly where we officially break above the neckline as well as flip it to solid support. Will update this idea once it happens. *not financial advice*

ALGOUSD King of the laggards Every L1 smart contract platform other than ETH has been underperforming the market in this cycle, but ALGO is truly the king of all laggards. It hasn't had a single ounce of relief in almost nine months. It's time to do or die.

BEAR FLAGInteresting continuation pattern developing on ALGUSD.
Theory is for a continuation of the bearish momentum, however, in case of close above the channel, the outlook would then suggest a bullish reversal.
For now we wait for the breakout and the position our trades accordingly


ALGO TO $.395ALGO showing heavy confluence at .395 cents
We have a ISHS target matching up with a volume profile and a fib with the same coordinates.
Let's ALGO to this target!

Week07 - ALGOUSD | ABCD Chart PatternsAB=CD pattern is formed on crypto pair ALGOUSD 1hr frame and now the trend moving towards point D at bottom and from there trend will be reversed.

Can ALGO overtake ETH by EOY?This is a simple setup for algorand position relative to BTC, ETH and USD
It appears that ALGO is now threatening ETH, as we are hovering dangerously close to upper channel.
With regards to BTC, we are also in the same position.
If Algorand receives any additional catalysts from events, we could see a strong relief rally.
Based on Inverse Prices action in USD, ALGO attempted 4 times to go bellow 30c and could not break through, indicating a very solid demand upon investors, that know the future and fundamentals of Algorand.
Therefore, unless the world is heading into WW3, a new Mega Pandemic, 30c is going to hold and by August we should all be looking at 40c+
I am very interested in the ETH/ALGO as it shows a strong possibilty of ALGO breakout from a long bear channel. It still not going to start a bull, but after that drop it just might..
Fun times ahead regardless,
**LEGENDS**
BLUE = Bear/Resistance || Yellow = Bull/ Support
Lines: Fractal dates are moments of interest, where price and time collide to create oscillation.
the chart for possible scenarios of price actions - use zoom and scroll for better view.~
/*This information is not a recommendation to buy or sell. It is to be used for educational purposes only.*/
Feel free to request: your coin to be analyzed! Please keep those Stop losses in place or mind!
Thank you, and stay strong my fellow CryptoPunks!
Future belongs to the brave, and crypto is the future.
_Ajion

⚡️ #ALGO/USDT - Potential 40% ⚡️⚡️ #ALGO/USDT - Potential 40% ⚡️
Entry Criteria:
- Bullish Divergence
- Local Support & Consolidation
- Added To Kraken Futures
News Source
twitter.com
Entry: 0.2796 - 0.3
TP1: 0.324
TP2: 0.3523
TP3: 0.3971
SL: 0.27 or HOLD

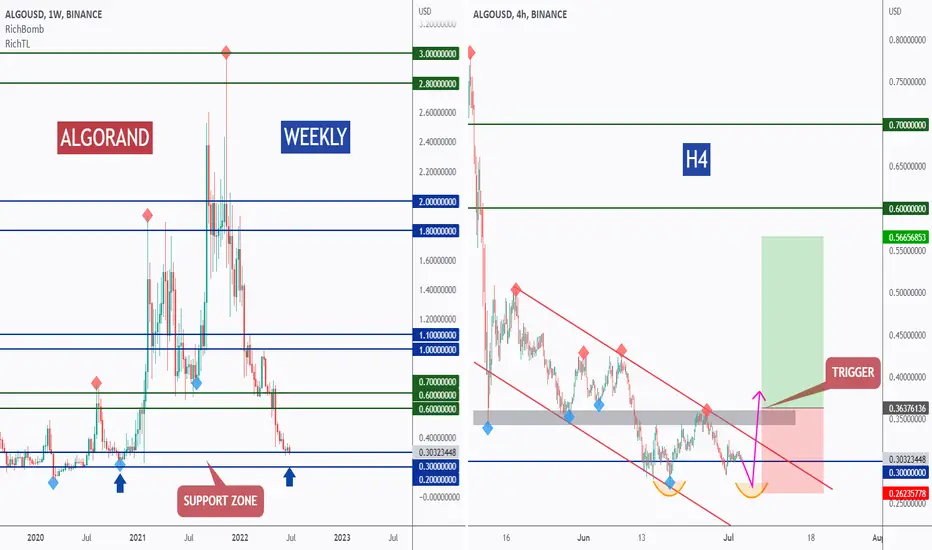
ALGORAND - Wait For The Trigger!Hello TradingView Family / Fellow Traders. This is Richard, as known as theSignalyst.
WEEKLY: Left Chart
ALGO is approaching a strong support and demand zone so we will be looking for buy setups on lower timeframes.
H4: Right Chart
ALGO formed a valid channel in red but it is not ready to go yet. For the bulls to take over, we need a break above the previous high.
Trigger => Waiting for a momentum candle close above the last high in gray to buy.
Meanwhile, until the buy is activated, ALGO can still trade lower inside the blue support zone.
Always follow your trading plan regarding entry, risk management, and trade management.
Good luck!
All Strategies Are Good; If Managed Properly!
~Rich
The Future is Bright for AlgorandFinally hitting my price target. Great time to buy some discounted Algorand. Will be buying weekly to get my average price in the $.50 range.
If price can hold this area of support we could see ALGO setup for a fantastic bull run in 2023-2024. Good luck all!

ALGO/USDT - Potential Short ScenarioHello Traders!
ALGO price continues to move within the descending trend completing the previous market cycle.
The culmination of the falling phase will be an aggressive downward exit of the price under the support level of $0.25
Medium-term purchases can be considered at $0.1440 - $0.1900.
The targets of such purchases will be price levels of $0.25 and $0.36
Good luck and watch out for the market
P.S. This is an educational analysis that shall not be considered financial advice

$ALGO at key levelThe point of control level is $0.3005 very significant. Dating back to Algorand 's inception, this has been a key level of resistance/support. ALGO stopped nearly to the penny on the volume shelf at the bottom and bounced off it multiple times.
Previously it was resistance, now it seems to have become support. ALGO seems to be running out of sellers. Soon the bulls will take control. Targeting the $0.5380 level which would be a 50% return and the VWAP from the most recent high at $1.0172 would be a nearly 200% gain.
Algorand is green, efficient, and has extremely low gas fees (I believe it's $.001 please correct me if I'm mistaken).

SHORT ALGO- Back to 25 CENTS price action on algo along with the rest of the market has solid signs of bearish consolidation
a retest of 25 cents lines up with the pervious historical support back in the 2020 bullish impulse

ALGO, along the uptrend line.The following content is machine translation:
In the 4-hour chart, it rebounded from May 12 and stepped back. It stopped falling on May 29, and then started to oscillate upward. On the way, the low point of the callback continued to rise, forming an upward trend line, but it formed resistance at the price of 0.42. The second time around 0.42 was suppressed and fell back. It fell to the rising trend line yesterday, stopped falling and rebounded. Now it has reached around 0.42 again. If the resistance level of 0.42 cannot be effectively broken here, there is a high probability that it will step back to the vicinity of the rising trend line.
The fast and slow line of the macd indicator is above the zero axis with a golden cross, indicating a bullish trend. The RSI indicator has also recently shuttled up and down the neutral 50, and is currently above 50, a bullish range.
Summary: If the 4-hour k-line breaks through and closes above 0.42, there is a high probability of seeing the resistance near 0.45. If it cannot break through, it will look down and step back near the trend line. When it reaches the trend line, a low, long, and short line can be made.
