ALGOUSDT.P trade ideas

ALGO Approaches Bull Flag Resistance – Breakout Imminent?🔥 EURONEXT:ALGO – Bullish Flag Setup (Daily TF)
ALGO is gearing up to test the flag resistance on the daily timeframe 📊
📈 If price breaks out with strong volume, it could trigger the next leg upward 🚀
⏳ Price action is tightening — a breakout or rejection looks imminent.
👀 Stay focused — this setup is heating up with momentum building!
ALGOUSDT 1D#ALGO has broken above the descending channel on the daily chart. Currently, it is holding above the daily MA100, which is a strong sign. Expect a bullish rally soon. Targets are:
🎯 $0.2847
🎯 $0.3276
🎯 $0.3704
🎯 $0.4314
🎯 $0.5091
⚠️ Use a tight stop-loss.

ALGOUSDT Short Scalping Opportunity – 4H Chart AnalysisThe ALGOUSDT pair is presenting a promising short-term setup for scalpers favoring a bearish outlook. After a short-lived bullish push, the price has failed to break above a critical resistance zone and now shows signs of weakness on the 4-hour chart.
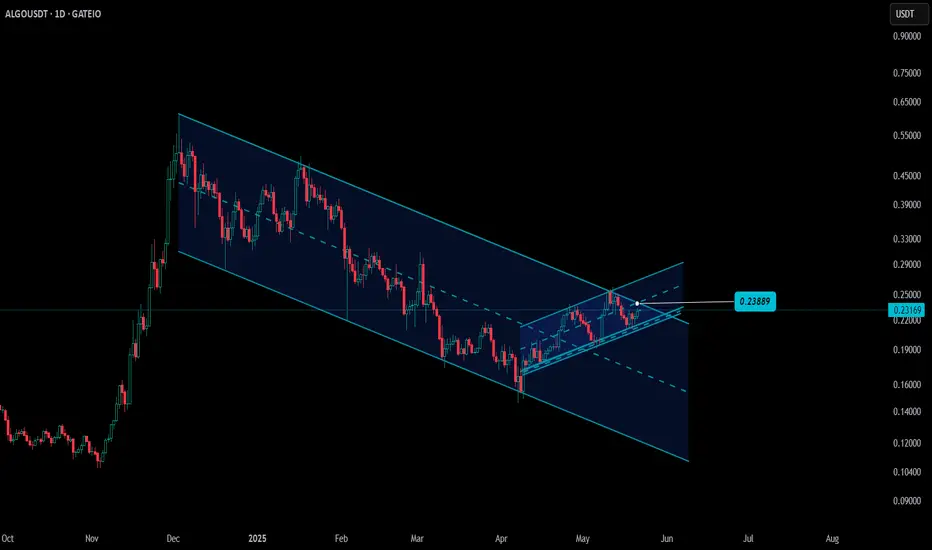
The market structure remains fragile, with recent candles rejecting higher levels around $0.2314, indicating that sellers are regaining control. This resistance was previously a support zone, and the price is now struggling to reclaim it, suggesting a potential reversal point ideal for a short scalp setup.
Key Technical Zones
The most recent rejection confirms the $0.2314 level as a strong supply area. This price acted as support in early May but flipped into resistance after the sell-off on May 16. The zone has been tested again and rejected, further validating it as a solid barrier.
Meanwhile, two demand zones sit below the current price, offering logical targets for the upcoming move.
• Entry (Short): $0.2221 – $0.2223
This is the mid-range zone where the current rejection pattern is unfolding, and it aligns well with the last lower high.
• Stop Loss: $0.2314
Placed above the key resistance. If price breaks and holds above this level, the trade idea becomes invalid.
• Take Profit 1: $0.2105
This is the nearest recent support on the 4H timeframe and a reasonable level for short-term profit-taking.
• Take Profit 2: $0.1908
The second support zone sits lower, offering a more extended reward for traders holding longer or managing partial exits.
Price Action and Trend Behavior
The market has been forming a series of lower highs since May 12. The most recent bounce into resistance was weak, failing to establish new momentum. This confirms the idea that the bulls are running out of steam and sets up the conditions for a bearish continuation.
Volume and momentum indicators have also shown divergence from price, hinting at reduced buying pressure. Price is currently hovering just below the resistance, a typical behavior before a breakdown.
Risk and Reward
This setup provides a good risk-to-reward ratio:
• Risking approximately 91 pips from entry to stop loss
• Potential gain of 118 pips to TP1 and 215 pips to TP2
• RR ratio ranges from 1.29 (TP1) to 2.36 (TP2)
These figures make the trade suitable for scalpers looking for quick moves as well as short-term swing traders who can hold for deeper downside targets.
Trade Outlook
This short scalp aligns with the broader bearish sentiment forming in the altcoin space. ALGO is currently in a retracement phase and is reacting to resistance cleanly on the lower timeframes. If the pair remains below $0.2314, we could see increased selling pressure over the next few sessions.
Short-term traders may consider taking partial profits at TP1 and move the stop to breakeven if price reaches $0.2150 to lock in gains. Should the price fail to break below $0.2105, it may consolidate or retest resistance, in which case patience and discipline are key.

Algorand is slow and steadyALGO has begun an uptrend; a sustainable uptrend needs volume. Can the bulls bring it? The momentum is not overbought, which means the majority of the move up is not in; however, we could see a pullback or a consolidation before that happens.
Full TA: Link in the BIO

ALGO to make a new ATH?Applying the Grand Fib, we can see that if ALGO was to break its ATH, the ultimate target starts at $3.8.
ALGO is currently in the wave 3 about prove its doubters wrong!
There are a few trend lines which ALGO will need to clear in order to make even further parabolic new highs beyond the $3.8 point

Here's the analysis of Algorand (ALGO/USDT)🔍 Step-by-Step Strategic Breakdown:
1. Market Direction (Multi-timeframe Trend)
Daily Structure: After a sustained downtrend (LL–LH), ALGO broke out of its descending trendline and made a higher low followed by a higher high, indicating a possible trend reversal.
Trend Bias: Turning bullish on the daily chart.
2. Trading Levels (Supply–Demand + Fibonacci)
Key Zones Identified:
Support: 0.1985, 0.1646, 0.1469
Resistance: 0.2272 (recent breakout), 0.2840 (next significant supply zone)
Breakout Zone: Price has cleanly broken and retested the 0.2272 resistance → now acting as support.
3. Macro Bias (BTC Pairing + USDT.D + Total2)
Assuming macro context from previous response (Alt/BTC ↑, USDT.D ↓, Total2 ↑) → Long Bias on ALGO/BTC validated.
4. MFI / Momentum Confirmation
Chart shows RSI (not MFI) but:
RSI currently 67.37, near overbought but not yet extreme.
Indicates strong bullish momentum with no visible bearish divergence, supporting further upside.
5. Entry Trigger (4H Candlestick Confirmation)
Not shown on chart, but if a bullish engulfing or pin bar formed near 0.2272 or breakout level on 4H, this would confirm a valid entry.

POSSIBLE BULL SET UP ON ALGOUSDTALGO portrays a bull structure, most alt coins are currently correlating with bitcoin. Price broke out of bullish wedge which is a strong bull signal . We hope for retest of the wedge and upward continuation

ALGOUSDT short-term predictionhi traders,
ALGOUSDT has been traded in the downsloping channel, and now it looks like the breakdown is occurring while I'm creating this publication.
I'm bullish on ALGO long-term, but a short-term 8 % drop is expected.
As the breakdown is just happening, you can enter short now.
Stop loss: 0,2140
Good luck

ALGO NEXT TARGET??#ALGO
EURONEXT:ALGO Algorand is currently retesting the $0.20 level after breaking out of a falling wedge pattern on the daily chart🔍
A successful bounce could trigger a continuation of the bullish rally with targets at $0.24, $0.30, $0.40 and $0.50🚀

Is ALGORAND going to reach 2.550?Algorand has broken through a key resistance at 0.3300. This signals the start of a new bullish trend on the weekly timeframe. Currently, the price is moving within the buying zone of an Andrews Pitchfork, which presents a potential setup for buyers.
The ideal strategy is to wait for a retracement towards the median line before considering long positions. This level often acts as a magnet for price and provides an opportunity to join the trend.
The setup could be a great opportunity to ride Algorand’s next wave upward.

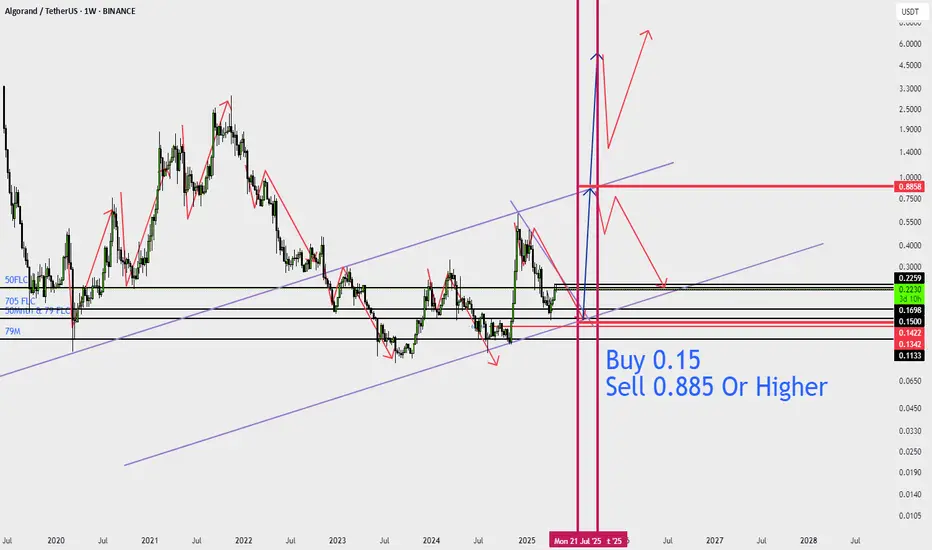
Buy 0.15 Sell 0.885 Or HigherMy opinion is evident in my paintings.
If we follow the history of price movements, we can guess the general trend, but there are various situations that can change this trend, for example, a very large Bitcoin pump, due to which the market cap of other markets and the price are subject to changes, or dumping and manipulation of the Algorand network. Anyway, in my opinion, this is the normal movement of this digital currency. I hope it happens. Of course, it doesn't matter to me if it doesn't happen because I didn't buy this currency. I just want to enjoy the positive result of the analysis I did.
ALGO/USDTThe coin is exhibiting a local bullish market structure. A long position may be considered from the marked demand zone, contingent on favorable entry conditions. Upside targets are set at 0.2389, 0.2602, and 0.3078

ALGO/USDT - Long Setup Update on 3D Time Frame29.04.2025
On April 22, we had a long entry signal on the 3D time frame. As of today, the price remains around the same level.
The system’s rules are favourable for another long entry:
- Price > MLR > SMA > PSAR
- Price is above the 200 MA, reinforcing the bullish bias.
Consider a long entry at today’s close or at the close of this 3D bar. However, note that on the 1D time frame, the price is still below the 200 MA, which could act as resistance.
The PSAR stop-loss is a good option for spot trading, given its placement.
Keep an eye on updates and thank you for reading! 📈📊

Algorand 1D started Bullish Trend for over 100% GainAlgorand could reach higher targets in the future by breaking the correction line.

$ALGO | #3D Macro Outlook #long📌 Setup:
— Ideal entry: retest of 0.618 fib ($0.167–0.172)
— Targets: $0.29 / $0.34 / $0.42 / $0.56
— Invalidation: daily close below $0.165 on volume
⚙️ Triggers:
— Retest + bounce from $0.167 zone
— Strength in CRYPTOCAP:BTC
— Increasing volume + demand confirmation
Midterm potential: +100–150% if trend confirms.

TradeCityPro | ALGO: Key Levels in RWA Coin’s Bullish Revival👋 Welcome to TradeCity Pro!
In this analysis, I’m going to review the ALGO coin for you. This project is one of the RWA (Real World Assets) crypto initiatives, which saw significant growth during the recent hype around this category.
💫 Currently, the market cap of this project stands at $1.99 billion, placing it at rank 47 on CoinMarketCap among crypto projects.
📅 Daily Timeframe
As you can see in the daily timeframe, ALGO has had a notable bullish leg that started from the 0.1085 level and continued up to 0.5138, marking a significant upward move.
💥 However, after reaching that level, the first corrective phase took place down to the 0.3267 support. After breaking this zone, the price continued falling to the 0.1602 support, which also overlaps with the 0.786 Fibonacci level.
🔍 After finding support there, a new high formed at 0.2147, and thanks to the strong buying volume and bullish candles, this resistance has been broken, and price is now heading upward.
📊 The RSI oscillator is currently very close to the Overbought zone, and if it enters that area, we might see some high-volatility moves, increasing the likelihood of sharp bullish candles.
📈 The next resistance levels above are 0.2553 and 0.3267, which align with the 0.5 and 0.382 Fibonacci levels respectively. If price can break through these levels and return to 0.5138, the chances of breaking that top will be significantly higher this time.
✨ On the other hand, if this breakout turns out to be a fake move and price falls below 0.2147, heavy bearish momentum could enter the market, greatly increasing the risk of breaking the 0.1602 level.
🎲 If the market continues to drop, the next major support to watch is 0.1085, which stands as the most critical support for ALGO.
📝 Final Thoughts
This analysis reflects our opinions and is not financial advice.
Share your thoughts in the comments, and don’t forget to share this analysis with your friends! ❤️

ALGO/USDT Technical Analysis Deep Dive! Let’s break down this ALGOUSDT chart step-by-step — it’s a perfect example of trading patterns in action!
🏄♂️ Timeline (Aug 2024 - April 2025):
▸ Accumulation (Aug - Nov 2024): ALGO consolidates between $0.1050 and $0.1450, showing low volatility. This is a classic accumulation phase where buyers are quietly building positions.
▸ Breakout & Uptrend (Nov - Dec 2024): Boom! The price breaks above $0.1300 with strong momentum, climbing to $0.6100.
▸ Pause in a Symmetrical Triangle (Dec 2024 - Jan 2025): After the surge, ALGO takes a breather, forming a Descending Triangle (a neutral pattern). This signals market indecision — traders are waiting for the next big move.
▸ Breakout & Downtrend (Jan - Mar 2025): The price breaks below the triangle, dropping to $0.1480. This aligns with a "Descending Wedge" (reversal) from the cheat sheet , confirming the downtrend and reversal structure of the Wedge.
▸ Consolidation (Mar - Apr 2025): ALGO stabilizes between $0.1400 and $0.1600, setting the stage for the next move.
▸ Breakout & Uptrend (Apr - April 2025): Another breakout! The price surges above $0.1600, reaching $0.2200 again. It might reach higher levels like $0.2400 and $0.3000 in next weeks.
This chart shows how patterns like Descending Triangles, and Wedges can guide your trades. Spotting these using my Trading Patterns Cheat Sheet can help you time your entries and exits like a pro!
✉️ What’s your next move on ALGO? Are you buying the dip, waiting for confirmation, or taking profits? Drop your thoughts below — I’d love to hear your strategy!

ALGO setupThis is just an idea not financial advice this is how think Algo coin would play out for the next major bull move any thoughts and advise is welcome.

ALGOUSD?Hi
1> Broke up down trendline
2> Testing high / resistance= last sell area.
IF it wants to go up.. it will print 0.25 0.30 blah2
If not yet.. will print 0.18 0.15...
So wait till 0.22 and above.. if not! the waiting going to be longer.
Looks simple but.. patience is required and most importantly. Do I see value in holding any asset.
Find out yourself, now there's AI.. you get to weight your decision and be happy with holdings.
Eventhou you are on bumpy road currently.. probably they are building Highway now :)
All the best

Algorand NLP & Higher High & 619% Profits PotentialThis is a very nice chart. Algorand is solid strong on the weekly timeframe (long-term).
There are two main signals; Long-term growth in the form of a rising channel, higher highs and higher lows. Short-term bullish based on a recovery.
Notice the "magic blue line" I drew on the chart. This is a bottom signal. You can draw an inverted head and shoulder here or a v shaped bottom. This week strong move seals the deal. A massive higher low compared to early August 2024.
Ok. How are you doing today my friend in the law?
I hope you are having a wonderful day.
You see...
Hear me out; listen!
Can you feel me?
Do you understand?
Do you grasp what I am trying to share with you?
Can you see what I am doing?
These are all different representational systems, people use difference senses to understand reality. Some are primarily visual, others auditory, kinesthetic, digital, etc.
So, you are likely the feeling type, then, can you grasp what I am trying to say? Are we on the same wavelength? Does it resonate with you?
Yes? Then Algorand is bullish and going up. Why?
Because the chart says so. Because that is exactly what is doing and that is exactly what it will continue to do long-term.
The main low happened in August 2023 and we have the higher lows without question, a higher high comes next.
For your convenience, I mapped this chart with the main target for this bullish wave. It can go higher.
Namaste.

A Home run for ALGO 1K% possible? This is cryptothree potential target
used the fib retracement and confluence appears
assuming the start of the 1st leg of the downward trend was the startig point, target 2 will align exactly with Fib 0.618
assuming the start if the leg was 2.929 then target 3 will brush the 0,382 fib
i drew the lines first and decidd to check the fib zones and align perfectly

Algorand Showing support. ALGO is showing some support at the POC with bullish divergence on the trend and momentum oscillator. A proper CHOCH would be a good confirmation of trend reversal.
Full TA: Link in the BIO
