ALGO/USDT – Bull Flag Formation hi traders
Algorand (ALGO/USDT) is showing a strong bullish continuation pattern following an impulsive price move upward.
🔍 Technical Overview:
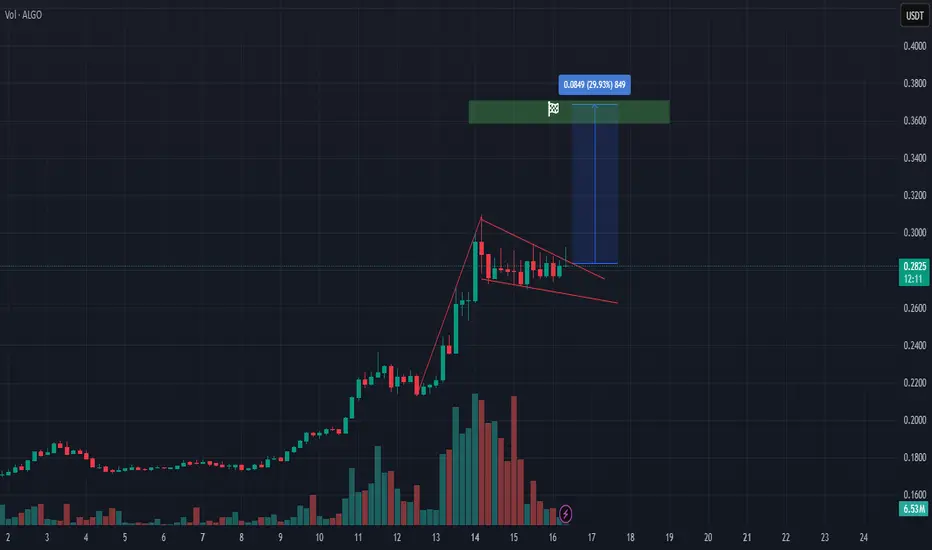
Current Price: $0.2828 USDT
Pattern: Bull Flag
A sharp upward move (flagpole) is followed by a period of consolidation within a downward-sloping channel, forming the flag.
This is a classic bull flag pattern, often indicating a pause before continuation in the original trend direction.
Volume Profile:
Volume surged during the flagpole advance.
It has since tapered off during the consolidation, which supports the textbook flag setup.
📈 Bullish Breakout Expectation:
Once the price breaks above the upper resistance trendline of the flag, a strong continuation move is likely.
The projected target is approximately $0.3677, representing a ~29.9% upside from the breakout level.
This target is measured by applying the height of the flagpole to the breakout point.
Wait for volume confirmation to avoid false breakouts.
*Important:
Failure to break the flag’s upper boundary could lead to further consolidation or a retracement.
ALGOUSDT trade ideas
ALGOUSDT - One of the Best Altcoin Setups Right This chart of ALGO/USDT presents one of the cleanest and most promising bottom formations in the entire altcoin market.
🔍 Technical Highlights
Clear Rounded Bottoms: ALGO has formed multiple rounded bottoms over a long accumulation period, signaling strong base building and exhaustion of sellers.
Descending Wedge Breakout: A breakout from the falling wedge pattern has occurred, further validating the bullish reversal.
RSI Divergence: On the RSI, we see a bullish divergence, suggesting momentum is shifting to the upside.
📈 Market Outlook
ALGO looks ready to begin a parabolic move, breaking out from months of consolidation.
This setup combines long-term support, bullish structure, and momentum reversal.
Based on this structure and previous behavior, we expect a powerful move over the next 1–2 months.
🎯 Targets
First target: $0.6773 — long-term trendline resistance.
Final target: $0.8138 — previous key resistance zone and measured move potential.
🛡️ Conclusion
This is a high-potential setup that stands out in the current altcoin landscape. The structure, volume compression, and technical signals strongly suggest ALGO is preparing for a major breakout. If the move plays out as expected, we could see the price reach both targets within the next 60 days.
One to watch very closely!

ALGO: Surprise Rally Ahead?Yello Paradisers, did you spot that breakout from the descending channel in time or are you still waiting for confirmation that already happened?
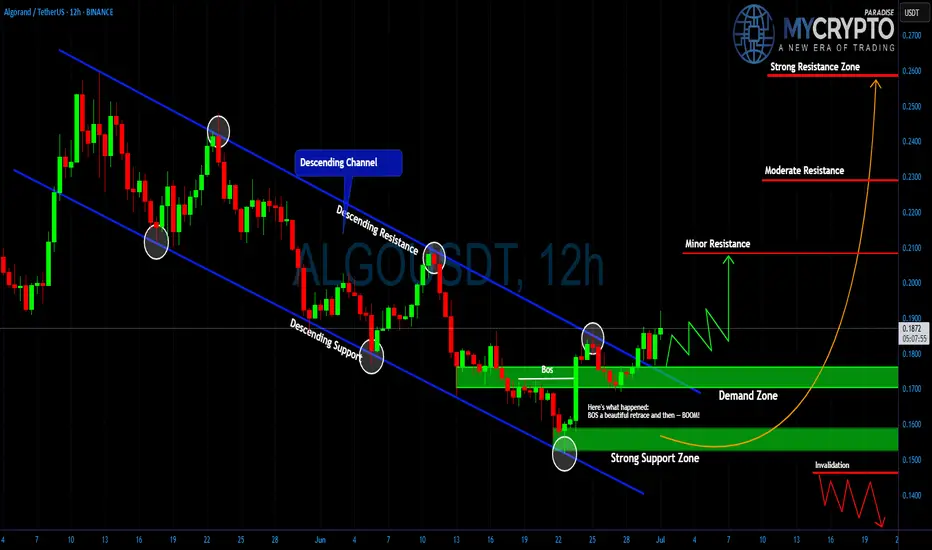
💎#ALGO/USDT has officially broken out of its multi-week descending channel after a textbook Break of Structure (BoS). Price action gave us a beautiful retrace into the demand zone, and from there boom momentum began shifting. This move is now showing early signs of bullish continuation, but as always, the majority will only realize it once the big move is already done.
💎#ALGO had been trading within a clearly defined descending channel, with price reacting precisely between the descending resistance and descending support lines. The breakout occurred after a strong candle pierced the descending resistance, and more importantly, we got a BoS followed by a clean retest of the demand zone around $0.165–$0.175. That reaction was sharp and decisive, indicating strong interest from buyers stepping in.
💎As of now, it is trading near $0.186 and forming higher lows, which supports the idea of an ongoing trend reversal. The structure has changed, and bulls are slowly regaining control. If price sustains above $0.190, the doors open for further upside. The first key level that could slow momentum is minor resistance near $0.210. If that level breaks with volume, moderate resistance around $0.230 becomes the next critical zone. Above that, the major target sits at $0.260, a strong resistance area where a lot of liquidity could be triggered.
💎On the flip side, the strong support zone between $0.145 and $0.155 remains our invalidation area. If price drops below this range, the bullish setup collapses, and we reassess the entire structure. But unless that happens, the bias remains cautiously bullish.
Trade Smart. Stay Patient. Be Consistent.
MyCryptoParadise
iFeel the success🌴
ALGOUSDT Approaching Breakout!BINANCE:ALGOUSDT is showing a potential trend reversal after bouncing from a strong historical demand zone around $0.15. Price action is testing the descending trendline for a breakout, which could trigger a bullish continuation move. Similar to the previous breakout in late 2024, this setup hints at a possible repeat rally. A weekly close above the trendline would confirm strength, opening targets at $0.32 and $0.70+.
COINBASE:ALGOUSD

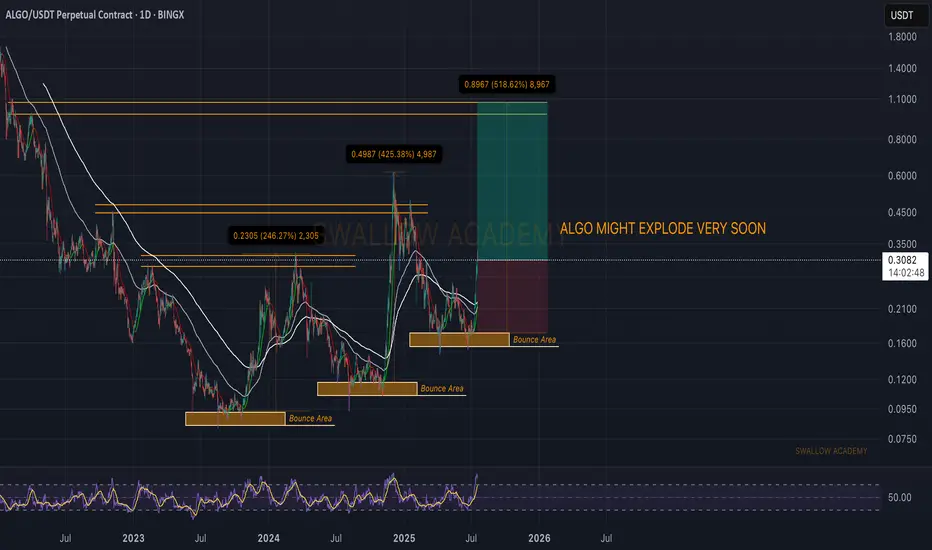
Algorand (ALGO): Potential +250% of Movement To HappenAlgorand is on fire, just like the rest of the market. We noticed a similar pattern, where we have 3-stage movement on this ALGO.
Accumulation—bullish move—bearish move—repeat.
So that's what we are looking for. As we are in a mid-bullish move, we want to see further movement to upper zones, of at least +250% so keep your eyes wide open!
Swallow Academy
ALGORAND - LONG TERM BUY OPPORTUNITY, BEST ENTRY PRICE, 600%+ALGORAND (ALGO) is one of the layer 1 blockchain platform's that is compatible with ISO 20022. ISO 20022 is a global standard for financial messaging that aims to standardize electronic data exchange between financial institutions. Some speculate whether this is applicable or not long term, however the narrative still exists, so along with other ISO 20022 cryptos such as XRP, this can mean a nice place to park some capital in crypto. Conservatively, Algorand can touch $1.00 long term and then potentially $2.00 especially if any announcements, collaborations or other catalyst arise. Algorand is working towards quantum resistance, and that's also a selling point for the blockchain. Gary Gensler once praised Algorand and take that with what you must, but that doesn't hurt when former SEC Chairman shills a crypto project.
ALGOUSDT – Spot Swing Trade RecommendationALGOUSDT – Spot Swing Trade Recommendation
Reason: ALGO has formed clear bottoms on Weekly (W) and Monthly (M) charts, signaling the start of a long-term bullish cycle on the Monthly timeframe.
Entry: Around current price ~$0.22.
Strategy: Accumulate gradually—buy below $0.22; avoid adding positions above this price.
Take Profit:
Based on W and M peak signals, or
Fixed price target above $0.80.
Note: Weekly bottom just formed; expect momentum to pick up in 2-3 weeks.
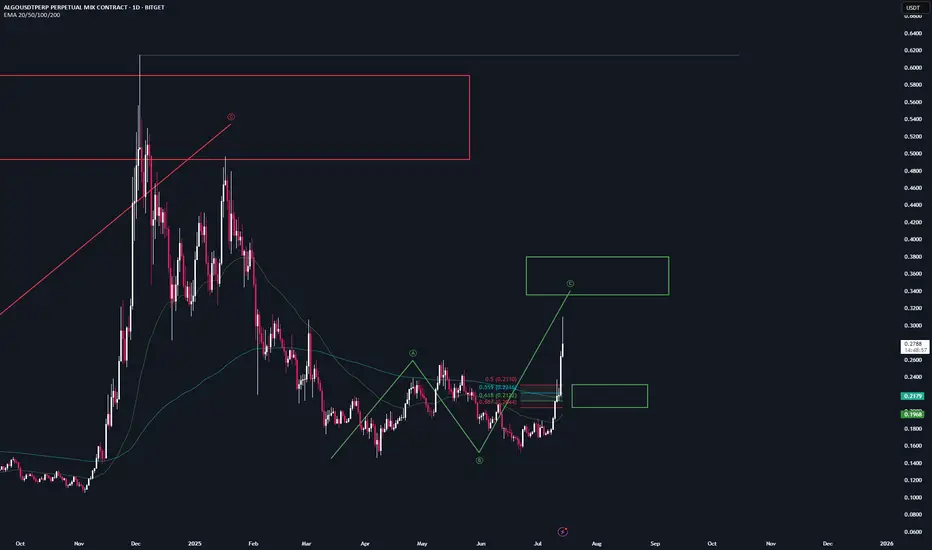
Algo |Trade Setup📌 After the breakout from the last high at $0.26, a bullish sequence (green) has now been activated.
📊 These setups typically occur no more than twice per year on any given altcoin, so I’ll be aggressively buying each level at the B-C retracement area.
Trademanagement:
- I'm placing long orders at each level. ((If the price continues climbing, I’ll adjust the trend reversal level (green) accordingly and update my limit orders.)
- Once the trade reaches a 2 R/R, I’ll move the stop-loss to break-even.
- From a 3 R/R onward, I’ll start locking in profits.
✅ I welcome every correction from here on —
but I won’t enter any new positions at these top levels.
Stay safe & lets make money
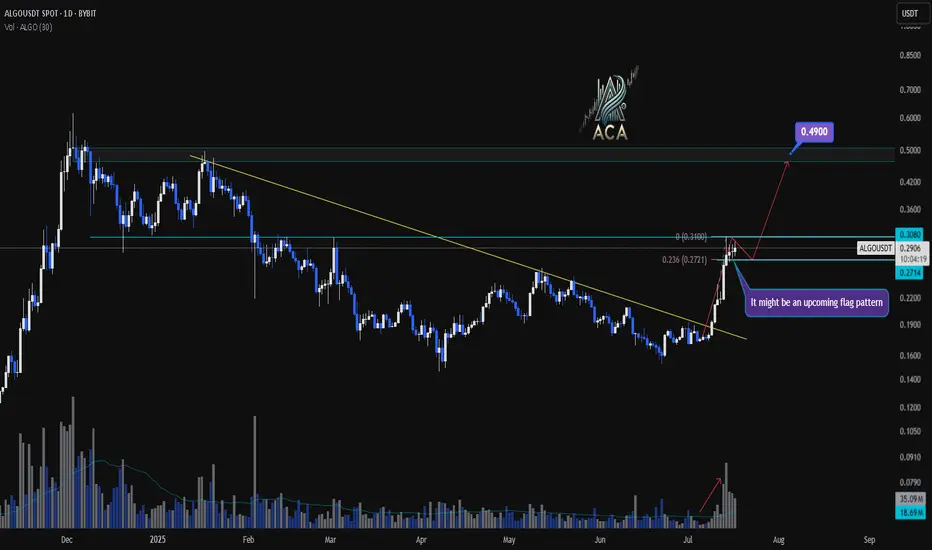
ALGOUSDT Daily Chart Analysis | Continuational patternsALGOUSDT Daily Chart Analysis | Momentum Picks Up on Higher Timeframe
🔍 Let’s break down the latest ALGO/USDT daily chart, highlighting a shift in market structure and key bullish signals.
⏳ Daily Overview
A decisive breakout above the long-standing descending trendline has flipped the narrative for ALGOUSDT. Increased volume during the breakout points to robust bullish momentum, suggesting buyers are regaining control at this multi-month inflection point.
🔔 Flag Pattern & Chart Structure
- Bullish flag pattern is emerging after the recent breakout, as price consolidates in a tight range—a classic continuation formation.
- Former trendline resistance is now acting as support, confirming a notable shift on the higher timeframe.
📐 Fibonacci & Target Levels
- The 0.236 Fibonacci retracement at $0.2771 is providing immediate support, with price consolidating above this anchor level.
- Upside targets:
- First resistance at $0.3080, which aligns with horizontal supply and previous pivot highs.
- If the flag pattern resolves upward, the next Fibonacci extension points to $0.4900, marking a significant confluence and potential for further gains.
📊 Key Highlights
- Strong daily candle and surging volume confirm momentum shift.
- Watch the developing flag pattern for breakout confirmation.
- Major trendline break on the daily signals structural reversal.
- $0.3080 is the immediate target; $0.4900 is the extended objective from the flag/Fibonacci alignment.
🚨 Conclusion
ALGOUSDT is setting up a compelling bullish scenario—keep a close eye on price behavior at the flag and $0.3080 level. A breakout may trigger the next impulsive move toward $0.4900.
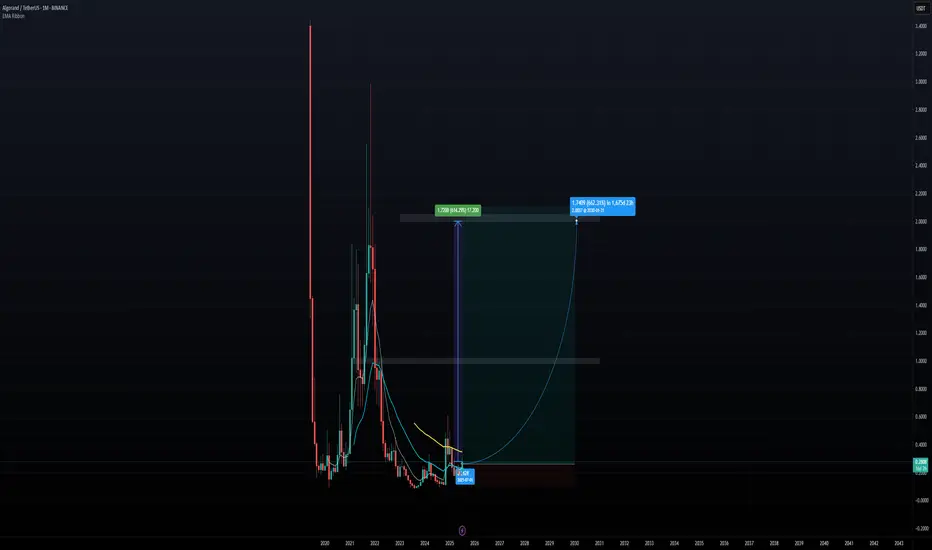
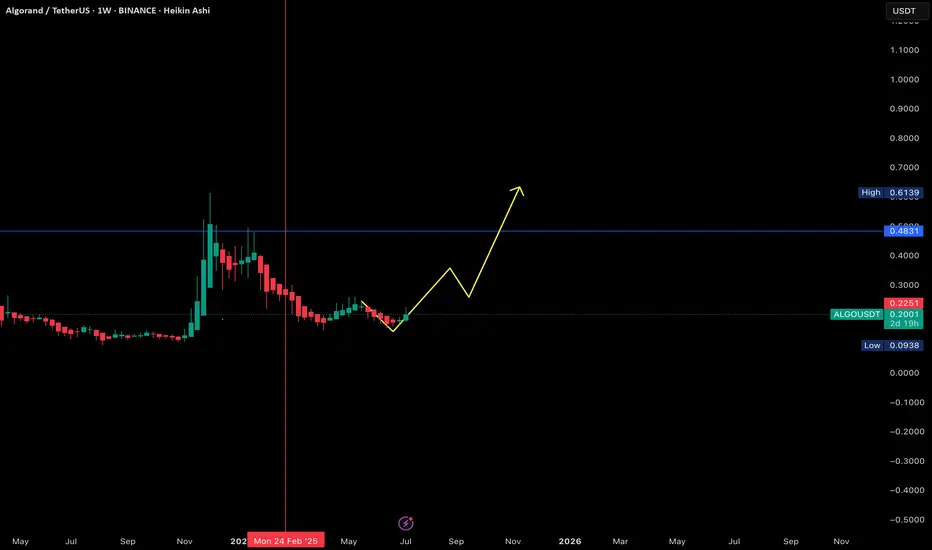
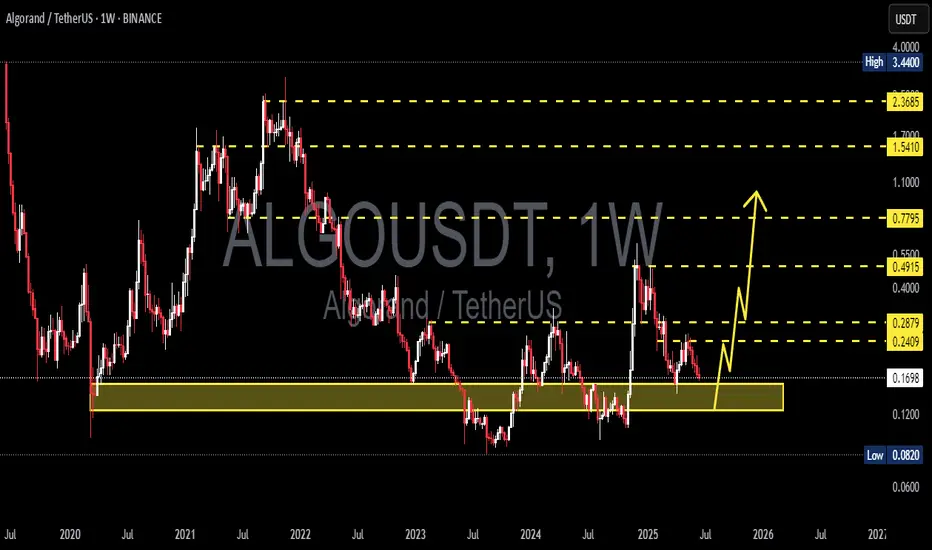
ALGORAND at $0.50?Considering the Fibonacci levels from the November 2021 decline to the August 2023 low, the current movement suggests a test of the last high, which coincides with the 0.5 Fibo level.
This suggests that ALGORAND is likely to test resistance at $0.50 before seeking higher moves to $0.75 (0.618 Fibo). If it overcomes this level, the sky's the limit, and resistance should only be found above $2.00.

Algorand Coming Near You Soon!Repeat after me: A simple chart a day is all you need for great TA!
Need I say more?
Included volume data and RSI if you needed more confluence. LL on RSI confirming what's in PA.
This isn't financial advice y'all

$ALGO tick tockGod candle incoming years of pain on the btc pair to be wiped out imo
locked and loaded but still feeling the fomo
for leveraged swing will keep compounding and playing it level by level along with a long term swing till 72c zone then shall see what to do
either way just an update on my earlier chart likely one dip then rip or teleport so time to pay attention ..
$algo- we ride againanother 48hrs we should get the party started dominance is on the verge of nuking as are most alts on their atl in terms of btc pairs ...
imo we have about half a trilly coming into alts over the next 2 quarters
so time to step on the gas
buy red not the green shit happened before forget it and move on ; )
carpe diem
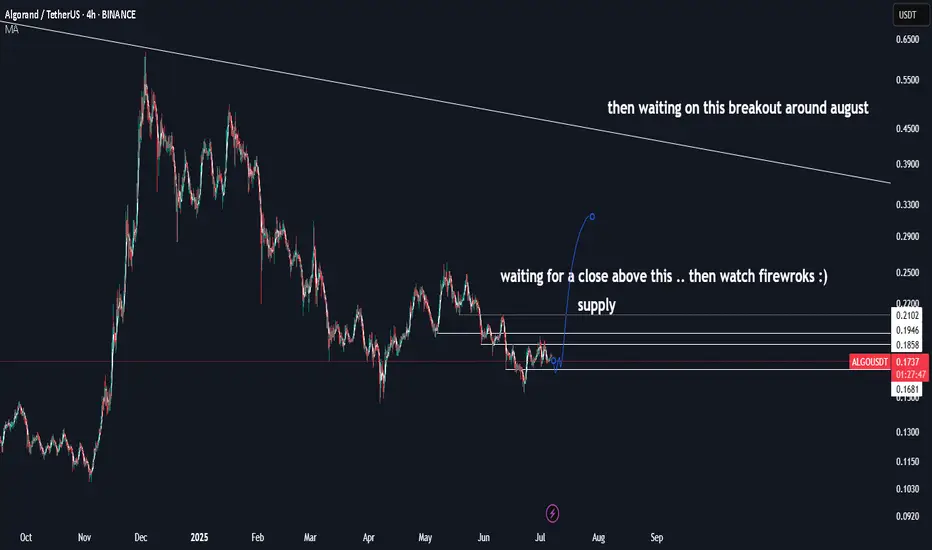
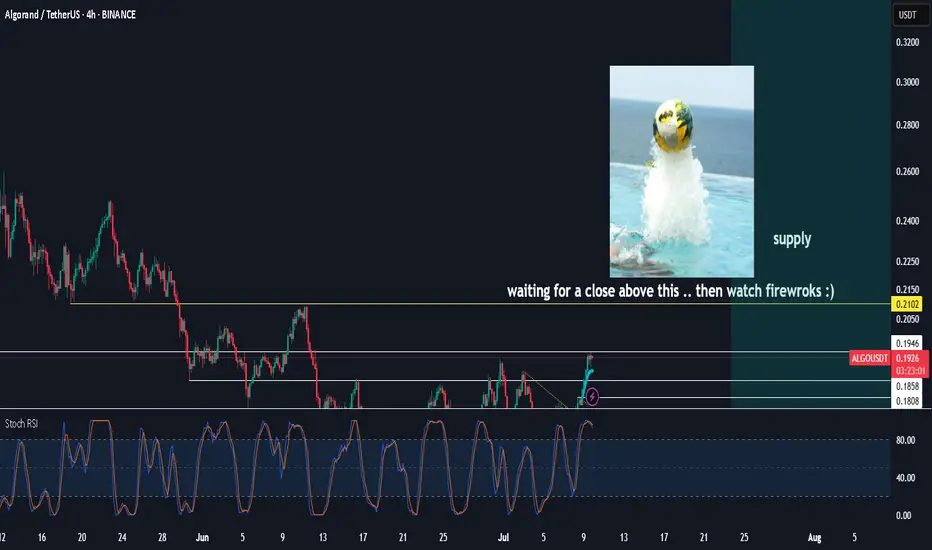
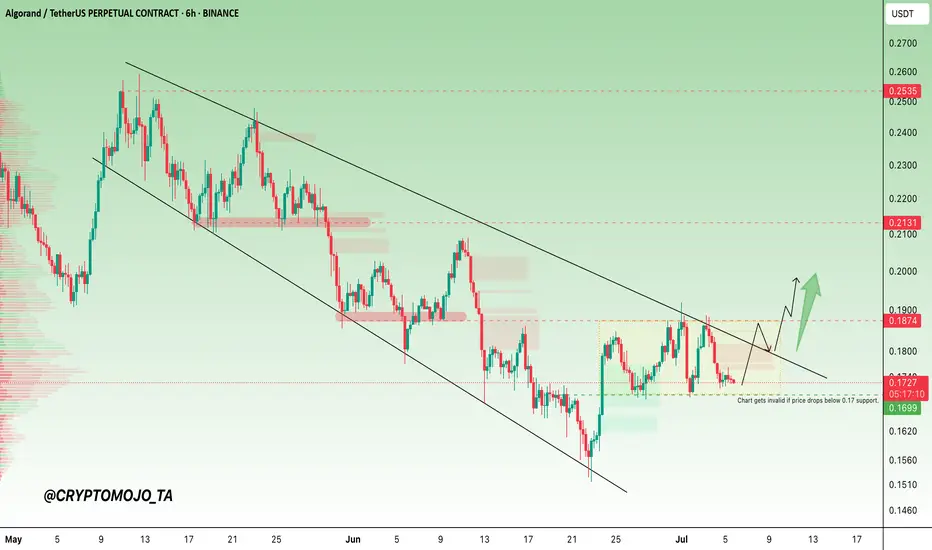
$ALGO Breakout Loading After Months of PainEURONEXT:ALGO is setting up for a potential breakout after months of bleed.
The downtrend has held since early May, but now signs of compression, accumulation, and structural shift are emerging.
After bottoming near $0.153, ALGO formed a bullish structure just below the major trendline resistance and is holding firm above the key $0.17 support. This zone has acted as a battleground with buyers stepping in every time price dips into it.
We now see a clear accumulation range developing below resistance at $0.1874–$0.19. A breakout and retest of this level could confirm trend reversal and trigger a move toward $0.213 and higher.
Invalidation: Close below $0.17
Key Breakout Levels: $0.1874 – $0.19
Target Zones: $0.213 – $0.2535
ALGO has been ignored for months but the technicals are aligning. If this structure plays out, we could witness a mid-term trend flip fueled by the energy built up in this rang
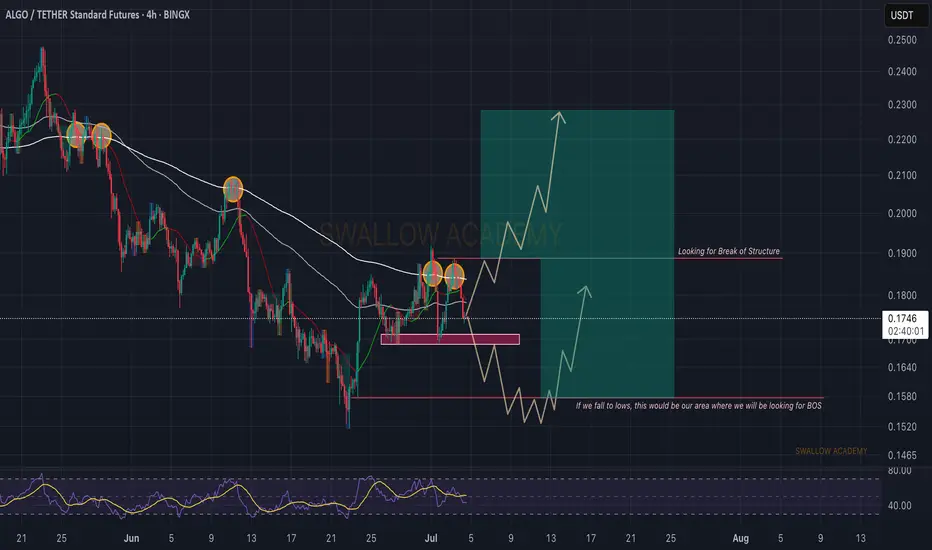
Algorand (ALGO): Looking For Break of Structure | Long PositionLooking for long positions that we can take, where we have pointed out 2 areas (one above the current 200EMA zone and another near the local bottom).
It is still a little early to talk about it but we are putting out a few zones to keep your attention at. Once we see proper BOS there, we will be looking for a long entry.
Swallow Academy
Algorand ALGO price analysis#Algo price is being held back from a deep dive, as far as it is appropriate to say that about altcoins right now.
The price decline on reduced volumes is similar to the previous two times on the OKX:ALGOUSDT chart.
🙂 A risky purchase from $0.15, if they hold the price there, it will be very cool.
📈 And if not, then “buckets” for buying in the $0.10-0.11 range, if you believe in the prospects of the #Algorand project
👊 And keep your fingers crossed, because there is a hypothetical chance that the price of #ALGO will rise to the $1.35-1.41 range by the end of this year, but everyone will have to be very lucky)
____________________
Did you like our analysis? Leave a comment, like, and follow to get more

Algorand (ALGO): Seems More of a Liquidity Grab | We WaitCurrent movement on markets seems a little suspicious, where markets are dipping hard, yet for example, on ALGO, we do not see any proper signs.
We are expecting to see soon a bounce to upper zones to form another local hight from where we will be looking for a correctional movement, but for now we are just keeping our attention at 200 EMA.
Swallow Academy

Algorand (ALGO): Targeting $0.32 Once We See Breakout Algorand has had a decent upward movement where now we are retesting the resistance zone on smaller timeframes.
Now what we are looking for is the proper break of that zone, which then would result in a good upward movement. So for now we wait for the 200EMA to be secured by buyers.
Swallow Academy

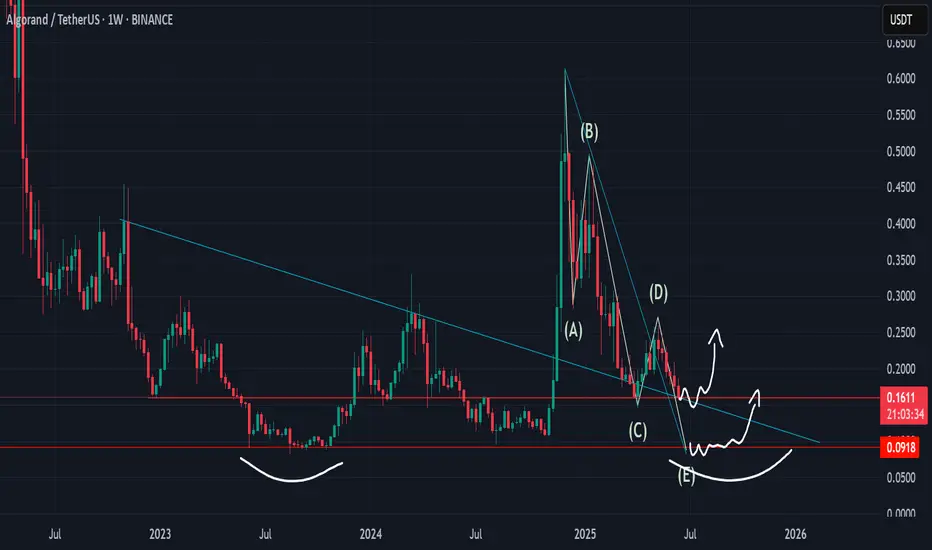
ALGO Fighting in Support ZoneALGO sitting in support zone its not strong support zone with many price rejection in this price range from December 2022
But if this line break maybe we can heading to the greatest and strongest support zone around 0.09 like in June 2023 and ABCDE pattern completed then consolidate a while before next jumping
ALGOUSDT 1W AnalysisALGO ~ 1W Analysis
#ALGO Buy back gradually from here with a short-term target of at least 20%++.
SPOT ALGO LONG 15.06.2025Pinning after abnormal activity.
💰I enter at the market price.
I'll let you know when I record it manually.
‼️Risk per trade: 2% of the allocated funds for spot trading.
Thank you!

ALGO/USDT – Breakout Trade Setup (Daily Timeframe)BINANCE:ALGOUSDT has officially broken out of a multi-month descending channel, signaling a shift in trend. After several failed attempts, price action finally pushed above both the channel resistance and the 50-day EMA (~$0.2197), confirming renewed bullish momentum.
Following the breakout, ALGO completed a textbook retest of former resistance turned support around $0.2124. This zone now acts as a demand area and reinforces the bullish bias. The current price action near $0.2275 provides a favorable entry with a well-defined invalidation below $0.1908.
🎯 Trade Parameters
Entry: $0.2250 - $0.2170
Stop Loss: $0.1908
Targets:
• TP1 – $0.2621
• TP2 – $0.3000
• TP3 – $0.3320
Risk/Reward: ~3:1
Potential Upside: +54.85%
📌 Why This Setup?
✅ Breakout + Retest: Clean structure, respecting trendlines and horizontal zones.
✅ Above EMA: Price now trading above 100EMA, flipping it into dynamic support.
✅ Volume Support: Increased volume during breakout validates buyer strength.
✅ Clear invalidation: A move below $0.1908 invalidates the setup.
Summary: With a favorable risk/reward and strong technical signals, ALGO/USDT offers a compelling swing trade opportunity. Maintain discipline on stop loss and trail profits as targets are approached.

TradeCityPro | ALGO: Bearish Pressure Builds Near Key Support👋 Welcome to TradeCity Pro!
In this analysis, I’m going to review the ALGO coin for you. The Algorand project is one of the Layer 1 and RWA projects.
⚡️ The coin, with the ticker ALGO, currently holds a market cap of $1.63 billion and ranks 53rd on CoinMarketCap.
⏳ 4-Hour Timeframe
As you can see in the 4-hour timeframe, after the price reached the 0.2505 resistance level, a bearish phase began, and with the breakdown of the 0.2123 level, the first bearish leg extended down to 0.1912.
✔️ After this drop, the price retraced up to the 0.382 Fibonacci level and now has returned to the 0.1912 zone. Given the strong bearish momentum in the market, the probability of breaking this level is quite high.
✨ If 0.1912 is broken, the extension wave could begin. According to Fibonacci projections, the targets for this position are 0.1780, 0.1732, and 0.1602.
💥 An entry of RSI into the Oversold zone would serve as a very strong momentum confirmation for this position. If that happens, the price may reach the 0.1602 target.
📊 Volume also plays a key role. Currently, the selling volume isn’t very strong, which might result in a fake breakout of 0.1912. I suggest waiting to see whether sell volume increases, because without volume, price movement is unlikely.
📈 For a long position, the first trigger we currently have is the 0.2023 level, which is a significant high and overlaps with the 0.382 Fibonacci retracement level. Breaking this level could resume the long-term bullish trend.
💫 The momentum confirmation for a long position would be the RSI breaking above the 50 level. A breakout here could kick off a bullish trend in the higher timeframes.
📝 Final Thoughts
This analysis reflects our opinions and is not financial advice.
Share your thoughts in the comments, and don’t forget to share this analysis with your friends! ❤️
