📈Insightful Analysis: ALGO Coin's Potential Moves🔥🔍Let's dive into today's market analysis. Compared to yesterday, the market hasn't made any significant moves, prompting us to zoom in on the daily timeframe for a broader perspective. Today, our focus is on ALGO coin, presenting intriguing opportunities for both short and long positions. Let's dissect the price action to identify optimal entry points for futures and spot positions.
💎First and foremost, let's analyze the candlesticks. Candlesticks serve as the primary market data, providing invaluable insights into market behavior. While indicators such as RSI offer secondary derivations, they serve as confirmatory tools rather than primary signals for entry. Hence, our strategy hinges on understanding and interpreting candlestick patterns to gauge market sentiment effectively.
📈ALGO coin embarked on its bullish journey since September 2023, displaying sharp and oscillating upward movements, eventually reaching the resistance at $0.3196. Along this trajectory, it established robust support at $0.1591, acting as a pivotal level amid market corrections. The resilience of such key supports signifies market strength, yet a breach serves as a potent confirmation of trend reversal, albeit a challenging feat due to strong buy-side pressure.
📉Now, onto strategy. For short positions, a break below the central RSI line at 50, coupled with a significant candle confirmation, presents an opportune entry point. Setting stop-loss below $0.1591 ensures prudent risk management, while potential targets include $0.1305 and $0.1055, reflecting downside potentials. Conversely, for long positions, a break above $0.2113 serves as a trigger, with subsequent targets at $0.3196 and beyond, provided strong candle confirmation.
🛒As for spot positions, holders may consider liquidating upon daily candle closure below $0.1591, ensuring capital preservation. Alternatively, reducing exposure to initial investment while retaining potential upside allows for flexibility amid market uncertainties. For those seeking entry, a break below the ascending trendline, followed by a confirming candle, provides a compelling opportunity, with $0.1591 as a viable stop-loss level.
📝In conclusion, ALGO coin presents intriguing prospects for both short and long positions, contingent upon meticulous risk management and strategic entry execution. The market awaits, ripe with opportunities for those who dare to seize them.
🧠💼It's important to acknowledge the inherent risks in futures trading, with the potential for margin calls if risk management is neglected. Always adhere to strict capital management principles and utilize stop-loss orders, ensuring that the initial target offers a risk-to-reward ratio of 2
ALGOUSDT trade ideas

#ALGO/USDT#ALGO
The price is moving in a bearish channel pattern on the 4-hour frame and sticking to it well
The price rebounded well from the lower border of the channel at the green support level of 0.160
We have a tendency to stabilize above the Moving Average 100
We have oversold resistance on the RSI indicator to support the rise, with a downtrend about to break higher
Entry price 0.1700
The first goal is 0.1970
The second target is 0.2125
The third goal is 0.2338

ALGO USDTALGO Setup. After a confirmed breakout from the marked zone in green, we could take an entry at 0.2023. Remember stop loss is your friend. Everything is on the chart.
Entry 0.2023
S.L 0.1568
T.P 1 0.2650
T.P 2 0.3112
T.P 3 0.3749
T.P 4 0.4438

ALGO: Channel Down PatternTrade setup : Trends are mixed to down. Following a failed breakout, price is back to trading within a Channel Down pattern. We wait for a breakout from the pattern and back above that 200-day MA to signal trend reversal to Uptrend again.
Pattern : Price is trading in a Channel Down pattern. With emerging patterns, traders who believe the price is likely to remain within its channel can initiate trades when the price fluctuates within its channel trendlines. With complete patterns (i.e. a breakout) – initiate a trade when the price breaks through the channel’s trendlines, either on the upper or lower side. When this happens, the price can move rapidly in the direction of that breakout. Learn to trade chart patterns in Lesson 8.
Trend : Downtrend on Short- and Medium-Term basis and Uptrend on Long-Term basis.
Momentum is Mixed as MACD Line is above MACD Signal Line (Bullish) but RSI < 45 (Bearish). MACD Histogram bars are declining, which suggests that momentum is weakening.
Support and Resistance : Nearest Support Zone is $0.15, then $0.12. The nearest Resistance Zone is $0.20, then $0.25 and $0.30.

Long term analysis of ALGO currency# ALGO time 1W currency analysis
In the weekly time, the price has reacted well to the most important level of its demand, and we can expect a good long-term growth in the price area of $0.14, and there is a possibility that the price will reach the specified goals.

Algo/usdt analysis by ict price action Hi dear traders. Following breakout pattern of algo/usdt and reaction (retest )to daily order block on price of 0.17 $ we have a 178% profit on algo .
Because:
This is best point to entry after expansion (from 0.099 to 0.329)and 50% rateracement (=0.17$) and reaction to the daily +OB and move up fast .
Good luck dears. Always be profitable 📈 ❤️
Dollars 💸 💵 💲 💰 💱 💸 💵 💲 .

ALGO: buy in low level📊Analysis by AhmadArz:
🔍Entry: 0.1784
🛑Stop Loss: 0.1557
🎯Take Profit: 0.2107 -0.2441 -0.2856
🔗"Uncover new opportunities in the world of cryptocurrencies with AhmadArz.
💡Join us on TradingView and expand your investment knowledge with our five years of experience in financial markets."
🚀Please boost and💬 comment to share your thoughts with us!

ALGOUSDT , Direct to $0.79 or …Hi everybody ,
I think a close higher than 0.2190 will
Show us a higher price,
We see Divergence in RSI , i hope it work
Please trade on your own risk

What's next for ALGO?Algorand setup is pretty clear and a continuation of the uptrend is what i expect here. If the support area at $0.19 hold, i think we can run higher and target the resistance area at $0.28

Algorand Price Analysis. Setup for LongLet's take a look in details globally and locally for BINANCE:ALGOUSDT.P
Why do i think the chart now looks more bullish than bearish! Potential targets for long and continuation!
Hope you enjoyed the content I created, You can support with your likes and comments this idea so more people can watch!
✅Disclaimer: Please be aware of the risks involved in trading. This idea was made for educational purposes only not for financial Investment Purposes.
---
• Look at my ideas about interesting altcoins in the related section down below ↓
• For more ideas please hit "Like" and "Follow"!

ALGOUSDT.1DOn the daily chart for Algorand (ALGO/USDT), ALGO appears to be in a downtrend, as highlighted by the descending trendline. The price has recently faced rejection at this trendline and is currently trading at $0.1994. There is a crucial support level (S1) at $0.1319, which could be an area of interest for buyers.
Resistance levels are established at $0.2846 (R2) and $0.3373 (R3), with R1 being the descending trendline itself. The RSI is below the midpoint at 46.63, suggesting mild bearish momentum without being in oversold territory. The MACD is below zero and the signal line, indicating bearish momentum is present.
Traders might look for potential shorting opportunities at the trendline rejections, with targets set near S1. A break below S1 could indicate a continuation of the bearish trend. Conversely, a break above the trendline could signal a change in trend and potential buying opportunities, with resistance levels as targets. It's important to monitor for a potential reversal pattern or bullish indicators before considering a long position.

ALGOUSDT Elliott Waves AnalysisHello friends.
Please support my work by clicking the LIKE button👍(If you liked). Also i will appreciate for ur activity.
Everything on the chart. (update)
Got complicated in wave of (ii), but in midterm nothing has changed from my last idea.
Entry: (im in pos from 0.184)
Targets: 0.34 - 0.46 - ~0.7
after first target reached move ur stop to breakeven
Stop: (depending of ur risk). ALWAYS follow ur RM .
risk is justified
It's not financial advice.
DYOR!

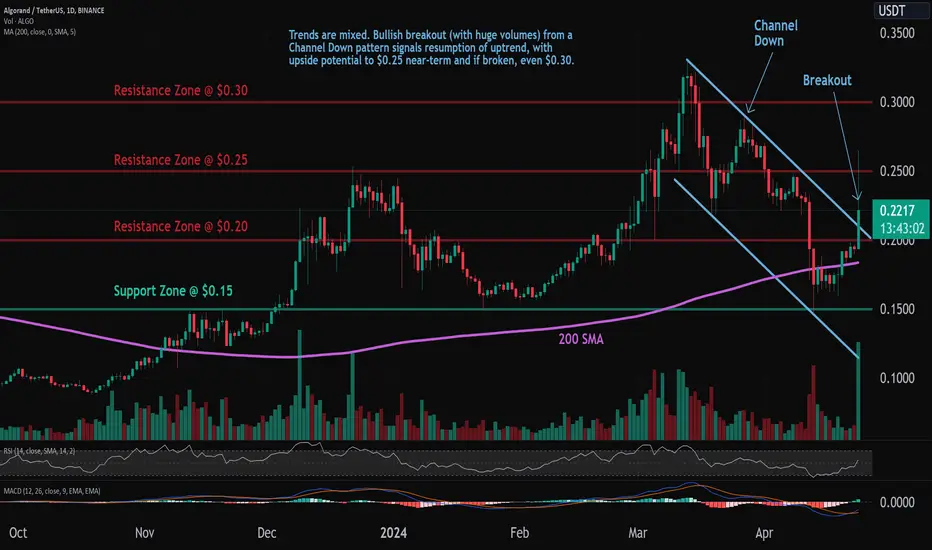
ALGO: Channel Down PatternTrade setup : Trends are mixed. Bullish breakout (with huge volumes) from a Channel Down pattern signals resumption of uptrend, with upside potential to $0.25 near-term and if broken, even $0.30.
Pattern : Price was trading in a Channel Down pattern. With emerging patterns, traders who believe the price is likely to remain within its channel can initiate trades when the price fluctuates within its channel trendlines. With complete patterns (i.e. a breakout) – initiate a trade when the price breaks through the channel’s trendlines, either on the upper or lower side. When this happens, the price can move rapidly in the direction of that breakout. Learn to trade chart patterns in Lesson 8.
Trend : Downtrend on Short- and Medium-Term basis and Uptrend on Long-Term basis.
Momentum is Bullish (MACD Line is above MACD Signal Line and RSI is above 55).
Support and Resistance : Nearest Support Zone is $0.15, then $0.12. The nearest Resistance Zone is $0.20, which it broke, then $0.25 and $0.30.

ALGO is breaking out nicely!ALGO must have gotten a little jealous of HBAR because it's breaking out now too!
2 Da Moon!

ALGO Breakout was plannedTell me who gave you the EURONEXT:ALGO thing 3 days ago?
Who is giving you these pump alerts before with chart proof?
Only AqeelOnline!! Check every trader here and tell me if anyone else is predicting the right things again n again everyday, and if there is any? Do comment me I would love to follow him/her
You are simply not an ordinary place My Friend. Just Follow! Earn some money and Remember me in your prayers if you can remember me that time. That's just I want back from you.
Happy Earnings❤

algo getting ready for another 60 to 70% bullish wave seems like algo getting ready for another bullish wave
trend is already up and now breaking bullish flag too expecting successful breakout and incase of successful breakout expecting 70 to 75% bullish wave in coming days keep eyes on algo for successful breakout

ALGO ReboundEURONEXT:ALGO is rebound from the support level 0.1550 - 0.1650 and is about to take off from here🔥🚀
I'll not book profit until 0.2150
Resistance: 0.2150 - 0.2350 area
Sl: A little below from the support area mentioned in the chart.
Good Luck!
Happy Earnings❤
#nfa #dyor #aqeelonline

Range continuesDaily in range
Htf LL? / fakeout to bothsides?....
News = terrIble
Halving tomorrow
Priced in?

ALGO USDT - Recovering after CrashALGO is recovering from crash and looking for push it upward.
Can see major resistance in the upward direction and it has also broken the trend line and can expect another LL. ALgo is in search of LH and it could move upward till 0.20 to 0.21 range.
If it breaks the structure than we can see the upward rally but I am expecting another LL.

🚀💰 ALGOUSDT: 1 to 10 Trade Opportunity!Traders, get ready for a potential game-changer with ALGOUSDT! 🚀💰
🔍 Strong Support Zone:
We're eyeing a robust support zone where buyers are showing a strong reaction. It's highly probable that they'll step in again. Remember the last time? It sparked some impressive movement!
💡 Trade Strategy:
With the potential for a 1 to 10 trade, this setup could be a golden opportunity for profit! Keep a close watch on this support zone and be ready to seize the moment when the buyers make their move.
💬 Share Your Thoughts:
What's your take on this potential trade setup? Share your insights and let's discuss the possibilities together! Your input could be the key to unlocking this exciting opportunity!
💰 Unlock the Prize:
Remember, the best comment could unlock a special prize! So don't hold back—share your thoughts and join the conversation! 🏆💬


ALGO: Descending Triangle PatternTrade setup : Price remains in an Uptrend. After making another Higher High (~$33), which is a sign of Uptrend, price is consolidating in Descending Triangle pattern. The pattern is coming to a pinnacle, which means price is about to breakout. We wait for a breakout that would signal the end of consolidation and a resumption of uptrend. Bullish breakout could see the price revisit $0.30 for +20% upside, while a bearish breakout below $0.23 support could see further downside to $0.18.
Pattern : Price is trading in a Descending Triangle pattern. Typically, a breakout will occur in the direction of the existing trend.
Trend : Downtrend on Short-Term basis, Neutral on Medium-Term basis and Uptrend on Long-Term basis.
Momentum is Bearish but inflecting. MACD Line is below MACD Signal Line and RSI is below 45 but momentum may have bottomed since MACD Histogram bars are rising, which suggests that momentum could be nearing another upswing.
Support and Resistance : Nearest Support Zone is $0.20, then $0.15. The nearest Resistance Zone is $0.25, then $0.30.
