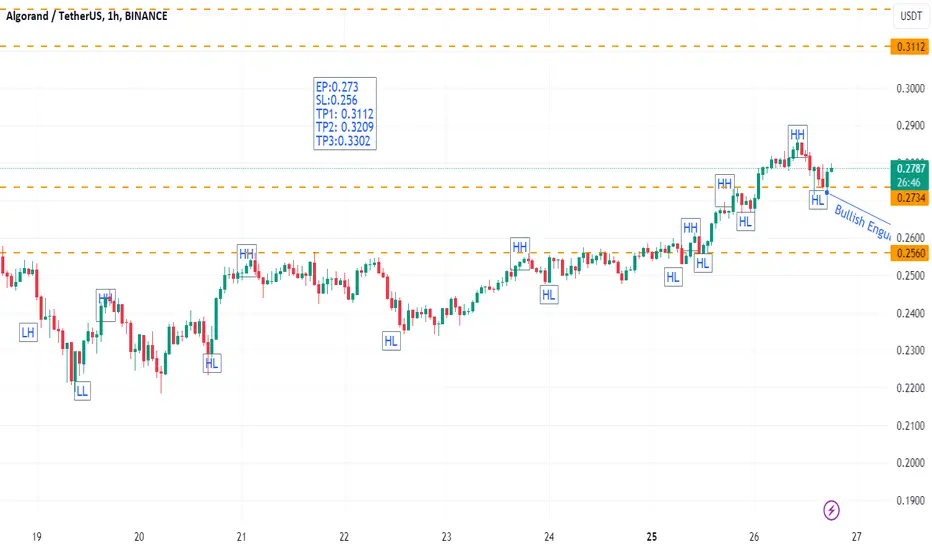
Algo - Quite Bullish Dow theoryAlgo is making HH - HL and volume is growing since last one week, quite bullish on this Pair
EP:0.273
SL:0.256
TP1: 0.3112
TP2: 0.3209
TP3:0.3302
ALGOUSDT trade ideas
ALGOUSD is printed bullish hammer closed on HL sideALGOUSD is printed bullish hammer close on HL in 1Hour time frame


Possible daily bullish divergence setUPPossible daily bullish divergence setUP
the most annoying part of the cycle IMO


ALGOUSDT: Falling Wedge - Getting Ready for breakoutFalling wedge is bullish pattern (reversal pattern) formed by two converging bearish lines.
As you can see in the chart, BINANCE:ALGOUSDT has formed a clear falling wedge patter.
If the breakout is confirmed, we can enter the trade around 0.173
After the breakout we can expect a minor correct, however breakout entry should be good and position can be average to get better entry price if the correction happens.
EntryPrice: 0.1734 (after breakout) - 0.165 (for averaging the entry)
Stoploss: 0.1490
TP1: 0.1894
TP2: 0.2040
TP3: 0.2253
TP4: 0.2531
Don't forget to keep stoploss.
Like and follow us for more interesting ideas.
Cheers
GreenCrypto

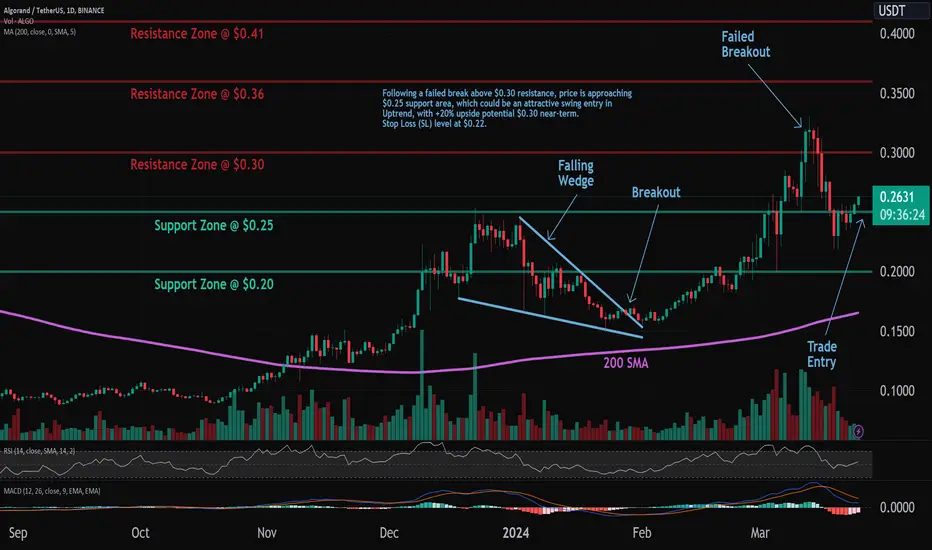
ALGO: Pullback in UptrendTrade setup : Price remains in an Uptrend. Following a failed break above $0.30 resistance, price is approaching $0.25 support area, which could be an attractive swing entry in Uptrend, with +20% upside potential $0.30 near-term. Stop Loss (SL) level at $0.22.
Trend : Uptrend across all time horizons (Short- Medium- and Long-Term).
Momentum is Mixed as MACD Line is below MACD Signal Line (Bearish) but RSI ~ 50 (Neutral). MACD Histogram bars are rising, which suggests that momentum could be nearing another upswing.
Support and Resistance : Nearest Support Zone is $0.25, then $0.20. The nearest Resistance Zone is $0.30, then $0.36 and $0.41.
Ready For Short!High Liqudty Will Come Today Because Today Is Monday And It Will Be The Big Sellers Demand.So I Think Market Will Go Down And Make Hanging Man Candle.

Chance of growth up to 30%This currency is in an upward trend and there is a good opportunity for the growth of this currency, according to the chart and analysis, you can enter with capital management.

Above 300%Hello
ALGOUSDT will increase by approximately 300%, making it possible to achieve higher targets.
I deleted my indicators.
Spot trade please.

One Shot Two Birds!In 22.03.2024 Day Chart Candle Show us some little strong Buyers and today Littele Strong Buyers Had Been Big Buyers.So Tommorow Ithink There Will Be Small Sellers And Big Buyer.Let's See.

Algorand on a Classic Mooove 🚀Hey Traderz,
The Chart says the story. Classic Rounding Bottom Pattern with a nice pullback.
Hoping for a 100% gain. Let's hope for some positive news coming on the corner and the price raise quicker.
Don't let greed catch you. Book the profits and Exit the markets.
Entry - Around 0.2427 - 0.2600
Stoploss - 0.2000
- Everything depends on How BTC performs. But let's keeeeep hope.
Happy Trading !!!!

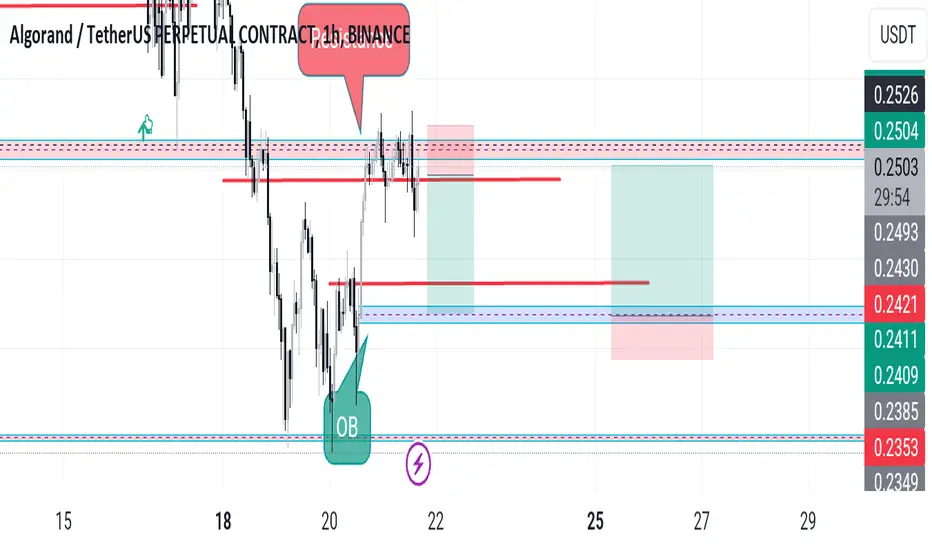
ALGO WHERE?Algo is currently at a resistance zone. I anticipate a price drop and plan to go long on the blue box areas that I have marked because there is an order block there.
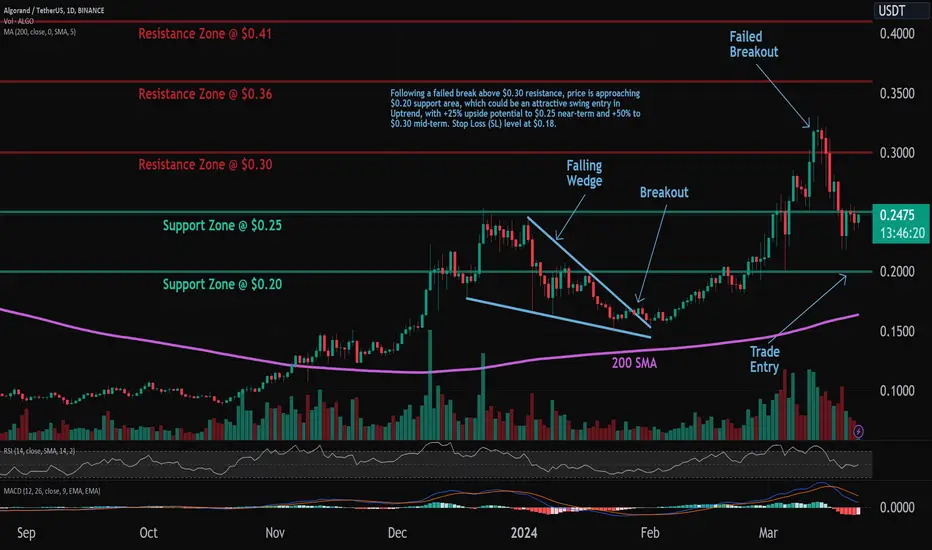
ALGO: Pullback in UptrendTrade setup : Price remains in an Uptrend. Following a failed break above $0.30 resistance, price is approaching $0.20 support area, which could be an attractive swing entry in Uptrend, with +25% upside potential to $0.25 near-term and +50% to $0.30 mid-term. Stop Loss (SL) level at $0.18.
Trend : Neutral on Short-Term basis and Uptrend on Medium- and Long-Term basis.
Momentum is Mixed as MACD Line is below MACD Signal Line (Bearish) but RSI ~ 50 (Neutral).
Support and Resistance : Nearest Support Zone is $0.25, which it broke, then $0.20. The nearest Resistance Zone is $0.30, then $0.36 and $0.41.
Ready For Another Short!I Think Btc Market Over Bought Becouse The Halving Event.But Halning Event Not Over Yet.So Ithink Btc Market Now Have Short Trend So Let's Scalping.

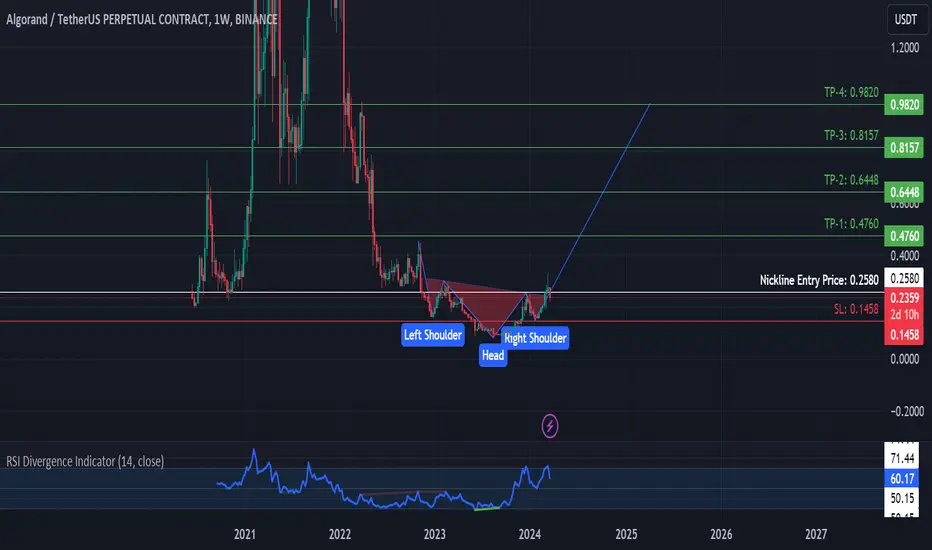
"🚀 ALGOUSDT: Inverse Head & Shoulders Breakout Imminent! 🚀ALGO appears to be gearing up for a major move as it completes the Inverse Head & Shoulders pattern on the 1 week chart. 📈 The absence of bearish divergence and any downtrend signals, combined with the current consolidation around the neckline, sets the stage for a potentially bullish breakout.
🔍 Key Levels to Watch:
Neckline Breakout: Look for a decisive move above the neckline.
Retest Confirmation: A successful retest post-breakout will strengthen the bullish case.
📊 Trade Strategy:
Considering the technical setup, we anticipate a robust bullish trend once the neckline resistance is breached. Traders may want to position themselves for a potential long ride, pending confirmation.
🚨 Risk Management:
As with any trade, it's essential to implement proper risk management. Set stop-loss levels to mitigate potential downsides.
📈 Targets:
Keep an eye on key resistance levels for potential take-profit zones.
👉 Disclaimer:
This analysis is for educational purposes only and not financial advice. Always conduct your own research before making trading decisions.
👀 **Stay tuned for real-time updates! Like and follow for more insights. Let's navigate these markets together! 🌐 #ALGO #Crypto #TradingView #TechnicalAnalysis #ALGO
Algousdt 1W Hello friends, I hope you are doing well, you can see the algo chart in a weekly time frame. It has formed a head and shoulder pattern, and if it stabilizes above the resistance box, it can take an upward trend until the specified target

ALGOUSDT downtrend broken, potential move in coming monhs +120%ALGOUSDT downtrend broken, potential move in coming monhs +120%

Let's Ready For Another Short JournyLook The Chart Pattern Of The BTCUSDT
.It Has long Seller Zone So New Coming Traders Think It"s Good To Enter Short Position And Market Wil Be go Down

Algorand(ALGO): Potential Movement To Lower Zones!Algorand has been showing some steady movement to lower zones, where we see multiple signs of weakness.
With that being said, we are pretty confident to see some further movement here, potentially securing fully both 100 and 200 EMA by bears.
Multiple good scalps can be taken here as well, we see!
Swallow Team

ALGO USDT -21/03/24 UpdateALGO USDT -21/03/24 Update
Still going UP all the way to 0.27989.
Going to take some time to reach the TP...

Algorand uptrend local targetsBINANCE:ALGOUSDT
Lets take a look on D timeframe for Algo
Possible Targets and explanation idea
➡️Local fib we perfectly touched -0.18 lvl and would be good to test green block again
➡️Like usual we got many variations of price movements but I marked 2
➡️Both of this price movement for continuation Up.
➡️Green - retest 27 block and continuation in spring
➡️Red - retest buy line "take profit" indicator on D and Up
Hope you enjoyed the content I created, You can support with your likes and comments this idea so more people can watch!
✅Disclaimer: Please be aware of the risks involved in trading. This idea was made for educational purposes only not for financial Investment Purposes.
---
• Look at my ideas about interesting altcoins in the related section down below ↓
• For more ideas please hit "Like" and "Follow"!

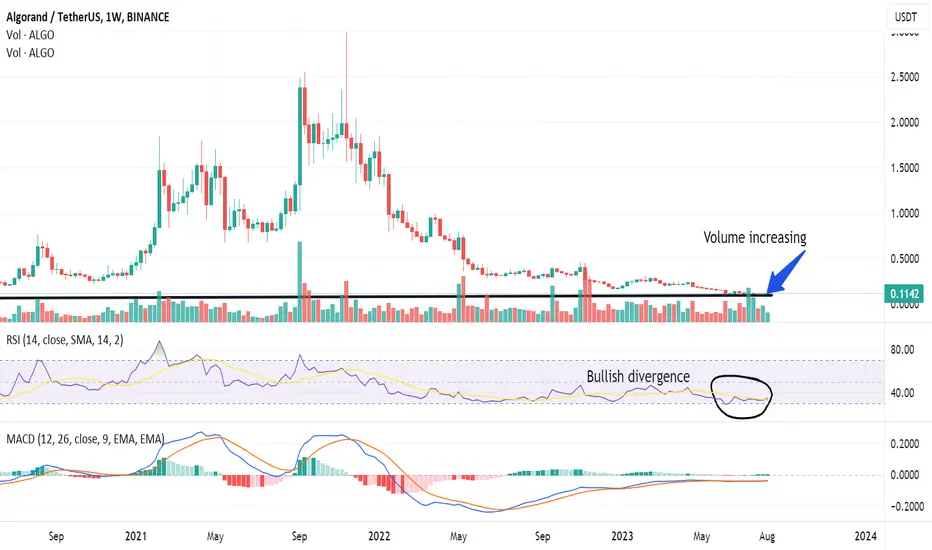
Bullish uptrend COMING SOON Algousdt, AlgorandDear friends, Algorand has been in a downtrend for MANY MONTHS, it reached major support area of 0,09 cent. (ATTENTION, it still can FALL lower). Now Algorand seems to be establishing a BOTTOM.
Bullish signs: Bullish divergence, volume increasing, major support zone, oversold territory.
2 things can happen now: Algorand slowly increases. Or Algorand makes new low under 0,09 to take stop-losses and liqiudity and then starts an uptrend.
BINANCE:ALGOUSDT COINBASE:ALGOUSD KUCOIN:ALGOUSDT