ALGOUSDT trade ideas

ALGO Sell Limit 🤓🔻🤓🔺️🤓🔺️Hi dear traders
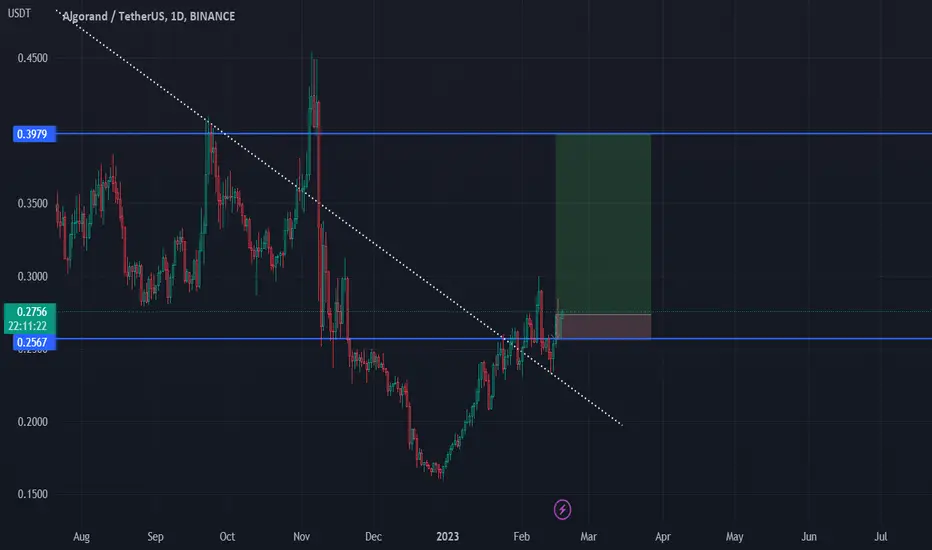
ALGO has formed Descending Triangle.
Now we can open short position and take some profit 📈.
Open position now or wait ✋until breakout trend line.
The stop loss above the long shadow of the candle.
We are trying to take profit in short term.
Let's see what happens
This is not financial advice ( DYOR )
Good luck

ALGO Idea | ALGOUSD | ALGOUSDT ALGOUSD | ALGOUSDT
✅ ✅ Risk warning, disclaimer: the above is a personal market judgment and analysis based on published information and historical chart data on The trading view,
And only some of these analyzes are my actual real trades.
I hope Traders consider I am Not responsible for your trades and investment decision.

ALGO/USDT waiting for correctionHey, guys ✌️
ALGO/USDT is going to be the first one we will be looking into today. Currently pushing that upper resistance zone (pink zone) we see a good chance breaking it and going towards 200EMA, after what we should get a correctional movement towards $0.16 zone.
There is also a chance that we won't try to go for that 200EMA zone and go straight to test that 100EMA
If you like ideas provided by our team you can show us your support by liking and commenting.
Yours Sincerely,
Swallow Team 🔱
Disclamer:
We are not financial advisors. The content that we share on this website are for educational purposes and are our own personal opinions.

ALGO BUllish Pennantwe've got ALGO inside a pennant formation and let me tell you, it's getting charged up for another leg up. ALGO just recently retested and broke through its trendline resistance, which was previously acting as support before the breakdown. Now, it's making a strong push to break through this bullish pennant, but you need to be careful with your trades, my friends. This is not the time to get reckless with your investments.
And here's the thing, we can't forget about BTC. It's the elephant in the room, and it's the weekend, so you need to keep a close eye on it as well. You know how volatile the crypto market can be, and we can't afford to let our guard down. So, stay sharp, stay vigilant, and make your moves strategically. The name of the game is risk management, and if you do it right, you'll come out on top.

ALGOUSDT is breaking upThere is a triangle with flat top printing, the volatility is extremely low which together mean that we're gonna see a big upward movement soon. Draw a harmonic way of how the incoming growth might look. Hope it be useful to you. I do these setups because despite the fact that alts have grown a lot this year, there's much more to come so I'm looking for a hope for a safe entry to the coins in order to get +500% despite the fact that it has already made +150%. Also it's useful for holders - so that you could see the potential of a coin.

Breakout potential for AlgorandALgo is looking primed and ready for a breakout.
There's al ot going on here.
The Tldr is , I anticipate a brekaout along with a handful of other coins that are in a similar position such as Ada ACH

ALGOUSDTLooks like a great long here after breakout and retest of trendline.
Next order block is at 39 cents.

ALGO LOOKS BULLISHHi, dear traders. how are you ? Today we have a viewpoint to BUY/LONG the ALGO symbol.
For risk management, please don't forget stop loss and capital management
When we reach the first target, save some profit and then change the stop to entry
Comment if you have any questions
Thank You

AlgorandAlgorand technical analysis basically on elliott waves Principles and Pricecation strategy
Algorand can be grow to 1.25$
please wait for breakout and Pullback
Wait and watch.

ALGOUSDT is testing the ascending channelALGOUSDT is currently testing the ascending channel, with the price hovering around the 0.24$ level. where the market has the liquidity zone
A "liquidity zone" is a term used in trading to refer to a specific price range where there is an abundant amount of trading activity and therefore a higher volume of trades taking place.
The market is closely watching for any signs of a potential breakout from the 4 hour resistance line.
If the price does indeed break out and meet the criteria set by Plancton's rules,
it could provide a favorable entry point for a long position trade
–––––
Follow the Shrimp 🦐
Keep in mind.
🟣 Purple structure -> Monthly structure.
🔴 Red structure -> Weekly structure.
🔵 Blue structure -> Daily structure.
🟡 Yellow structure -> 4h structure.
⚫️ Black structure -> <= 1h structure.
Follow the Shrimp 🦐

ALGO/USDT Approached the trend here!!!Hey, guys ✌️
Next one is going to be ALGO coin. Well we are at trend here and see a good chance for some major movement to happen. Until we are above the trend we see a good bullish movement to occur here but as soon as we break this trend and secure a day below that we see a good chance for a drop towards at least $0.2320
If you like ideas provided by our team you can show us your support by liking and commenting.
Yours Sincerely,
Swallow Team 🔱
Disclamer:
We are not financial advisors. The content that we share on this website are for educational purposes and are our own personal opinions.

ALGO - 1H Bullish in the channelAlgorand has a perfect channel with incredible reactions on each trend line, as a result, we can trust this channel and enter a position with signals. (We haven't opened this position yet, we are monitoring the market and price signs.)

ALGO MOVING WITHIN ASCENDING CHANNELAfter finding rejection at the last ranges VAL of 0.2928, ALGO has now retraced to 0.2682 which is exactly where the 0.618 fib level form the last high.
If you think you've gotten awesome content from my TA, please smash that like (boost) button!
It keeps me motivated to continue hitting the charts for y'all!!
I'd also love to see requests on any chart you'd like me to look at!
So please leave a comment on what Analysis you'd like me to do next! <333333


ALGOUSDT wants the Weekly resistance?An ascending channel is a technical chart pattern that occurs when price creates a series of higher highs and higher lows, forming two upward sloping parallel trend lines. In the case of ALGOUSDT, the pair is inside an ascending channel below the weekly key resistance at 0.27$, where the price has bounced several times in the past.
The price currently needs to grab liquidity in order to make a new breakout above the resistance, and we are watching this pair in order to apply our strategies.
A successful breakout above the resistance could signal a continuation of the uptrend and indicate further price appreciation, so According to Plancton's strategy , we can set a nice order
–––––
Keep in mind.
🟣 Purple structure -> Monthly structure.
🔴 Red structure -> Weekly structure.
🔵 Blue structure -> Daily structure.
🟡 Yellow structure -> 4h structure.
⚫️ black structure -> <= 1h structure.
–––––
Follow the Shrimp 🦐


Trading Idea 035: AlgorandMarket Conditions:
- bullish trend
- bullish sentiment in the market
Key Level and Lines:
- $0.2515 support
Trading Ideas:
- go long after consolidation above the support
- go short if the price moves below the support and there is bearish sentiment in the market.

The Ultimate Algorand (ALGO) Analysis - Bottom $0.1618On the 22nd June 2019, Algorand opened at a price of around $3.28 on Coinbase, and slightly higher on Binance.
Over the next few months, it dropped to around $0.1648 (maybe $0.1618 on some exchanges) and then $0.097 at the Covid crisis.
Before the 2021 bull run, in November, ALGO's Support level was around $0.2247 (Point X of the harmonic) before it began its ascend.
In early February of 2021, ALGO topped around $1.8427 (Point A of the harmonic)
This increase is by an exact amount of $1.618, the main number in the Fibonacci sequence.
Coincidence? I don't think so.
After it dropped to Point B of the harmonic, around $0.67, which is a very strong Support/Resistance level.
Notice the number - 0.67 is exactly 2/3 of 100.
If I multiply 0.6667 by 0.6667 I get 0.44444.
0.6667 - 0.44444 = 0.223, the EXACT NUMBER of Algorand's Support level before the bullrun.
OK, now this is getting crazy.
Algorand then increased by 161.8% (A-B) to create Point C (around 2.5589).
It then dropped to around $1.5144 - the 0.444 support level (which I have marked "S"). (Remember that 0.4444 number from earlier? Yeah.....)
The price was then manipulated up to around $2.99-$3.
This manipulation point is a whole new conversation involved with even more complex numbers and I think its best we avoid this in this argument, since it doesn't affect this current idea.
ANYWAY, if we ignore the manipulation which we usually do in these circumstances and create Point C as our harmonic level, we can see that BC is a +1.618% of AB.
Now if we draw a fib between ZERO and A we get 0.618 which is at point B
OR
if we draw a fib between $0.223 (Start of 2021 bull run) and $1.84 ish (Point A), we get the retracement value around 0.707 which is half of the value of 1.414, and 1.414 is the square root of 2.
So AB is (XA x half of the square root of 2) and the next move entails a 1.618 move of that figure.
Crazy maths...
Anyway, In a standard AB=CD HARMONIC PATTERN, we have 3 different variations, AB=CD, AB=CDx1.272 or AB=CDx1.618.
The most common one is 1.272, which is the square root of 1.618.
Now what happens if we measure BC x 1.272?
The answer is a price of ALGO of $0.1618.
As soon as I saw that it hit me.
That's the bottom.
$0.1618, the Fibonacci golden number will likely be the bottom of Algorand in this cycle.
So what is the profit target?
So I checked a few measurements.
I tried CD x 1.618 (if we hypothetically say that $0.1618 is the bottom of Algorand this cycle) and that gave me a figure of around $4.03.
I also did (All Time High minus All Time Low) x 1.272 (the square root of 1.618)
and that gave me a similar figure of around $4.03.
OH ALSO, one last thing...
Algorand is currently in a Bear Flag, the target is around $0.223-0.226 to Buy the bounce. It will go lower around Christmas time, but if you look at the 1.414 level (square root of 2) of the Bear Flag, it also reaches the same point around $0.1618!

ALGO/USDT Daily Bearish Orderblockthe price is near a very important daily bearish orderblock and the price can reverse from this area.
However, in important areas, always get approval according to your personal strategy before entering the trade

Longing ALGOUSDT 20xTaking a long, algo looking really bullish for the past week, In a hurry so not much TA Talk here
DYOR

ALGO SHORTIn daily time frame a weakness in moving toward the upper levels is obvious, so could have provided a short position
